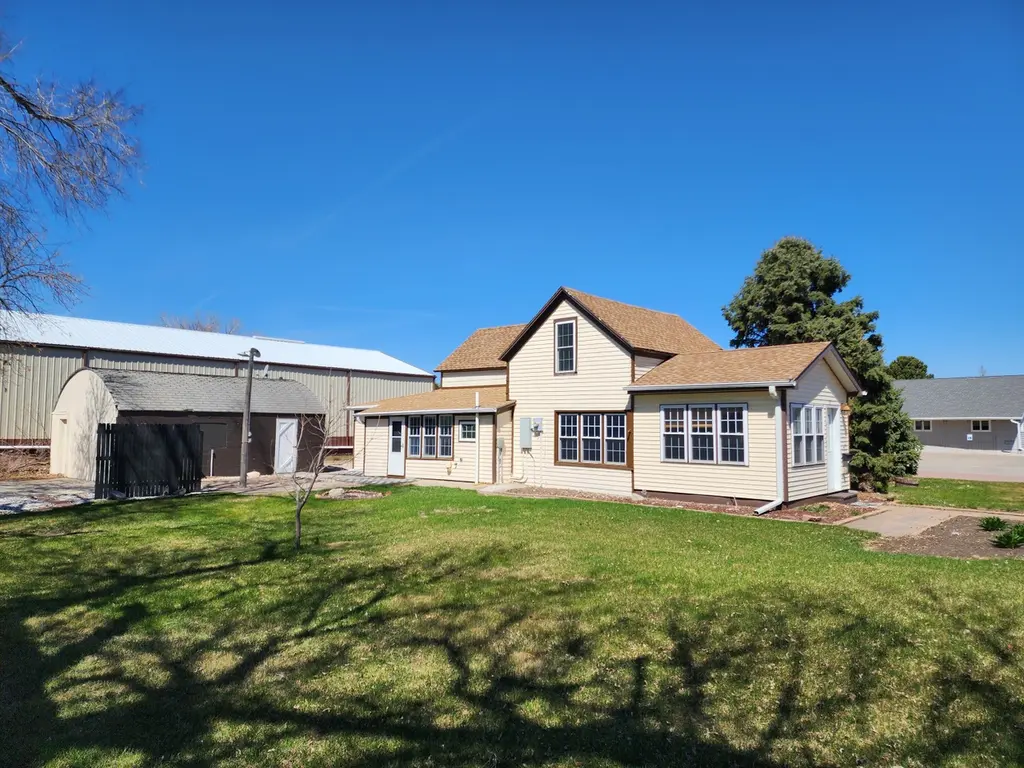
185 N Dakota Ave · Corsica, SD
Flood risk 1/10 · Minimal
- FEMA flood zone
- —
- Chance of flooding over 30 yrs
- 0.0%
- Est. flood insurance / yr
- —
Fire risk 3/10 · Minor
- Est. fire insurance / yr
- $1,342 – $2,492
Heat risk 3/10 · Minor
- Hot days now (above 103°F)
- 7 days/yr
- Hot days in 30 yrs
- 14 days/yr
Wind risk 2/10 · Minimal
- Chance of severe wind over 30 yrs
- —
Air-quality risk 2/10 · Minimal
- Unhealthy air days now
- 1 days/yr
- Unhealthy air days in 30 yrs
- 1 days/yr
Risk factors via First Street. Map © Google.
Why this score? — see what drove the B- grade
The composite is a weighted blend of 9 inputs, each scored 0–100. Each bar is that input's sub-score; the figure is the points it added to the 100-point composite (weight × sub-score).
- Cash flow +24.7/30.0
- DSCR +8.0/10.0
- ARV discount +7.5/15.0
- 1% rule +6.4/10.0
- Appreciation +5.0/10.0
- Schools +5.0/10.0
- Condition / age +3.8/5.0
- Livability +3.2/5.0
- Rent growth +2.5/5.0
$99,000
🖨 Deal sheet 📄 Offer letter ✓ Due diligence
Key facts
- 0.41 acre lot
- Garage
- Built 1905
Property features AI
Exterior
- Parking: Detached parking
- Home design: Single-family residence; Single-story
- Exterior features: Asphalt roof
Interior
- Kitchen: Range, Oven
- Bathrooms: 1 full bathroom
- Heating & cooling: Central air conditioning; Electric baseboard heating
- Interior features: Range, Oven, Washer; Partial basement
- Laundry & utility: Washer
Neighborhood map
What this means for you Summary
Snapshot
- This is a 4-bed/1.0-bath single-family listed at $99k. Condition is rated good.
Deal economics
- At list price, monthly cash flow is $207 ($2k/yr) — positive.
- The deal already cash-flows at list — no discount required.
- Meets the 1% rule at list price ($1k rent vs $99k).
- Recommended offer: $93k (6.0% below list) — sets the bar for market timing.
Location & tenants
- Location reads 65/100 on livability (#146 in SD) — a middle-class / working-renter tenant base. Strengths: cost of living A+, housing A+; Watch: crime D-, amenities F, commute F.
- Market conditions: 6 active listings in the ZIP; 6 units permitted in Douglas County in 2024 (0 in 5+ unit buildings).
Forward outlook
- In year one you build about $4k of equity ($684 loan paydown + $3k appreciation (3.0% local appreciation)).
- Douglas County population projected to shrink 3% by 2050 — rents likely to lag national; underwrite the cash flow, not the appreciation.
- At projected returns (3.0% appreciation + 3.0% rent growth), your $28k cash investment doubles in ~5 years — after that, you're playing with house money.
- By year 9, paydown + projected appreciation supports a ~$31k cash-out refi (75% LTV) — recoverable capital for the next deal without selling this one.
Negotiation context
- It's been on market 68 days — a 6% lower offer ($93k) is reasonable based on typical stale-listing flexibility.
Risks & watch-outs
- Watch-outs: built in 1905 — expect roof / HVAC / electrical / plumbing capex.
Questions for the listing agent
- It's been on market 68 days. Have you received any prior offers? Is the seller open to a 6% concession, seller financing, or rate buy-down credit?
- Built in 1905 — when were the roof, HVAC, electrical panel, plumbing, and water heater last replaced?
- Why hasn't it sold? Are there any deal-killer items the seller is aware of (foundation, flood, title, zoning, code violations)?
- Is there a deadline driving the sale (1031 exchange, divorce, estate, relocation)? That informs how much negotiation room exists.
- Crime grade is D in this area — have there been break-ins, vandalism, or insurance claims at this property in the last 3 years? What carrier currently insures it and at what premium?
- What's the average days-on-market for RENTAL listings here right now (not sales)? A rising rental-DOM trend means longer vacancies and softer asking-rent achievability than the comps imply.
- What's the recent tenant-quality profile in this submarket — average credit score on applications, eviction rate, late-payment / NSF rate, and stable-employment percentage? A property-management company in the area should have these aggregated.
- How much new for-sale + rental construction is in the pipeline within 1–3 miles? Heavy new supply typically softens prices + rents 12–24 months out; constrained supply supports both.
Investment metrics
- 1% rule
- 1.14% ✓
- Cap rate
- 8.80%
- Cash-on-cash
- 8.94%
- DSCR
- 1.40
- GRM
- 7.3
CMA / ARV
- ARV (on-the-fly)
- $25,366
- Comps found
- 1
Show comp detail 1 sale within ~0.75 mi
| Address | Dist | Beds/Ba | Sqft | Sold | Price | $/sf | Match |
|---|---|---|---|---|---|---|---|
| 280 S Dakota Ave | 0.19mi | 4/1.0 | 1,146 (-1%) | 11mo | $25,000 | $22 | 81 |
Match score weights: distance 35% · size 25% · config 20% · recency 20%. Top-matched comps best support the ARV.
Projected returns pro-forma
3.0% appreciation · 3.0% rent growth · sell at horizon
- IRR
- 15.9%
- Equity multiple
- 1.91×
- Total profit
- $25,096
- Equity at exit
- $44,515
- IRR
- 17.5%
- Equity multiple
- 3.56×
- Total profit
- $70,944
- Equity at exit
- $68,602
Cash invested: $27,720 (down + closing). Projections, not guarantees.
Landlord ↔ Tenant lean methodology
- Overall (STATE)
- 83 Strongly Landlord-Friendly
- State South Dakota
- 83 Strongly Landlord-Friendly · R+16
- County
- — inherits STATE
- City
- — inherits STATE
ZIP-level market 57328
- Active inventory
- 6
- Price-to-rent
- 7.3×
Monthly cashflow live
- Estimated rent
- $1,127 medium interval (Pro) →
- Mortgage (P&I)
- −$519
- Tax est. 1.5%
- −$124 /mo · $1,485/yr
- Insurance
- −$41
- HOA
- −$0
- Vacancy / Maint / Mgmt
- −$237
- Net cashflow
- $207
Break-even live
UW: 25.0% down · 7.5% · 30yr · 1.5% tax · 5.0% vac · 8.0% maint · 8.0% mgmt
Financing live
Cash to close
- Down payment
- $24,750
- Closing costs
- $2,970
- Reserves months
- —
- Total cash needed
- —
Loan-product check · same deal, 3 products live
Conventional
25% down · 7.5% · 30yr
- Down + closing
- —
- Monthly P&I
- —
- Monthly cashflow
- —
- DSCR
- —
- Eligible?
- —
Personal DTI + credit; lowest rate.
DSCR
20% down · 8.5% · 30yr
- Down + closing
- —
- Monthly P&I
- —
- Monthly cashflow
- —
- DSCR
- —
- Eligible?
- —
No personal income docs; deal must DSCR.
Hard money
10% down · 12.0% · 12mo
- Down + closing
- —
- Monthly P&I
- —
- Monthly cashflow
- —
- DSCR
- —
- Eligible?
- —
Short-term bridge; refi at stabilization.
Listing history 15 events
-
2026-06-18days on market $99,000 Active 68 DOM
-
2026-06-17days on market $99,000 Active 67 DOM
-
2026-06-16days on market $99,000 Active 66 DOM
-
2026-06-15days on market $99,000 Active 65 DOM
-
2026-06-13days on market $99,000 Active 63 DOM
-
2026-06-12days on market $99,000 Active 62 DOM
-
2026-06-09days on market $99,000 Active 59 DOM
-
2026-06-08days on market $99,000 Active 58 DOM
-
2026-06-08days on market $99,000 Active 57 DOM
-
2026-06-05days on market $99,000 Active 55 DOM
-
2026-06-04days on market $99,000 Active 53 DOM
-
2026-06-02days on market $99,000 Active 52 DOM
-
2026-06-01days on market $99,000 Active 51 DOM
-
2026-05-31days on market $99,000 Active 50 DOM
-
2026-04-11$110,000 Active
ⓘ Source: listings_history table (triggers on properties + properties_extension) + one-shot
backfill from property_details.listing_events for pre-trigger history.
Climate risk First Street
- Flood 1/10 Low 0% chance over 30 yrs
- Wildfire 3/10 Moderate
- Heat 3/10 Moderate 7 d/yr ≥103°F today · 14 d/yr by 30 yrs out
- Wind 2/10 Low
- Air quality 2/10 Low 1 unhealthy d/yr today · 1 by 30 yrs out
Nearby sold comps map
Loading sold comps map…
Walkable amenities ~0.75 mi
Loading nearby amenities…
Taxation est. · year 1
- Rental income
- $13,529
- − Mortgage interest
- −$5,546
- − Property taxes
- −$1,485
- − Insurance
- −$495
- − Repairs & maintenance
- −$1,082
- − Management
- −$1,082
- − Depreciation
- −$2,880
- Taxable income
- $959
- Est. tax owed @ 24.0%
- −$230
- After-tax cash flow
- $2,248/yr
For passive investors: Depreciation is non-cash, so a rental often shows a tax loss while cash-flowing — sheltering income. Rental losses are passive: they offset passive income freely, and up to $25,000/yr can offset ordinary (W-2) income if you actively participate and your MAGI is under $100k (phasing out to $0 by $150k); unused losses carry forward. On sale, claimed depreciation is recaptured at up to 25%, and gains may owe capital-gains tax (a 1031 exchange can defer both). Figures are a year-1 estimate at your 24.0% rate — not tax advice; consult a CPA.
Condition & rehab AI · 13 photos
This single-family home in Corsica, SD is in good condition with a good roof, exterior, and interior. It has a good foundation and structure, and the HVAC system appears to be in good condition. The home is move-in ready and has good curb appeal. The most impactful updates would be to touch up the paint, improve the landscaping, and maintain the HVAC system.
Value-add opportunities
- Resale Paint touch-ups — Fresh paint enhances curb appeal and can make the home look more inviting
- Both Landscaping improvements — Well-maintained landscaping can increase both resale and rental value
- Both HVAC maintenance — A clean and efficient HVAC system can improve comfort and energy efficiency
Renovation cost estimate screening
Value-add ROI direction
- Resale Paint touch-ups — Fresh paint enhances curb appeal and can make the home look more inviting ↑
- Both Landscaping improvements — Well-maintained landscaping can increase both resale and rental value ↑
- Both HVAC maintenance — A clean and efficient HVAC system can improve comfort and energy efficiency ↑
ⓘ Cost ranges are severity-bucket heuristics (US national rule-of-thumb). Get contractor quotes + a written scope before underwriting a rehab budget.
Schools (NCES district)
No district data.
Livability — Corsica
- Score
- 65/100
- State rank
- #146
- US rank
- #12841
Category grades
Schools grade is shown separately in the Schools card above.
Census & demographics
- Census place
- Corsica, SD
- Population (ZIP)
- 1,225
Population outlook (Douglas County) Hauer SSP2
- Today (2025)
- 2,874 people
- By 2030
- 2,835 · -1.4%
- By 2040
- 2,795 · -2.7%
- By 2050
- 2,780 · -3.3%
- By 2075
- 3,181 · +10.7%
- By 2100
- 3,649 · +27.0%
Race, ethnicity, and origin ACS 2023
- Neighborhood character
- Predominantly White (96%)
- Race & ethnicity
- White 96% Native American 2% Two or more races 1%
- Common ancestry
- Iranian 43% Portuguese 4% Romanian 1%
- Foreign-born
- 1% · Canada
- Languages at home
- 98% English-only · Spanish 1% German/W. Germanic 1%
Political lean MEDSL · Douglas
- 2024 margin
- Solid R (+72.4) · D 13.2% · R 85.6% · Other 1.2%
- 2008→2024 swing
- -22.9pp toward R · 2008: -49.5pp · 2024: -72.4pp
- All cycles
- 2024: R+72.4 2020: R+73.3 2016: R+70.0 2012: R+59.3 2008: R+49.5
Not yet ingested
- Civics
- —
Market trends
- HPI YoY
- —
- Current HPI
- —
- Rent YoY
- —
- Metro
- —
- State GDP YoY
- ▲ 0.70%
- F500 in state
- 2
Industry mix (Fortune 500 HQ in SD)
| Industry | F500 HQs | Revenue |
|---|---|---|
| Utilities | 1 | $1B |
|
||
Price history
1 event — show timeline
- 2026-04-11 Listed $110,000 MBOR
Cash-flow waterfall
monthlySold comps — $/sqft
last 12 mo · ≤1 miLoading sold comps…