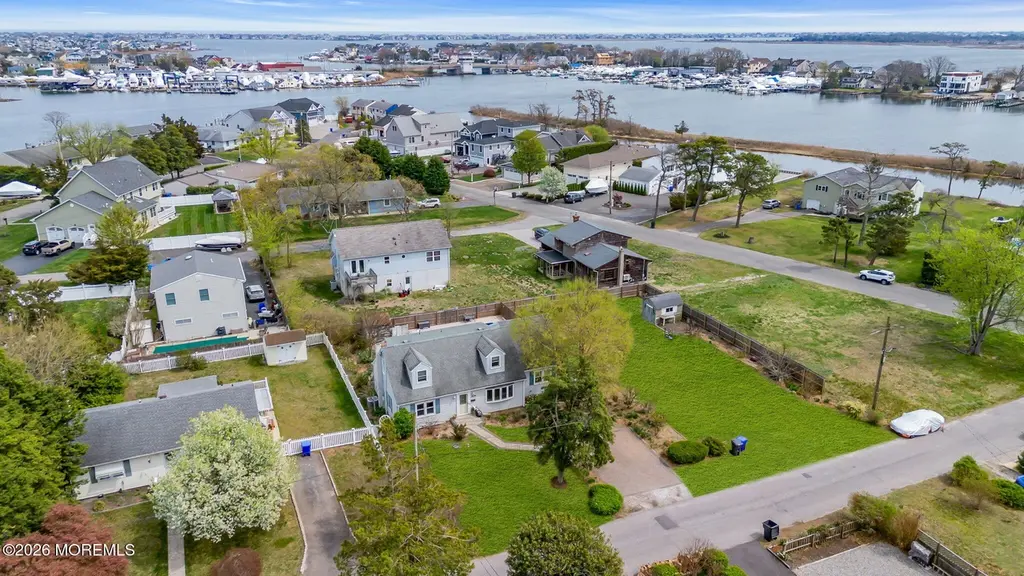
611 Fisherman Pl · Point Pleasant, NJ
Flood risk 8/10 · Major
- FEMA flood zone
- X (shaded)
- Chance of flooding over 30 yrs
- 0.99%
- Est. flood insurance / yr
- $507 – $1,088
Fire risk 2/10 · Minimal
- Est. fire insurance / yr
- $526 – $976
Heat risk 8/10 · Major
- Hot days now (above 97°F)
- 7 days/yr
- Hot days in 30 yrs
- 15 days/yr
Wind risk 8/10 · Major
- Chance of severe wind over 30 yrs
- 80.0%
Air-quality risk 3/10 · Minor
- Unhealthy air days now
- 3 days/yr
- Unhealthy air days in 30 yrs
- 5 days/yr
Risk factors via First Street. Map © Google.
Why this score? — see what drove the B+ grade
The composite is a weighted blend of 9 inputs, each scored 0–100. Each bar is that input's sub-score; the figure is the points it added to the 100-point composite (weight × sub-score).
- Cash flow +30.0/30.0
- ARV discount +15.0/15.0
- 1% rule +10.0/10.0
- DSCR +10.0/10.0
- Livability +3.8/5.0
- Schools +2.8/10.0
- Rent growth +2.5/5.0
- Condition / age +2.5/5.0
- Appreciation +0.0/10.0
$699,900
🖨 Deal sheet 📄 Offer letter ✓ Due diligence
Listing remarks
Located in the Midstreams neighborhood, this spacious home sits on an oversized lot and offers generous living space, a flexible layout, and lots of opportunity to upgrade. First floor living is easy with two bedrooms with hardwood floors and a bright full bath with a skylight and bonus direct access to the backyard. The first floor also features hardwood floors in the living and dining rooms, a gas fireplace, and a sunroom with skylights and sliders leading to the backyard. Outdoor living shines with composite decking, a saltwater inground pool, retractable awning, electric hookup for a hot tub, and a storage shed. Upstairs, you'll find two more bedrooms with tons of built in storage and a
Key facts
- Gas fireplace
- Oversized lot
- Hardwood floors
Tags
Property features AI
Exterior
- Parking: No garage
- Utilities: Public sewer
- Exterior features: Shingle roof; Located in the Jordan Park subdivision; Fee simple ownership
Interior
- Bedrooms: 4 bedrooms
- Flooring: Ceramic tile; Wood
- Bathrooms: 2 full bathrooms
- Heating & cooling: Hot water heating; Baseboard heat; 2-zone heating; 2-zone air conditioning
- Interior features: One fireplace
Neighborhood map
What this means for you Summary
Snapshot
- This is a 4-bed/2.0-bath single-family listed at $700k.
Deal economics
- At list price, monthly cash flow is $5k ($60k/yr) — positive.
- The deal already cash-flows at list — no discount required.
- Meets the 1% rule at list price ($12k rent vs $700k).
- Recommended offer: $689k (1.5% below list) — sets the bar for market timing.
- Cap rate 15.0% vs local median 2.8% in Point Pleasant — top-decile yield for the area; either an underpriced asset or a hidden risk that comps aren't pricing in. Stress-test before assuming the spread holds.
Location & tenants
- Location reads 76/100 on livability (#136 in NJ, #3,574 nationally) — a middle-class / working-renter tenant base. Strengths: crime A+, employment A+, housing A+; Watch: amenities F, commute F, cost of living F.
- Brick Township Public School District (suburban): math 18% / reading 43% proficiency, ranked #330 of 472 in NJ (top 70%) — families likely to look elsewhere, expect single-tenant / working-renter base with shorter leases.
- Market conditions: 284 active listings in the ZIP; 3 comparable units currently listed for rent nearby; rentals at typical pace (median 25d on market — plan ~3-4 weeks tenant-placement turnaround); 4,434 units permitted in Ocean County in 2024 (868 in 5+ unit buildings).
Forward outlook
- Local home prices are declining (-3.0%/yr); year-one equity from $5k of loan paydown is wiped out by about $21k of value loss. Plan a longer hold.
- Ocean County population projected to shrink 8% by 2050 — rents likely to lag national; underwrite the cash flow, not the appreciation.
- At projected returns (-3.0% appreciation + 3.0% rent growth), your $196k cash investment doubles in ~4 years — after that, you're playing with house money.
Negotiation context
- It's been on market 27 days — a 2% lower offer ($689k) is reasonable based on typical stale-listing flexibility.
Risks & watch-outs
- Watch-outs: flood insurance adds $66/mo; built in 1957 — expect roof / HVAC / electrical / plumbing capex.
- Climate carrying-cost: severe flood risk; severe wind risk, 80% chance of damaging wind over 30y; extreme-heat days projected 7→15/yr by 2055 (HVAC capex compounding) — expect insurance premiums to compound above CPI over the hold.
Questions for the listing agent
- Built in 1957 — when were the roof, HVAC, electrical panel, plumbing, and water heater last replaced?
- What's the actual annual flood-insurance premium (NFIP or private), and is the property in a SFHA with mandatory coverage?
- Is there a deadline driving the sale (1031 exchange, divorce, estate, relocation)? That informs how much negotiation room exists.
- Schools are A-rated — typically a magnet for longer-tenancy family renters. What's the average tenant stay here, and is there a school-zone premium baked into asking?
- What's the average days-on-market for RENTAL listings here right now (not sales)? A rising rental-DOM trend means longer vacancies and softer asking-rent achievability than the comps imply.
- What's the recent tenant-quality profile in this submarket — average credit score on applications, eviction rate, late-payment / NSF rate, and stable-employment percentage? A property-management company in the area should have these aggregated.
- How much new for-sale + rental construction is in the pipeline within 1–3 miles? Heavy new supply typically softens prices + rents 12–24 months out; constrained supply supports both.
Investment metrics
- 1% rule
- 1.78% ✓
- Cap rate
- 15.04%
- Cash-on-cash
- 31.23%
- DSCR
- 2.39
- GRM
- 4.7
CMA / ARV
- ARV (on-the-fly)
- $954,000
- Comps found
- 12
Show comp detail 12 sales within ~0.75 mi
| Address | Dist | Beds/Ba | Sqft | Sold | Price | $/sf | Match |
|---|---|---|---|---|---|---|---|
| 1608 Osprey Ct | 0.23mi | 4/3.0 | 2,392 (+6%) | 1mo | $1,500,000 | $627 | 74 |
| 660 Point Ave | 0.28mi | 4/2.5 | 2,396 (+6%) | 2mo | $957,000 | $399 | 72 |
| 546 Princeton Ave | 0.54mi | 4/2.0 | 2,176 (-3%) | 1mo | $575,000 | $264 | 69 |
| 678 Princeton Ave | 0.24mi | 5/3.0 (+1) | 2,197 (-2%) | 12mo | $1,300,000 | $592 | 66 |
| 1538 Northstream Pkwy | 0.67mi | 4/2.0 | 2,268 (+1%) | 5mo | $610,000 | $269 | 63 |
| 1417 Dorsett Dock Rd | 0.64mi | 4/2.5 | 2,322 (+3%) | 0mo | $1,168,000 | $503 | 62 |
| 2341 Harbor Dr | 0.39mi | 4/2.0 | 2,066 (-8%) | 12mo | $875,000 | $424 | 58 |
| 121 Joie Pl | 0.56mi | 4/3.0 | 2,376 (+6%) | 13mo | $995,000 | $419 | 50 |
| 1514 Salem Rd | 0.73mi | 4/2.5 | 2,325 (+3%) | 12mo | $1,333,000 | $573 | 49 |
| 2305 Hollywood Rd | 0.73mi | 4/2.5 | 2,344 (+4%) | 12mo | $950,000 | $405 | 47 |
| 633 Thoroughfare Rd | 0.37mi | 3/1.5 (-1) | 1,939 (-14%) | 11mo | $603,000 | $311 | 44 |
| 772 Princeton Ave | 0.60mi | 4/3.0 | 2,570 (+14%) | 10mo | $2,300,000 | $895 | 37 |
Match score weights: distance 35% · size 25% · config 20% · recency 20%. Top-matched comps best support the ARV.
Projected returns pro-forma
-3.0% appreciation · 3.0% rent growth · sell at horizon
- IRR
- 25.6%
- Equity multiple
- 2.06×
- Total profit
- $207,327
- Equity at exit
- $104,357
- IRR
- 33.3%
- Equity multiple
- 4.03×
- Total profit
- $593,993
- Equity at exit
- $60,515
Cash invested: $195,972 (down + closing). Projections, not guarantees.
Landlord ↔ Tenant lean methodology
- Overall (STATE)
- 21 Tenant-Leaning
- State New Jersey
- 21 Tenant-Leaning · D+6
- County
- — inherits STATE
- City
- — inherits STATE
ZIP-level market 08724
- Active inventory
- 284
- Price-to-rent
- 4.7×
Monthly cashflow live
- Estimated rent
- $12,442 medium interval (Pro) →
- Mortgage (P&I)
- −$3,670
- Tax from tax record
- −$767 /mo · $9,208/yr
- Insurance
- −$292
- Flood insurance flood zone
- −$66 /mo · $798/yr
- HOA
- −$0
- Vacancy / Maint / Mgmt
- −$2,613
- Net cashflow
- $5,033
Break-even live
UW: 25.0% down · 7.5% · 30yr · 1.5% tax · 5.0% vac · 8.0% maint · 8.0% mgmt
Financing live
Cash to close
- Down payment
- $174,975
- Closing costs
- $20,997
- Reserves months
- —
- Total cash needed
- —
Loan-product check · same deal, 3 products live
Conventional
25% down · 7.5% · 30yr
- Down + closing
- —
- Monthly P&I
- —
- Monthly cashflow
- —
- DSCR
- —
- Eligible?
- —
Personal DTI + credit; lowest rate.
DSCR
20% down · 8.5% · 30yr
- Down + closing
- —
- Monthly P&I
- —
- Monthly cashflow
- —
- DSCR
- —
- Eligible?
- —
No personal income docs; deal must DSCR.
Hard money
10% down · 12.0% · 12mo
- Down + closing
- —
- Monthly P&I
- —
- Monthly cashflow
- —
- DSCR
- —
- Eligible?
- —
Short-term bridge; refi at stabilization.
Rent comps 3 comps
| Address | Beds | Baths | Sqft | Rent | $/sqft | DOM | Units | Dist |
|---|---|---|---|---|---|---|---|---|
| 1414 Treeneedle Rd Point Pleasant Boro, NJ | 3.0 | 2.0 | 1640 | $3,000 | $1.83 | 24d | 1 | 0.84mi |
| 711 Mount Pl Point Pleasant Boro, NJ | 5.0 | 3.0 | 2240 | $30,000 | $13.39 | 1d | 1 | 1.31mi |
| 203 Bridge Ave Point Pleasant Boro, NJ | 3.0 | 2.0 | 1832 | $3,100 | $1.69 | 24d | 1 | 1.48mi |
Listing history 2 events
-
2026-05-14status Pending
-
2026-04-17$699,900 Active
ⓘ Source: listings_history table (triggers on properties + properties_extension) + one-shot
backfill from property_details.listing_events for pre-trigger history.
Tax reassessment forecast NJ · Partial reset (capped growth)
- Current annual tax
- $9,208 · $767/mo
- Projected year-2 tax
- $13,318 · $1,110/mo
- Expected delta
- +$4,110/yr (+$342/mo · 44.6%)
ⓘ Screening estimate from a state-policy table — verify with the county assessor before closing.
Climate risk First Street
- Flood 8/10 Severe FEMA zone X (shaded) · 99% chance over 30 yrs
- Wildfire 2/10 Low
- Heat 8/10 Severe 7 d/yr ≥97°F today · 15 d/yr by 30 yrs out
- Wind 8/10 Severe 80% chance of damaging wind over 30 yrs
- Air quality 3/10 Moderate 3 unhealthy d/yr today · 5 by 30 yrs out
Nearby sold comps map
Loading sold comps map…
Walkable amenities ~0.75 mi
Loading nearby amenities…
Taxation est. · year 1
- Rental income
- $149,303
- − Mortgage interest
- −$39,205
- − Property taxes
- −$9,208
- − Insurance
- −$4,297
- − Repairs & maintenance
- −$11,944
- − Management
- −$11,944
- − Depreciation
- −$20,361
- Taxable income
- $52,344
- Est. tax owed @ 24.0%
- −$12,563
- After-tax cash flow
- $47,838/yr
For passive investors: Depreciation is non-cash, so a rental often shows a tax loss while cash-flowing — sheltering income. Rental losses are passive: they offset passive income freely, and up to $25,000/yr can offset ordinary (W-2) income if you actively participate and your MAGI is under $100k (phasing out to $0 by $150k); unused losses carry forward. On sale, claimed depreciation is recaptured at up to 25%, and gains may owe capital-gains tax (a 1031 exchange can defer both). Figures are a year-1 estimate at your 24.0% rate — not tax advice; consult a CPA.
Schools (NCES district)
- District
- Brick Township Public School District
- NCES district ID
- 3402220
- Math proficiency
- 18% ▼ -24.00%
- Reading proficiency
- 43% ▼ -15.00%
- Median HH income
- $68,717
- Composite
- 28.31/100
- National rank
- #6785
- State rank
- #330 of 472 in NJ
Livability — Point Pleasant
- Score
- 76/100
- State rank
- #136
- US rank
- #3574
Category grades
Schools grade is shown separately in the Schools card above.
Census & demographics
- City population
- 25,732
- Population (ZIP)
- 41,573
Population outlook (Ocean County) Hauer SSP2
- Today (2025)
- 586,991 people
- By 2030
- 581,403 · -1.0%
- By 2040
- 564,913 · -3.8%
- By 2050
- 538,149 · -8.3%
- By 2075
- 468,845 · -20.1%
- By 2100
- 350,297 · -40.3%
Race, ethnicity, and origin ACS 2023
- Neighborhood character
- Predominantly White (78%)
- Race & ethnicity
- White 78% Hispanic / Latino 11% Two or more races 7% Black 5% Asian 2%
- Hispanic origin (detail)
- Mexican 2% Puerto Rican 5%
- Common ancestry
- Romanian 8% Lithuanian 2% Slovak 1%
- Foreign-born
- 7% · Canada, Jamaica, China
- Languages at home
- 90% English-only · Spanish 5% Other Indo-European 1% Chinese 1%
Political lean MEDSL · Ocean
- 2024 margin
- Solid R (+36.0) · D 31.4% · R 67.4% · Other 1.2%
- 2008→2024 swing
- -17.6pp toward R · 2008: -18.4pp · 2024: -36.0pp
- All cycles
- 2024: R+36.0 2020: R+28.7 2016: R+34.0 2012: R+17.7 2008: R+18.4
Not yet ingested
- Civics
- —
Market trends
- HPI YoY
- ▼ -524.30%
- Current HPI
- 380.6136
- Rent YoY
- —
- Metro
- —
- State GDP YoY
- ▲ 2.05%
- F500 in state
- 34
Industry mix (Fortune 500 HQ in NJ)
| Industry | F500 HQs | Revenue |
|---|---|---|
| Consumer Goods | 3 | $31B |
|
||
| Pharmaceuticals | 2 | $153B |
|
||
| Technology | 2 | $21B |
|
||
| Insurance | 2 | $20B |
|
||
| Healthcare | 2 | $19B |
|
||
| Financial Services | 1 | $70B |
|
||
Price history
2 events — show timeline
- 2026-05-14 Pending — MOMLS
- 2026-04-17 Listed $699,900 MOMLS
Property tax history
+2.5%/yrLatest (2025): $9,208 · +5.1% YoY. Source: county tax records.
Cash-flow waterfall
monthlySold comps — $/sqft
last 12 mo · ≤1 miLoading sold comps…