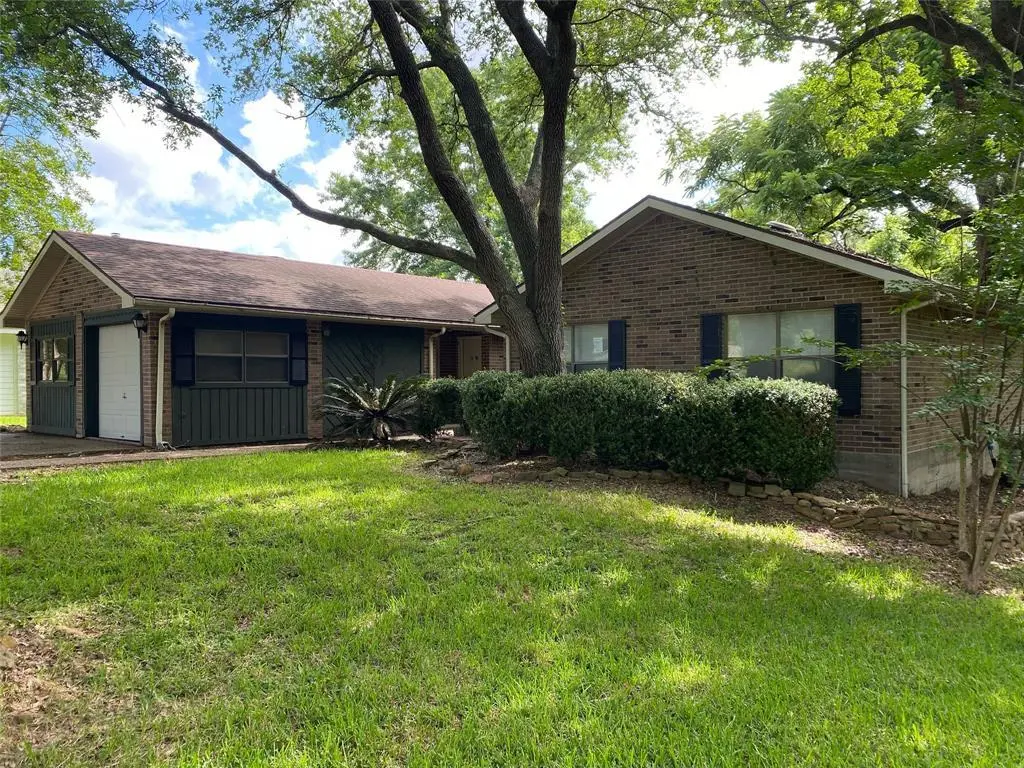
461 Imperial Cir · Cape Royale, TX
Flood risk 1/10 · Minimal
- FEMA flood zone
- X (unshaded)
- Chance of flooding over 30 yrs
- 0.0%
- Est. flood insurance / yr
- $507 – $1,088
Fire risk 1/10 · Minimal
- Est. fire insurance / yr
- $1,222 – $2,270
Heat risk 8/10 · Major
- Hot days now (above 111°F)
- 7 days/yr
- Hot days in 30 yrs
- 24 days/yr
Wind risk 9/10 · Severe
- Chance of severe wind over 30 yrs
- 99.0%
Air-quality risk 1/10 · Minimal
- Unhealthy air days now
- 0 days/yr
- Unhealthy air days in 30 yrs
- 0 days/yr
Risk factors via First Street. Map © Google.
Why this score? — see what drove the D- grade
The composite is a weighted blend of 9 inputs, each scored 0–100. Each bar is that input's sub-score; the figure is the points it added to the 100-point composite (weight × sub-score).
- ARV discount +15.0/15.0
- Cash flow +8.7/30.0
- 1% rule +3.9/10.0
- Livability +2.9/5.0
- Rent growth +2.5/5.0
- Condition / age +2.5/5.0
- DSCR +2.4/10.0
- Schools +2.0/10.0
- Appreciation +0.0/10.0
$169,000
🖨 Deal sheet (PDF) 📄 Offer letter ✓ Due diligence
Listing remarks
Welcome to your new oasis! Come join the wonderfully kept and safe Cape Royale neighborhood and have direct access to the beach on Lake Livingston! With this much potential, there is no way you can pass this up! Enjoy the community amenities such as the Exercise fitness room, tennis court, basketball courts. Walk the beautiful neighborhood and stay active! Relax on the large back porch and enjoy the view. The house has all the space you need with a garage to keep your yard in tip top shape! If you are searching for a lake house, this is a MUST SEE!
Key facts
- Tennis court
- Community amenities
- Large back porch
Tags
Property features AI
Finance
- Other: Property type: Residential; Property sub type: Single Family Residence; Parcel number available
- Financial info: Listing terms: Cash or Conventional; Special listing condition: Real Estate Owned
- HOA & community: Mandatory association; Annual association fee $500; Association covers grounds maintenance and management fees; HOA: Cape Royale Property Owners Association; Community amenities include clubhouse, fitness center, gated/guarded entrance, lake, park, and tennis courts
Exterior
- Parking: 2 covered parking spaces; 2-car attached garage
- Utilities: Co-op water; Electricity connected; MUD water; MUD sewer; Located in a municipal utility district
- Home design: Single family residence; Attached property; One story; Built in 1988
- Construction: Year built 1988
- Exterior features: Waterfront lot; Less than 0.5 acre lot; Subdivision: Cape Royale Imperial Point; Directions available
Interior
- Kitchen: Electric range; Eat-in kitchen with pantry
- Bedrooms: 3 bedrooms (primary bedroom on level 1)
- Bathrooms: 2 full bathrooms
- Heating & cooling: Central heating; Central air; Ceiling fan(s)
- Interior features: Eat-in kitchen; Pantry; Walk-in closet(s); One living area; One dining area; Room count: 2
- Laundry & utility: Utility room; Full-size washer/dryer area
Neighborhood map
What this means for you Summary
Snapshot
- This is a 3-bed/2.0-bath single-family listed at $169k.
Deal economics
- At list price, monthly cash flow is $-143 ($-2k/yr) — negative.
- To cash-flow at today's rent, offer at most $144k (15.0% below list).
- To meet the 1% rule (rent ≥ 1% of price), the offer needs to be $150k (11.2% below list).
- Recommended offer: $144k (15.0% below list) — sets the bar for cash-flow.
- Cap rate 5.3% vs local median 2.5% in Cape Royale — top-decile yield for the area; either an underpriced asset or a hidden risk that comps aren't pricing in. Stress-test before assuming the spread holds.
Location & tenants
- Location reads 58/100 on livability (#1,203 in TX) — a working-class tenant base; expect higher turnover. Strengths: crime A, housing A, cost of living B+; Watch: amenities F, commute F, employment D-.
- Coldspring-Oakhurst CISD (rural): math 18% / reading 28% proficiency, ranked #732 of 826 in TX (top 89%) — low school quality limits family demand, transient renter base, plan for 1-2y turnover; 60% free/reduced lunch — lower-income household profile, screen leases tightly.
- Zoned schools: Street El (449 students, 70% FRL); Lincoln J H (math 14% / reading 28%, grade F, #1,387 of 1,662 statewide, top 85%, 347 students, 58% FRL); Coldspring-Oakhurst H S (math 27% / reading 37%, grade F, #1,044 of 1,632 statewide, top 66%, 496 students, 55% FRL) — zoned schools at 61% FRL track the district average.
- Market conditions: 364 active listings in the ZIP; 1 comparable units currently listed for rent nearby; 575 units permitted in San Jacinto County in 2024 (0 in 5+ unit buildings).
Forward outlook
- Local home prices are declining (-3.0%/yr); year-one equity from $1k of loan paydown is wiped out by about $5k of value loss. Plan a longer hold.
- San Jacinto County population projected at +7% by 2050 — modest demand growth; plan on rents tracking national, not racing it.
Negotiation context
- Only 6 days on market — expect competitive offers; lowballing is unlikely to land.
Risks & watch-outs
- Climate carrying-cost: severe wind risk, 99% chance of damaging wind over 30y; extreme-heat days projected 7→24/yr by 2055 (HVAC capex compounding) — expect insurance premiums to compound above CPI over the hold.
Questions for the listing agent
- What do current leases actually rent for vs. the listed asking? Can we see a recent rent roll and the last 12 months of T-12 income?
- What does the HOA fee cover, when was the last increase, and are there any pending special assessments or reserve-fund shortfalls?
- Is there a deadline driving the sale (1031 exchange, divorce, estate, relocation)? That informs how much negotiation room exists.
- The area grade is low — what's the realistic commute time and amenity access for the typical tenant pool here? Any planned neighborhood developments (good or bad) we should know about?
- What's the average days-on-market for RENTAL listings here right now (not sales)? A rising rental-DOM trend means longer vacancies and softer asking-rent achievability than the comps imply.
- What's the recent tenant-quality profile in this submarket — average credit score on applications, eviction rate, late-payment / NSF rate, and stable-employment percentage? A property-management company in the area should have these aggregated.
- How much new for-sale + rental construction is in the pipeline within 1–3 miles? Heavy new supply typically softens prices + rents 12–24 months out; constrained supply supports both.
Investment metrics
- 1% rule
- 0.89% ✗
- Cap rate
- 5.27%
- Cash-on-cash
- -3.64%
- DSCR
- 0.84
- GRM
- 9.4
CMA / ARV
- ARV (on-the-fly)
- $284,760
- Comps found
- 9
Show comp detail 9 sales within ~0.75 mi
| Address | Dist | Beds/Ba | Sqft | Sold | Price | $/sf | Match |
|---|---|---|---|---|---|---|---|
| 30 N Pine Harbour Dr | 0.41mi | 3/2.0 | 1,379 (+2%) | 9mo | $289,989 | $210 | 70 |
| 330 S Pine Harbour Dr | 0.37mi | 3/2.0 | 1,260 (-7%) | 2mo | $254,900 | $202 | 70 |
| 116 Harbour Ln | 0.41mi | 3/1.5 | 1,286 (-5%) | 2mo | $155,000 | $121 | 69 |
| 410 N Pine Harbour Dr | 0.34mi | 3/2.0 | 1,266 (-7%) | 18mo | $240,000 | $190 | 58 |
| 81 Harbour Point Cir | 0.48mi | 2/2.0 (-1) | 1,464 (+8%) | 3mo | $599,000 | $409 | 57 |
| 150 Piping Rock Pl | 0.55mi | 3/2.0 | 1,322 (-2%) | 23mo | $288,000 | $218 | 51 |
| 531 N Forest Cove Loop | 0.55mi | 3/2.0 | 1,176 (-13%) | 6mo | $410,000 | $349 | 47 |
| 40 Pecan Cv | 0.72mi | 2/2.0 (-1) | 1,431 (+6%) | 9mo | $169,000 | $118 | 45 |
| 411 N Forest Cove Loop | 0.65mi | 3/2.0 | 1,250 (-8%) | 21mo | $450,000 | $360 | 39 |
Match score weights: distance 35% · size 25% · config 20% · recency 20%. Top-matched comps best support the ARV.
Projected returns pro-forma
-3.0% appreciation · 3.0% rent growth · sell at horizon
- IRR
- -22.3%
- Equity multiple
- 0.23×
- Total profit
- $-36,397
- Equity at exit
- $25,198
- IRR
- -16.2%
- Equity multiple
- 0.09×
- Total profit
- $-42,961
- Equity at exit
- $14,612
Cash invested: $47,320 (down + closing). Projections, not guarantees.
Landlord ↔ Tenant lean methodology
- Overall (STATE)
- 87 Strongly Landlord-Friendly
- State Texas
- 87 Strongly Landlord-Friendly · R+5
- County
- — inherits STATE
- City
- — inherits STATE
ZIP-level market 77331
- Active inventory
- 364
- Price-to-rent
- 9.4×
Monthly cashflow live
- Estimated rent
- $1,500 medium interval (Pro) →
- Mortgage (P&I)
- −$886
- Tax from tax record
- −$330 /mo · $3,957/yr
- Insurance
- −$70
- HOA
- −$42
- Vacancy / Maint / Mgmt
- −$315
- Net cashflow
- $-143
Break-even live
Sensitivity live
| Price | -10% $-48 | -5% $-96 | +0% $-143 | +5% $-191 | +10% $-239 |
|---|---|---|---|---|---|
| Rent | -10% $-262 | -5% $-203 | +0% $-143 | +5% $-84 | +10% $-25 |
| Rate | -1.0pp $-58 | -0.5pp $-100 | base $-143 | +0.5pp $-187 | +1.0pp $-232 |
UW: 25.0% down · 7.5% · 30yr · 1.5% tax · 5.0% vac · 8.0% maint · 8.0% mgmt
Financing live
Cash to close
- Down payment
- $42,250
- Closing costs
- $5,070
- Reserves months
- —
- Total cash needed
- —
Loan-product check · same deal, 3 products live
Conventional
25% down · 7.5% · 30yr
- Down + closing
- —
- Monthly P&I
- —
- Monthly cashflow
- —
- DSCR
- —
- Eligible?
- —
Personal DTI + credit; lowest rate.
DSCR
20% down · 8.5% · 30yr
- Down + closing
- —
- Monthly P&I
- —
- Monthly cashflow
- —
- DSCR
- —
- Eligible?
- —
No personal income docs; deal must DSCR.
Hard money
10% down · 12.0% · 12mo
- Down + closing
- —
- Monthly P&I
- —
- Monthly cashflow
- —
- DSCR
- —
- Eligible?
- —
Short-term bridge; refi at stabilization.
Rent comps 1 comps
| Address | Beds | Baths | Sqft | Rent | $/sqft | DOM | Units | Dist |
|---|---|---|---|---|---|---|---|---|
| 30 Harbour Ln Coldspring, TX | 3.0 | 2.0 | 1280 | $1,500 | $1.17 | 1d | 1 | 0.44mi |
HOA detail
- Monthly dues
- $42 · $504/yr
Listing history 7 events
-
2026-06-18status $169,000 Pending 6 DOM
-
2026-06-18days on market $169,000 Active 6 DOM
-
2026-06-17days on market $169,000 Active 5 DOM
-
2026-06-16days on market $169,000 Active 4 DOM
-
2026-06-15days on market $169,000 Active 3 DOM
-
2026-06-13remarks 559-char remark
-
2026-06-13$169,000 Active 1 DOM
ⓘ Source: listings_history table (triggers on properties + properties_extension) + one-shot
backfill from property_details.listing_events for pre-trigger history.
Tax reassessment forecast TX · Resets to sale price
- Current annual tax
- $3,957 · $330/mo
- Projected year-2 tax
- $3,957 · $330/mo
- Expected delta
- $0/yr ($0/mo · 0.0%)
ⓘ Screening estimate from a state-policy table — verify with the county assessor before closing.
Climate risk First Street
- Flood 1/10 Low FEMA zone X (unshaded) · 0% chance over 30 yrs
- Wildfire 1/10 Low
- Heat 8/10 Severe 7 d/yr ≥111°F today · 24 d/yr by 30 yrs out
- Wind 9/10 Extreme 99% chance of damaging wind over 30 yrs
- Air quality 1/10 Low 0 unhealthy d/yr today · 0 by 30 yrs out
Nearby sold comps map
Loading sold comps map…
Walkable amenities ~0.75 mi
Loading nearby amenities…
Taxation est. · year 1
- Rental income
- $18,000
- − Mortgage interest
- −$9,467
- − Property taxes
- −$3,957
- − Insurance
- −$845
- − Repairs & maintenance
- −$1,440
- − Management
- −$1,440
- − HOA
- −$504
- − Depreciation
- −$4,916
- Taxable loss
- −$4,569
- Est. tax savings @ 24.0%
- +$1,096
- After-tax cash flow
- $-624/yr
For passive investors: Depreciation is non-cash, so a rental often shows a tax loss while cash-flowing — sheltering income. Rental losses are passive: they offset passive income freely, and up to $25,000/yr can offset ordinary (W-2) income if you actively participate and your MAGI is under $100k (phasing out to $0 by $150k); unused losses carry forward. On sale, claimed depreciation is recaptured at up to 25%, and gains may owe capital-gains tax (a 1031 exchange can defer both). Figures are a year-1 estimate at your 24.0% rate — not tax advice; consult a CPA.
Schools (NCES district)
- District
- Coldspring-Oakhurst CISD
- NCES district ID
- 4814520
- Math proficiency
- 18% ▼ -9.00%
- Reading proficiency
- 28% ▼ -2.00%
- Median HH income
- $46,916
- Composite
- 20.07/100
- National rank
- #8653
- State rank
- #732 of 826 in TX
Livability — Cape Royale
- Score
- 58/100
- State rank
- #1203
- US rank
- #21032
Category grades
Schools grade is shown separately in the Schools card above.
Census & demographics
- Census place
- Cape Royale, TX
- Population (ZIP)
- 7,348
Population outlook (San Jacinto County) Hauer SSP2
- Today (2025)
- 29,069 people
- By 2030
- 29,750 · +2.3%
- By 2040
- 30,714 · +5.7%
- By 2050
- 31,010 · +6.7%
- By 2075
- 31,616 · +8.8%
- By 2100
- 29,874 · +2.8%
Race, ethnicity, and origin ACS 2023
- Neighborhood character
- Predominantly White (78%)
- Race & ethnicity
- White 78% Black 13% Two or more races 8% Hispanic / Latino 4%
- Common ancestry
- Slovak 3% Italian 2% Romanian 2%
- Foreign-born
- 3% · Canada
- Languages at home
- 94% English-only · Spanish 5% Arabic 1%
Political lean MEDSL · San Jacinto
- 2024 margin
- Solid R (+65.3) · D 17.0% · R 82.3%
- 2008→2024 swing
- -27.0pp toward R · 2008: -38.3pp · 2024: -65.3pp
- All cycles
- 2024: R+65.3 2020: R+61.9 2016: R+58.4 2012: R+48.9 2008: R+38.3
Not yet ingested
- Civics
- —
Market trends
- HPI YoY
- ▼ -146.98%
- Current HPI
- 199.0493
- Rent YoY
- —
- Metro
- —
- State GDP YoY
- ▲ 3.95%
- F500 in state
- 110
Industry mix (Fortune 500 HQ in TX)
| Industry | F500 HQs | Revenue |
|---|---|---|
| Energy | 16 | $1,198B |
|
||
| Technology | 5 | $198B |
|
||
| Engineering / Construction | 4 | $72B |
|
||
| Energy Services | 3 | $60B |
|
||
| Utilities | 3 | $41B |
|
||
| Healthcare | 2 | $330B |
|
||
Price history
2 events — show timeline
- 2026-06-12 Listed $169,000 NTREIS
- 1993-07-29 Sold (Public Records) — Public Records
Property tax history
+5.5%/yrLatest (2025): $3,957 · +2.9% YoY. Source: county tax records.
Cash-flow waterfall
monthlySold comps — $/sqft
last 12 mo · ≤1 miLoading sold comps…