57 Oak St · River Rouge, MI
Flood risk 5/10 · Moderate
- FEMA flood zone
- X (unshaded)
- Chance of flooding over 30 yrs
- 0.6%
- Est. flood insurance / yr
- $473 – $860
Fire risk 1/10 · Minimal
- Est. fire insurance / yr
- $784 – $1,456
Heat risk 3/10 · Minor
- Hot days now (above 95°F)
- 7 days/yr
- Hot days in 30 yrs
- 15 days/yr
Wind risk 2/10 · Minimal
- Chance of severe wind over 30 yrs
- —
Air-quality risk 4/10 · Minor
- Unhealthy air days now
- 6 days/yr
- Unhealthy air days in 30 yrs
- 8 days/yr
Risk factors via First Street. Map © Google.
Why this score? — see what drove the C+ grade
The composite is a weighted blend of 9 inputs, each scored 0–100. Each bar is that input's sub-score; the figure is the points it added to the 100-point composite (weight × sub-score).
- Cash flow +25.4/30.0
- Appreciation +10.0/10.0
- DSCR +8.4/10.0
- 1% rule +7.1/10.0
- ARV discount +4.3/15.0
- Livability +3.2/5.0
- Rent growth +2.5/5.0
- Condition / age +2.5/5.0
- Schools +0.5/10.0
$75,000
🖨 Deal sheet 📄 Offer letter ✓ Due diligence
Listing remarks MLS
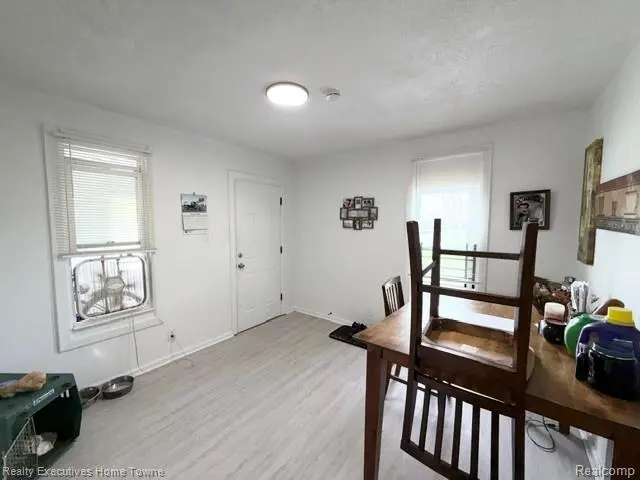
2 bedroom, 1 bathroom frame home with an enclosed porch. Located off W Jefferson Ave on a quiet street. Property is in good condition and currently rented to stable tenant that pays on time. Tenant pays $1,150 per month. Contract ends December 2026. Room in basement can be used as a 3rd bedroom. Please schedule showings in advance to give tenant time.
Key facts
- 3,049 sq ft lot
- Built 1900
- Listed 34 days
Property features AI
Finance
- Other: Listing broker: Realty Executives Home Towne
Exterior
- Parking: No garage
- Utilities: Public water; Sewer available
- Home design: Single-family residence; One level with ground-level entry and steps
- Construction: Aluminum siding; Block foundation
- Exterior features: Paved road access; Lot roughly 31 x 100 (0.07 acres)
Interior
- Bathrooms: 1 full bathroom
- Heating & cooling: Forced air heating (natural gas); No cooling
- Interior features: Unfinished basement; Total of 5 rooms
Neighborhood map
What this means for you Summary
Snapshot
- This is a 2-bed/1.0-bath single-family listed at $75k.
Deal economics
- At list price, monthly cash flow is $174 ($2k/yr) — positive.
- The deal already cash-flows at list — no discount required.
- Meets the 1% rule at list price ($907 rent vs $75k).
- Recommended offer: $73k (3.0% below list) — sets the bar for market timing.
Location & tenants
- Location reads 65/100 on livability (#454 in MI) — a middle-class / working-renter tenant base. Strengths: commute A+, cost of living A+, housing B+; Watch: health & safety D, schools F, crime F.
- River Rouge School District (suburban): math 3% / reading 12% proficiency, ranked #535 of 540 in MI (top 99%) — low school quality limits family demand, transient renter base, plan for 1-2y turnover; 89% free/reduced lunch — lower-income household profile, screen leases tightly.
- Market conditions: 58 active listings in the ZIP; 6 comparable units currently listed for rent nearby; rentals at typical pace (median 24d on market — plan ~3-4 weeks tenant-placement turnaround); 2,639 units permitted in Wayne County in 2024 (1,216 in 5+ unit buildings).
Forward outlook
- In year one you build about $8k of equity ($519 loan paydown + $8k appreciation (10.0% local appreciation)).
- Wayne County population projected at -17% by 2050 — secular population decline; favor cash flow + early exit over multi-decade hold.
- At projected returns (10.0% appreciation + 3.0% rent growth), your $21k cash investment doubles in ~2 years — after that, you're playing with house money.
- By year 5, paydown + projected appreciation supports a ~$37k cash-out refi (75% LTV) — recoverable capital for the next deal without selling this one.
Negotiation context
- It's been on market 34 days — a 3% lower offer ($73k) is reasonable based on typical stale-listing flexibility.
- 12 sale attempts since 25y ago with the ask held roughly flat each time — persistent listings suggest the price (not the market) is what's stuck; bring a comps-based counter.
- Current owner paid $600; list at $75k implies a 12400% gain — meaningful room to come down on a strong offer.
Risks & watch-outs
- Watch-outs: built in 1900 — expect roof / HVAC / electrical / plumbing capex.
- Climate carrying-cost: moderate flood risk — expect insurance premiums to compound above CPI over the hold.
Questions for the listing agent
- It's been on market 34 days. Have you received any prior offers? Is the seller open to a 3% concession, seller financing, or rate buy-down credit?
- Built in 1900 — when were the roof, HVAC, electrical panel, plumbing, and water heater last replaced?
- Is there a deadline driving the sale (1031 exchange, divorce, estate, relocation)? That informs how much negotiation room exists.
- Schools are F-rated, which usually means shorter tenancies and higher turnover. Who's the typical renter profile here, and what's been the actual vacancy rate?
- Crime grade is F in this area — have there been break-ins, vandalism, or insurance claims at this property in the last 3 years? What carrier currently insures it and at what premium?
- What's the average days-on-market for RENTAL listings here right now (not sales)? A rising rental-DOM trend means longer vacancies and softer asking-rent achievability than the comps imply.
- What's the recent tenant-quality profile in this submarket — average credit score on applications, eviction rate, late-payment / NSF rate, and stable-employment percentage? A property-management company in the area should have these aggregated.
- How much new for-sale + rental construction is in the pipeline within 1–3 miles? Heavy new supply typically softens prices + rents 12–24 months out; constrained supply supports both.
Investment metrics
- 1% rule
- 1.21% ✓
- Cap rate
- 9.07%
- Cash-on-cash
- 9.92%
- DSCR
- 1.44
- GRM
- 6.9
CMA / ARV
- ARV (on-the-fly)
- $70,035
- Comps found
- 12
Show comp detail 12 sales within ~0.75 mi
| Address | Dist | Beds/Ba | Sqft | Sold | Price | $/sf | Match |
|---|---|---|---|---|---|---|---|
| 107 Pine St | 0.16mi | 2/1.0 | 800 (-1%) | 9mo | $73,000 | $91 | 84 |
| 150 Division St | 0.37mi | 2/1.0 | 792 (-2%) | 9mo | $59,800 | $76 | 73 |
| 109 Pine St | 0.16mi | 3/1.5 (+1) | 736 (-9%) | 1mo | $95,000 | $129 | 71 |
| 48 E James St | 0.30mi | 3/1.0 (+1) | 784 (-3%) | 10mo | $90,000 | $115 | 68 |
| 42 E Henry St | 0.14mi | 3/1.0 (+1) | 916 (+14%) | 0mo | $115,000 | $126 | 65 |
| 50 Abbott St | 0.50mi | 2/1.0 | 831 (+3%) | 8mo | $72,000 | $87 | 65 |
| 46 E James St | 0.30mi | 2/1.0 | 720 (-11%) | 14mo | $21,000 | $29 | 56 |
| 151 Dwight St | 0.42mi | 2/1.0 | 738 (-8%) | 14mo | $40,000 | $54 | 55 |
| 241 Goodell St | 0.36mi | 1/1.0 (-1) | 724 (-10%) | 13mo | $20,000 | $28 | 51 |
| 319 Polk Ave | 0.52mi | 2/1.0 | 912 (+13%) | 6mo | $38,500 | $42 | 48 |
| 268 Beechwood St | 0.53mi | 3/1.0 (+1) | 900 (+12%) | 16mo | $38,000 | $42 | 38 |
| 1320 S Bassett St | 0.68mi | 3/1.0 (+1) | 900 (+12%) | 8mo | $82,000 | $91 | 37 |
Match score weights: distance 35% · size 25% · config 20% · recency 20%. Top-matched comps best support the ARV.
Projected returns pro-forma
10.0% appreciation · 3.0% rent growth · sell at horizon
- IRR
- 31.5%
- Equity multiple
- 3.47×
- Total profit
- $51,936
- Equity at exit
- $67,566
- IRR
- 27.3%
- Equity multiple
- 7.87×
- Total profit
- $144,302
- Equity at exit
- $145,709
Cash invested: $21,000 (down + closing). Projections, not guarantees.
Landlord ↔ Tenant lean methodology
- Overall (STATE)
- 62 Landlord-Friendly
- State Michigan
- 62 Landlord-Friendly · EVEN
- County
- — inherits STATE
- City
- — inherits STATE
ZIP-level market 48218
- Home prices YoY
- 28.4%
- Active inventory
- 58
- Price-to-rent
- 6.9×
Monthly cashflow live
- Estimated rent
- $907 high interval (Pro) →
- Mortgage (P&I)
- −$393
- Tax from tax record
- −$119 /mo · $1,424/yr
- Insurance
- −$31
- HOA
- −$0
- Vacancy / Maint / Mgmt
- −$191
- Net cashflow
- $174
Break-even live
UW: 25.0% down · 7.5% · 30yr · 1.5% tax · 5.0% vac · 8.0% maint · 8.0% mgmt
Financing live
Cash to close
- Down payment
- $18,750
- Closing costs
- $2,250
- Reserves months
- —
- Total cash needed
- —
Loan-product check · same deal, 3 products live
Conventional
25% down · 7.5% · 30yr
- Down + closing
- —
- Monthly P&I
- —
- Monthly cashflow
- —
- DSCR
- —
- Eligible?
- —
Personal DTI + credit; lowest rate.
DSCR
20% down · 8.5% · 30yr
- Down + closing
- —
- Monthly P&I
- —
- Monthly cashflow
- —
- DSCR
- —
- Eligible?
- —
No personal income docs; deal must DSCR.
Hard money
10% down · 12.0% · 12mo
- Down + closing
- —
- Monthly P&I
- —
- Monthly cashflow
- —
- DSCR
- —
- Eligible?
- —
Short-term bridge; refi at stabilization.
Rent comps 6 comps
| Address | Beds | Baths | Sqft | Rent | $/sqft | DOM | Units | Dist |
|---|---|---|---|---|---|---|---|---|
| 97 Batavia St Unit 1 River Rouge, MI | 2.0 | 1.0 | 900 | $825 | $0.92 | 24d | 1 | 0.15mi |
| 17 W James St Unit 17 W James Lower River Rouge, MI | 2.0 | 1.0 | 900 | $950 | $1.06 | 14d | 1 | 0.40mi |
| 88 Hill St Unit 2 River Rouge, MI | 1.0 | 1.0 | 700 | $800 | $1.14 | 24d | 1 | 0.63mi |
| 1139 S Bassett St Detroit, MI | 3.0 | 1.0 | 927 | $1,120 | $1.21 | 43d | 1 | 0.71mi |
| 1139 S Bassett St Detroit, MI | 3.0 | 1.0 | 927 | $1,050 | $1.13 | 24d | 1 | 0.71mi |
| 3748 15th St Ecorse, MI | 2.0 | 1.0 | 528 | $1,099 | $2.08 | 16d | 1 | 1.12mi |
Listing history 39 events
-
2026-06-18days on market $75,000 Active 34 DOM
-
2026-06-17days on market $75,000 Active 33 DOM
-
2026-06-16days on market $75,000 Active 32 DOM
-
2026-06-15days on market $75,000 Active 31 DOM
-
2026-06-13days on market $75,000 Active 29 DOM
-
2026-06-09days on market $75,000 Active 25 DOM
-
2026-06-08days on market $75,000 Active 24 DOM
-
2026-06-07days on market $75,000 Active 23 DOM
-
2026-06-04days on market $75,000 Active 20 DOM
-
2026-06-03days on market $75,000 Active 19 DOM
-
2026-06-02days on market $75,000 Active 18 DOM
-
2026-06-01days on market $75,000 Active 17 DOM
-
2026-05-31days on market $75,000 Active 16 DOM
-
2026-05-15$75,000 Active 353-char remark
Show marketing remark (353 chars)
2 bedroom, 1 bathroom frame home with an enclosed porch. Located off W Jefferson Ave on a quiet street. Property is in good condition and currently rented to stable tenant that pays on time. Tenant pays $1,150 per month. Contract ends December 2026. Room in basement can be used as a 3rd bedroom. Please schedule showings in advance to give tenant time.
-
2026-05-15$75,000 Active
Show marketing remark (353 chars)
2 bedroom, 1 bathroom frame home with an enclosed porch. Located off W Jefferson Ave on a quiet street. Property is in good condition and currently rented to stable tenant that pays on time. Tenant pays $1,150 per month. Contract ends December 2026. Room in basement can be used as a 3rd bedroom. Please schedule showings in advance to give tenant time.
-
2025-11-21historical $1,150
-
2025-05-01$1,150
-
2018-11-11historical
-
2018-11-10historical
-
2018-10-30$7,000 Active
-
2018-10-30$7,000 Active
-
2013-02-26historical
-
2013-02-26historical
-
2013-01-14$4,000
-
2013-01-14$4,000
-
2012-12-17soldstatus $600
-
2012-12-17soldstatus $600
-
2012-12-17soldstatus $600
-
2012-11-20historical
-
2012-11-20historical
-
2012-10-01$990
-
2012-08-30$990
-
2012-08-30$990
-
2001-06-13soldstatus $11,000
-
2001-05-03soldstatus $20,000
-
2001-05-03soldstatus $20,000
-
2001-01-16$22,000
-
2001-01-16$22,000
-
1997-12-01soldstatus $15,000
ⓘ Source: listings_history table (triggers on properties + properties_extension) + one-shot
backfill from property_details.listing_events for pre-trigger history.
Tax reassessment forecast MI · Partial reset (capped growth)
- Current annual tax
- $1,424 · $119/mo
- Projected year-2 tax
- $1,424 · $119/mo
- Expected delta
- $0/yr ($0/mo · 0.0%)
ⓘ Screening estimate from a state-policy table — verify with the county assessor before closing.
Climate risk First Street
- Flood 5/10 Major FEMA zone X (unshaded) · 60% chance over 30 yrs
- Wildfire 1/10 Low
- Heat 3/10 Moderate 7 d/yr ≥95°F today · 15 d/yr by 30 yrs out
- Wind 2/10 Low
- Air quality 4/10 Moderate 6 unhealthy d/yr today · 8 by 30 yrs out
Nearby sold comps map
Loading sold comps map…
Walkable amenities ~0.75 mi
Loading nearby amenities…
Taxation est. · year 1
- Rental income
- $10,889
- − Mortgage interest
- −$4,201
- − Property taxes
- −$1,424
- − Insurance
- −$375
- − Repairs & maintenance
- −$871
- − Management
- −$871
- − Depreciation
- −$2,182
- Taxable income
- $965
- Est. tax owed @ 24.0%
- −$232
- After-tax cash flow
- $1,852/yr
For passive investors: Depreciation is non-cash, so a rental often shows a tax loss while cash-flowing — sheltering income. Rental losses are passive: they offset passive income freely, and up to $25,000/yr can offset ordinary (W-2) income if you actively participate and your MAGI is under $100k (phasing out to $0 by $150k); unused losses carry forward. On sale, claimed depreciation is recaptured at up to 25%, and gains may owe capital-gains tax (a 1031 exchange can defer both). Figures are a year-1 estimate at your 24.0% rate — not tax advice; consult a CPA.
Schools (NCES district)
- District
- River Rouge School District
- NCES district ID
- 2629760
- Math proficiency
- 3% ▼ -7.00%
- Reading proficiency
- 12% ▼ -4.00%
- Median HH income
- $26,664
- Composite
- 5.29/100
- National rank
- #10033
- State rank
- #535 of 540 in MI
Livability — River Rouge
- Score
- 65/100
- State rank
- #454
- US rank
- #12700
Category grades
Schools grade is shown separately in the Schools card above.
Census & demographics
- Census place
- River Rouge, MI
- City population
- 7,096
- Population (ZIP)
- 7,096
Population outlook (Wayne County) Hauer SSP2
- Today (2025)
- 1,675,273 people
- By 2030
- 1,620,300 · -3.3%
- By 2040
- 1,502,341 · -10.3%
- By 2050
- 1,384,039 · -17.4%
- By 2075
- 1,124,592 · -32.9%
- By 2100
- 881,193 · -47.4%
Race, ethnicity, and origin ACS 2023
- Neighborhood character
- Diverse neighborhood (Simpson 0.66)
- Race & ethnicity
- Black 45% White 34% Two or more races 16% Hispanic / Latino 16%
- Hispanic origin (detail)
- Mexican 9% Puerto Rican 5%
- Common ancestry
- Romanian 4% Lithuanian 2% Italian 1%
- Foreign-born
- 6% · Canada
- Languages at home
- 86% English-only · Spanish 11% Arabic 2% Other Indo-European 1%
Political lean MEDSL · Wayne
- 2024 margin
- Strong D (+29.0) · D 62.7% · R 33.7% · Other 3.6%
- 2008→2024 swing
- -20.5pp toward R · 2008: 49.5pp · 2024: 29.0pp
- All cycles
- 2024: D+29.0 2020: D+38.1 2016: D+37.3 2012: D+46.9 2008: D+49.5
Not yet ingested
- Civics
- —
Market trends
- HPI YoY
- ▲ 77.93%
- Current HPI
- 352.3551
- Rent YoY
- —
- Metro
- —
- State GDP YoY
- ▲ 1.37%
- F500 in state
- 28
Industry mix (Fortune 500 HQ in MI)
| Industry | F500 HQs | Revenue |
|---|---|---|
| Automotive Parts | 3 | $48B |
|
||
| Automotive | 2 | $372B |
|
||
| Chemicals | 1 | $45B |
|
||
| Automotive Retail | 1 | $29B |
|
||
| Healthcare / Medical Devices | 1 | $23B |
|
||
| Automotive Technology | 1 | $20B |
|
||
Price history
+400.0% since first listed26 events — show timeline
- 2026-05-15 Listed $75,000 REALCOMP
- 2026-05-15 Listed $75,000 MiRealSource-MiMLS
- 2025-11-21 Rental Removed $1,150 Hemlane
- 2025-05-01 Listed for Rent $1,150 Hemlane
- 2018-11-11 Listing Removed — REALCOMP
- 2018-11-10 Listing Removed — MiRealSource-MiMLS
- 2018-10-30 Listed $7,000 MiRealSource-MiMLS
- 2018-10-30 Listed $7,000 REALCOMP
- 2013-02-26 Listing Removed — MiRealSource-MiMLS
- 2013-02-26 Listing Removed — REALCOMP
- 2013-01-14 Listed $4,000 MiRealSource-MiMLS
- 2013-01-14 Listed $4,000 REALCOMP
- 2012-12-17 Sold (MLS) $600 MiRealSource-MiMLS
- 2012-12-17 Sold (MLS) $600 REALCOMP
- 2012-12-17 Sold (MLS) $600 MiRealSource-MiMLS
- 2012-11-20 Listing Removed — MiRealSource-MiMLS
- 2012-11-20 Listing Removed — MiRealSource-MiMLS
- 2012-10-01 Listed $990 MiRealSource-MiMLS
- 2012-08-30 Listed $990 REALCOMP
- 2012-08-30 Listed $990 MiRealSource-MiMLS
- 2001-06-13 Sold (Public Records) $11,000 Public Records
- 2001-05-03 Sold (MLS) $20,000 REALCOMP
- 2001-05-03 Sold (MLS) $20,000 MiRealSource-MiMLS
- 2001-01-16 Listed $22,000 REALCOMP
- 2001-01-16 Listed $22,000 MiRealSource-MiMLS
- 1997-12-01 Sold (Public Records) $15,000 Public Records
Property tax history
-4.0%/yrLatest (2025): $1,424 · -35.2% YoY. Source: county tax records.
Cash-flow waterfall
monthlySold comps — $/sqft
last 12 mo · ≤1 miLoading sold comps…