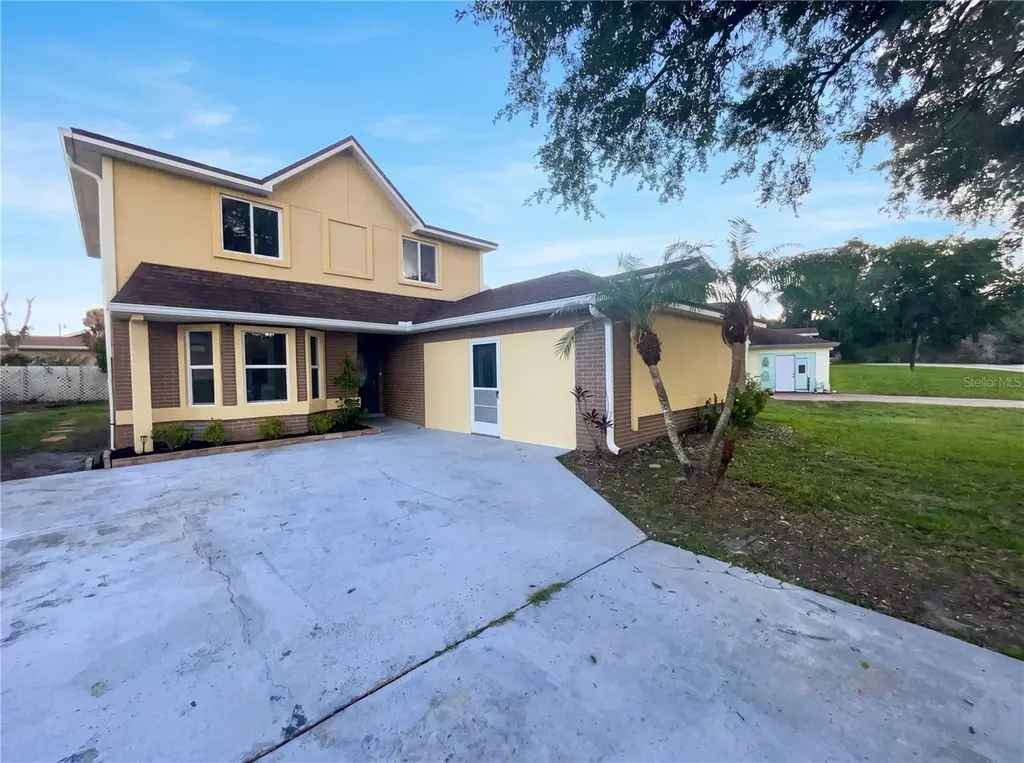
147 Coralwood Cir · Buenaventura Lakes, FL
Flood risk 6/10 · Moderate
- FEMA flood zone
- X (unshaded)
- Chance of flooding over 30 yrs
- 0.69%
- Est. flood insurance / yr
- $507 – $1,088
Fire risk 4/10 · Minor
- Est. fire insurance / yr
- $947 – $1,759
Heat risk 9/10 · Severe
- Hot days now (above 108°F)
- 7 days/yr
- Hot days in 30 yrs
- 24 days/yr
Wind risk 9/10 · Severe
- Chance of severe wind over 30 yrs
- 99.0%
Air-quality risk 1/10 · Minimal
- Unhealthy air days now
- 0 days/yr
- Unhealthy air days in 30 yrs
- 0 days/yr
Risk factors via First Street. Map © Google.
Why this score? — see what drove the D grade
The composite is a weighted blend of 9 inputs, each scored 0–100. Each bar is that input's sub-score; the figure is the points it added to the 100-point composite (weight × sub-score).
- Cash flow +11.8/30.0
- ARV discount +11.8/15.0
- Schools +3.6/10.0
- DSCR +3.5/10.0
- Livability +3.4/5.0
- Rent growth +2.6/5.0
- Condition / age +2.5/5.0
- 1% rule +2.3/10.0
- Appreciation +0.0/10.0
$352,000
🖨 Deal sheet 📄 Offer letter ✓ Due diligence
Listing remarks
Discover 147 Coralwood Cir, recently refreshed with fresh interior paint and partial flooring replacement throughout. The kitchen contains all stainless steel appliances, complementing the primary bedroom's walk-in closet and the primary bathroom's double sinks. An exterior patio provides an additional functional space. This updated residence perfectly blends comfort and convenience for easy living. Included 100-Day Home Warranty with buyer activation. Garage has been converted to bonus living space; property has no garage.
Key facts
- Double sinks
- Walk-in closet
- Exterior patio
Tags
Property features AI
Finance
- Other: Property zoned OPUD; Residential - Single Family Residence
- Financial info: Lease restrictions apply
- HOA & community: No community association features; No association approval required
Exterior
- Parking: Driveway
- Security: Owned security system
- Utilities: Public water; Public sewer; Electricity available; Water available
- Home design: Single family residence; Two levels; Faces north
- Construction: Stucco construction; Shingle roof; Slab foundation; Built on a 0.13-acre lot
- Exterior features: Other exterior features; Asphalt road access
Interior
- Kitchen: Dishwasher; Range hood
- Bedrooms: 4 bedrooms
- Flooring: Carpet; Laminate; Tile
- Bathrooms: 2 full bathrooms; 1 half bathroom
- Heating & cooling: Central heating; Central air conditioning
- Interior features: Living/dining combination; Owned security system
- Laundry & utility: Laundry in garage; Electric water heater
Neighborhood map
What this means for you Summary
Snapshot
- This is a 4-bed/2.5-bath single-family listed at $352k.
Deal economics
- At list price, monthly cash flow is $-98 ($-1k/yr) — negative.
- To cash-flow at today's rent, offer at most $335k (4.9% below list).
- To meet the 1% rule (rent ≥ 1% of price), the offer needs to be $258k (26.8% below list).
- Recommended offer: $258k (26.8% below list) — sets the bar for 1% rule.
- Cap rate 6.0% vs local median 4.3% in Buenaventura Lakes — top-decile yield for the area; either an underpriced asset or a hidden risk that comps aren't pricing in. Stress-test before assuming the spread holds.
Location & tenants
- Location reads 68/100 on livability (#509 in FL) — a middle-class / working-renter tenant base. Strengths: housing A+, cost of living A, health & safety A-; Watch: employment D+, schools F, amenities F.
- Osceola (suburban): math 39% / reading 45% proficiency, ranked #60 of 73 in FL (top 82%) — families likely to look elsewhere, expect single-tenant / working-renter base with shorter leases; 60% free/reduced lunch — lower-income household profile, screen leases tightly.
- Market conditions: Rents flat; 188 active listings in the ZIP; 40 comparable units currently listed for rent nearby; rentals at typical pace (median 15d on market — plan ~3-4 weeks tenant-placement turnaround); 8,813 units permitted in Osceola County in 2024 (3,072 in 5+ unit buildings).
- At $2,575/mo this rent would consume 49% of the median local household income ($63k/yr) (locally 1624% of renters already pay >50% of income on rent) — very limited rent-growth headroom before tenants either downsize or default.
Forward outlook
- Local home prices are declining (-3.0%/yr); year-one equity from $2k of loan paydown is wiped out by about $11k of value loss. Plan a longer hold.
- Osceola County population projected at +73% by 2050 — long-run rental-demand tailwind backs the buy-and-hold thesis.
Negotiation context
- Only 9 days on market — expect competitive offers; lowballing is unlikely to land.
Risks & watch-outs
- Climate carrying-cost: major flood risk; severe wind risk, 99% chance of damaging wind over 30y; extreme-heat days projected 7→24/yr by 2055 (HVAC capex compounding) — expect insurance premiums to compound above CPI over the hold.
Questions for the listing agent
- What do current leases actually rent for vs. the listed asking? Can we see a recent rent roll and the last 12 months of T-12 income?
- Is there a deadline driving the sale (1031 exchange, divorce, estate, relocation)? That informs how much negotiation room exists.
- Schools are F-rated, which usually means shorter tenancies and higher turnover. Who's the typical renter profile here, and what's been the actual vacancy rate?
- The area grade is low — what's the realistic commute time and amenity access for the typical tenant pool here? Any planned neighborhood developments (good or bad) we should know about?
- What's the average days-on-market for RENTAL listings here right now (not sales)? A rising rental-DOM trend means longer vacancies and softer asking-rent achievability than the comps imply.
- What's the recent tenant-quality profile in this submarket — average credit score on applications, eviction rate, late-payment / NSF rate, and stable-employment percentage? A property-management company in the area should have these aggregated.
- How much new for-sale + rental construction is in the pipeline within 1–3 miles? Heavy new supply typically softens prices + rents 12–24 months out; constrained supply supports both.
Investment metrics
- 1% rule
- 0.73% ✗
- Cap rate
- 5.96%
- Cash-on-cash
- -1.19%
- DSCR
- 0.95
- GRM
- 11.4
CMA / ARV
- ARV (on-the-fly)
- $388,948
- Comps found
- 12
Show comp detail 12 sales within ~0.75 mi
| Address | Dist | Beds/Ba | Sqft | Sold | Price | $/sf | Match |
|---|---|---|---|---|---|---|---|
| 319 Plumwood Cir | 0.26mi | 4/2.0 | 1,735 (-9%) | 2mo | $370,000 | $213 | 68 |
| 108 Honeywood Ct | 0.24mi | 4/2.5 | 2,061 (+8%) | 11mo | $439,000 | $213 | 67 |
| 800 Aspenwood Cir | 0.39mi | 4/2.0 | 1,775 (-7%) | 3mo | $320,000 | $180 | 65 |
| 1353 Ivy Meadow Dr | 0.71mi | 4/2.5 | 1,900 (-1%) | 6mo | $351,000 | $185 | 60 |
| 980 Hickory Ct | 0.59mi | 4/2.0 | 1,765 (-8%) | 1mo | $357,500 | $203 | 56 |
| 812 Balsamwood Ln | 0.50mi | 4/2.0 | 1,775 (-7%) | 9mo | $329,000 | $185 | 55 |
| 869 Aspenwood Cir | 0.59mi | 4/2.0 | 1,775 (-7%) | 5mo | $385,000 | $217 | 54 |
| 180 White Birch Dr | 0.39mi | 3/2.0 (-1) | 1,728 (-10%) | 8mo | $330,000 | $191 | 52 |
| 314 Silk Oak Dr | 0.74mi | 4/3.0 | 2,073 (+8%) | 7mo | $383,000 | $185 | 44 |
| 329 Drake Elm Dr | 0.67mi | 3/2.0 (-1) | 1,720 (-10%) | 11mo | $320,000 | $186 | 35 |
| 229 Competition Dr | 0.64mi | 3/2.0 (-1) | 1,648 (-14%) | 6mo | $450,000 | $273 | 34 |
| 205 Red Maple Dr | 0.69mi | 3/2.0 (-1) | 1,648 (-14%) | 6mo | $389,900 | $237 | 32 |
Match score weights: distance 35% · size 25% · config 20% · recency 20%. Top-matched comps best support the ARV.
Projected returns pro-forma
-3.0% appreciation · 0.34% rent growth · sell at horizon
- IRR
- -20.9%
- Equity multiple
- 0.29×
- Total profit
- $-70,127
- Equity at exit
- $52,484
- IRR
- -20.8%
- Equity multiple
- 0.03×
- Total profit
- $-95,800
- Equity at exit
- $30,435
Cash invested: $98,560 (down + closing). Projections, not guarantees.
Landlord ↔ Tenant lean methodology
- Overall (STATE)
- 87 Strongly Landlord-Friendly
- State Florida
- 87 Strongly Landlord-Friendly · R+3
- County
- — inherits STATE
- City
- — inherits STATE
ZIP-level market 34743
- Rents YoY
- 0.3%
- Active inventory
- 188
- Price-to-rent
- 11.4×
Monthly cashflow live
- Estimated rent
- $2,575 high interval (Pro) →
- Mortgage (P&I)
- −$1,846
- Tax from tax record
- −$140 /mo · $1,676/yr
- Insurance
- −$147
- HOA
- −$0
- Vacancy / Maint / Mgmt
- −$541
- Net cashflow
- $-98
Break-even live
UW: 25.0% down · 7.5% · 30yr · 1.5% tax · 5.0% vac · 8.0% maint · 8.0% mgmt
Financing live
Cash to close
- Down payment
- $88,000
- Closing costs
- $10,560
- Reserves months
- —
- Total cash needed
- —
Loan-product check · same deal, 3 products live
Conventional
25% down · 7.5% · 30yr
- Down + closing
- —
- Monthly P&I
- —
- Monthly cashflow
- —
- DSCR
- —
- Eligible?
- —
Personal DTI + credit; lowest rate.
DSCR
20% down · 8.5% · 30yr
- Down + closing
- —
- Monthly P&I
- —
- Monthly cashflow
- —
- DSCR
- —
- Eligible?
- —
No personal income docs; deal must DSCR.
Hard money
10% down · 12.0% · 12mo
- Down + closing
- —
- Monthly P&I
- —
- Monthly cashflow
- —
- DSCR
- —
- Eligible?
- —
Short-term bridge; refi at stabilization.
Rent comps 40 comps
| Address | Beds | Baths | Sqft | Rent | $/sqft | DOM | Units | Dist |
|---|---|---|---|---|---|---|---|---|
| 14369 Babylon Way Orlando, FL | 4.0 | 2.0 | 2060 | $2,650 | $1.29 | 7d | 1 | 0.42mi |
| 801 Poplarwood Ln Kissimmee, FL | 3.0 | 2.0 | 1390 | $2,300 | $1.65 | 23d | 1 | 0.43mi |
| 326 Oceanside Ct Kissimmee, FL | 3.0 | 2.0 | 1296 | $2,315 | $1.79 | 14d | 1 | 0.44mi |
| 1898 Zac St Kissimmee, FL | 3.0–4.0 | 2.5 | 1740 | $3,280 | $1.88 | 2d | 89 | 0.58mi |
| 933 Whispering Cypress Ln Orlando, FL | 4.0 | 2.5 | 2611 | $2,695 | $1.03 | 3d | 1 | 0.70mi |
| 236 Red Maple Dr Kissimmee, FL | 3.0 | 2.0 | 1720 | $2,135 | $1.24 | 20d | 1 | 0.72mi |
| 313 Silk Oak Dr Kissimmee, FL | 3.0 | 2.0 | 1343 | $2,155 | $1.60 | 23d | 1 | 0.75mi |
| 1440 Timberbend Cir Orlando, FL | 3.0 | 2.0 | 1372 | $2,300 | $1.68 | 23d | 1 | 0.92mi |
| 1313 Timberbend Cir Orlando, FL | 4.0 | 3.0 | 1347 | $2,500 | $1.86 | 10d | 1 | 0.97mi |
| 544 Windrose Dr Orlando, FL | 3.0 | 2.0 | 1564 | $2,349 | $1.50 | 23d | 1 | 0.98mi |
| 3175 Corporate Center Pkwy Kissimmee, FL | 3.0 | 1.0–2.0 | 1023 | $2,936 | $2.87 | 1d | 106 | 1.00mi |
| 31 Lakepointe Cir Kissimmee, FL | 3.0 | 2.0 | 1234 | $2,300 | $1.86 | 21d | 1 | 1.00mi |
| 2936 Twin Oaks Dr Kissimmee, FL | 3.0 | 2.0 | 1641 | $2,150 | $1.31 | 14d | 1 | 1.01mi |
| 72 Lakepointe Cir Kissimmee, FL | 3.0 | 2.5 | 1471 | $2,200 | $1.50 | 17d | 1 | 1.07mi |
| 1501 Chevington Ct Orlando, FL | 4.0 | 2.0 | 1859 | $2,450 | $1.32 | 7d | 1 | 1.09mi |
| 14235 Sun Bay Dr Orlando, FL | 4.0 | 2.5 | 1878 | $2,800 | $1.49 | 4d | 1 | 1.12mi |
| 350 Buttonwood Dr Kissimmee, FL | 3.0 | 2.0 | 1486 | $2,050 | $1.38 | 10d | 1 | 1.12mi |
| 616 Cresting Oak Cir Orlando, FL | 3.0 | 2.5 | 1972 | $2,100 | $1.06 | 23d | 1 | 1.13mi |
| 2875 Bay Ave Kissimmee, FL | 3.0 | 2.0 | 1344 | $1,900 | $1.41 | 17d | 1 | 1.13mi |
| 2875 Bay Ave Kissimmee, FL | 3.0 | 2.0 | 1344 | $1,900 | $1.41 | 14d | 1 | 1.13mi |
| 182 Pinewood Cir Kissimmee, FL | 3.0 | 2.0 | 1462 | $2,300 | $1.57 | 4d | 1 | 1.16mi |
| 1271 Sandestin Way Orlando, FL | 4.0 | 2.5 | 1680 | $2,900 | $1.73 | 23d | 1 | 1.17mi |
| 138 Pinewood Cir Kissimmee, FL | 3.0 | 2.0 | 1326 | $2,200 | $1.66 | 23d | 1 | 1.17mi |
| 1538 Avleigh Cir Orlando, FL | 3.0 | 2.0 | 1406 | $2,350 | $1.67 | 23d | 1 | 1.18mi |
| 1291 Sandestin Way Orlando, FL | 4.0 | 2.5 | 2000 | $2,549 | $1.27 | 4d | 1 | 1.18mi |
| 891 Florida Pkwy Kissimmee, FL | 4.0 | 3.0 | 1812 | $2,100 | $1.16 | 23d | 1 | 1.27mi |
| 2670 Oak Run Blvd Kissimmee, FL | 3.0 | 2.0 | 1530 | $2,450 | $1.60 | 14d | 1 | 1.29mi |
| 153 Sandalwood Dr Kissimmee, FL | 3.0 | 2.0 | 1326 | $2,400 | $1.81 | 23d | 1 | 1.31mi |
| 3258 Fairfield Dr Kissimmee, FL | 4.0 | 2.0 | 1756 | $2,695 | $1.53 | 23d | 1 | 1.35mi |
| 13492 Applerose Ln #22 Orlando, FL | 3.0 | 2.5 | 1495 | $2,379 | $1.59 | 14d | 1 | 1.38mi |
| 2205 Wyndam Way Kissimmee, FL | 4.0 | 2.5 | 2294 | $2,499 | $1.09 | 12d | 1 | 1.38mi |
| 13000 Breaking Dawn Dr Orlando, FL | 1.0–3.0 | 1.0–2.0 | 1055 | $2,279 | $2.16 | 1d | 27 | 1.39mi |
| 1542 Brook Hollow Dr Orlando, FL | 3.0 | 2.0 | 1539 | $2,300 | $1.49 | 10d | 1 | 1.40mi |
| 3100 Orchard Pl Kissimmee, FL | 3.0 | 2.0 | 1565 | $2,140 | $1.37 | 23d | 1 | 1.41mi |
| 219 Glowing Peace Ln #85 Orlando, FL | 3.0 | 2.5 | 1495 | $1,995 | $1.33 | 10d | 1 | 1.44mi |
| 15067 Willow Arbor Cir Orlando, FL | 3.0 | 2.5 | 2303 | $2,445 | $1.06 | 7d | 1 | 1.44mi |
| 15055 Willow Arbor Cir Orlando, FL | 3.0 | 2.5 | 1803 | $2,500 | $1.39 | 14d | 1 | 1.44mi |
| 1524 Astoria Arbor Ln Orlando, FL | 3.0 | 2.5 | 2058 | $2,500 | $1.21 | 21d | 1 | 1.45mi |
| 2061 Marsh Hawk Dr Orlando, FL | 3.0 | 2.0 | 1847 | $2,291 | $1.24 | 14d | 1 | 1.47mi |
| 201 Royal Tupper Ter Kissimmee, FL | 1.0–3.0 | 1.0–2.0 | 1064 | $3,238 | $3.04 | 2d | 68 | 1.47mi |
Listing history 10 events
-
2026-06-04status $352,000 Pending 9 DOM
-
2026-06-03days on market $352,000 Active 9 DOM
-
2026-06-02days on market $352,000 Active 8 DOM
-
2026-06-01days on market $352,000 Active 7 DOM
-
2026-05-31days on market $352,000 Active 6 DOM
-
2026-05-25$352,000 Active
-
2026-05-06soldstatus $369,200
-
1997-04-11soldstatus $89,900
-
1989-08-01soldstatus $87,200
-
1989-04-01soldstatus $103,500
ⓘ Source: listings_history table (triggers on properties + properties_extension) + one-shot
backfill from property_details.listing_events for pre-trigger history.
Tax reassessment forecast FL · Resets to sale price
- Current annual tax
- $1,676 · $140/mo
- Projected year-2 tax
- $2,922 · $243/mo
- Expected delta
- +$1,246/yr (+$104/mo · 74.3%)
ⓘ Screening estimate from a state-policy table — verify with the county assessor before closing.
Climate risk First Street
- Flood 6/10 Major FEMA zone X (unshaded) · 69% chance over 30 yrs
- Wildfire 4/10 Moderate
- Heat 9/10 Extreme 7 d/yr ≥108°F today · 24 d/yr by 30 yrs out
- Wind 9/10 Extreme 99% chance of damaging wind over 30 yrs
- Air quality 1/10 Low 0 unhealthy d/yr today · 0 by 30 yrs out
Nearby sold comps map
Loading sold comps map…
Walkable amenities ~0.75 mi
Loading nearby amenities…
Taxation est. · year 1
- Rental income
- $30,903
- − Mortgage interest
- −$19,717
- − Property taxes
- −$1,676
- − Insurance
- −$1,760
- − Repairs & maintenance
- −$2,472
- − Management
- −$2,472
- − Depreciation
- −$10,240
- Taxable loss
- −$7,435
- Est. tax savings @ 24.0%
- +$1,784
- After-tax cash flow
- $611/yr
For passive investors: Depreciation is non-cash, so a rental often shows a tax loss while cash-flowing — sheltering income. Rental losses are passive: they offset passive income freely, and up to $25,000/yr can offset ordinary (W-2) income if you actively participate and your MAGI is under $100k (phasing out to $0 by $150k); unused losses carry forward. On sale, claimed depreciation is recaptured at up to 25%, and gains may owe capital-gains tax (a 1031 exchange can defer both). Figures are a year-1 estimate at your 24.0% rate — not tax advice; consult a CPA.
Schools (NCES district)
- District
- Osceola
- NCES district ID
- 1201470
- Math proficiency
- 39% ▼ -9.00%
- Reading proficiency
- 45% ▼ -4.00%
- Median HH income
- $45,528
- Composite
- 35.7/100
- National rank
- #4865
- State rank
- #60 of 73 in FL
Livability — Buenaventura Lakes
- Score
- 68/100
- State rank
- #509
- US rank
- #9375
Category grades
Schools grade is shown separately in the Schools card above.
Census & demographics
- Census place
- Buenaventura Lakes, FL
- County
- Osceola County · 410,217 people
- City population
- 40,656
- Metro
- Orlando-Kissimmee-Sanford, FL
- Population (ZIP)
- 40,030
- Household income
- $62,992
- Rent vs Own
- Severe rent burden
- 1624.0
Population outlook (Osceola County) Hauer SSP2
- Today (2025)
- 447,624 people
- By 2030
- 511,823 · +14.3%
- By 2040
- 642,986 · +43.6%
- By 2050
- 774,552 · +73.0%
- By 2075
- 1,078,144 · +140.9%
- By 2100
- 1,269,660 · +183.6%
Race, ethnicity, and origin ACS 2023
- Neighborhood character
- Predominantly Hispanic (76%)
- Race & ethnicity
- Hispanic / Latino 76% Two or more races 25% White 10% Black 9% Asian 3%
- Hispanic origin (detail)
- Mexican 2% Puerto Rican 43% Cuban 5% Dominican 7%
- Common ancestry
- Hispanic 2% Lithuanian 1% Romanian 1%
- Foreign-born
- 27% · Canada, Jamaica
- Languages at home
- 32% English-only · Spanish 63% French/Haitian/Cajun 2% Tagalog/Filipino 2%
Political lean MEDSL · Osceola
- 2024 margin
- Toss-up / Even · D 48.7% · R 50.2% · Other 1.1%
- 2008→2024 swing
- -21.2pp toward R · 2008: 19.7pp · 2024: -1.4pp
- All cycles
- 2024: R+1.4 2020: D+13.8 2016: D+25.0 2012: D+24.5 2008: D+19.7
Not yet ingested
- Civics
- —
Market trends
- HPI YoY
- ▼ -304.87%
- Current HPI
- 352.0782
- Rent YoY
- ▲ 0.34%
- Metro
- Orlando-Kissimmee-Sanford, FL
- State GDP YoY
- ▲ 3.28%
- F500 in state
- 36
Industry mix (Fortune 500 HQ in FL)
| Industry | F500 HQs | Revenue |
|---|---|---|
| Industrial Technology | 2 | $29B |
|
||
| Insurance | 2 | $17B |
|
||
| Retail | 1 | $60B |
|
||
| Technology Distribution | 1 | $58B |
|
||
| Homebuilding | 1 | $35B |
|
||
| Technology Manufacturing | 1 | $35B |
|
||
Price history
+240.1% since first listed5 events — show timeline
- 2026-05-25 Listed $352,000 Stellar MLS as Distributed by MLS Grid
- 2026-05-06 Sold (Public Records) $369,200 Public Records
- 1997-04-11 Sold (Public Records) $89,900 Public Records
- 1989-08-01 Sold (Public Records) $87,200 Public Records
- 1989-04-01 Sold (Public Records) $103,500 Public Records
Property tax history
+3.7%/yrLatest (2025): $1,676 · +7.9% YoY. Source: county tax records.
Cash-flow waterfall
monthlySold comps — $/sqft
last 12 mo · ≤1 miLoading sold comps…