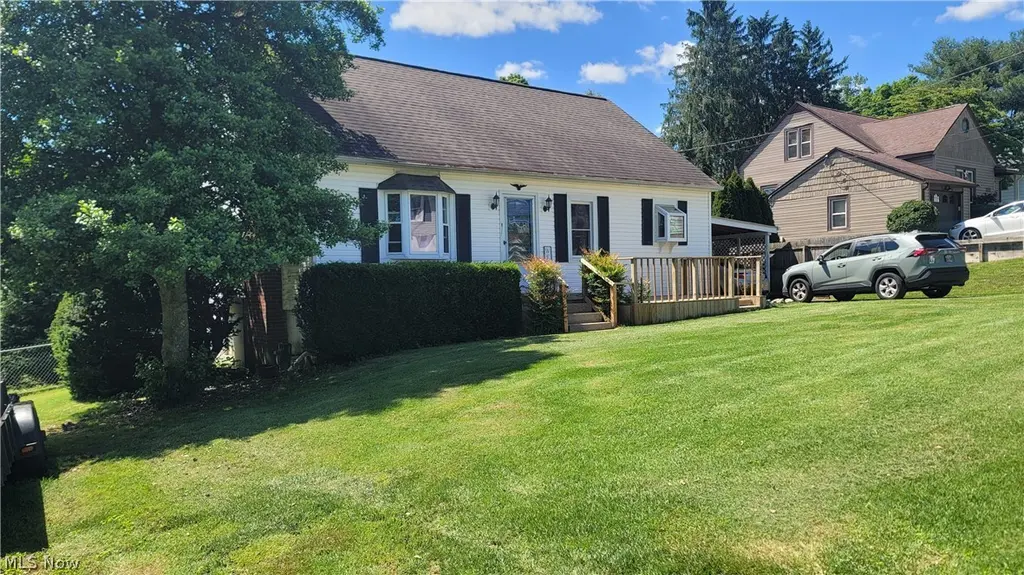
107 Woodrow St · Devola, OH
Flood risk 4/10 · Minor
- FEMA flood zone
- X (unshaded)
- Chance of flooding over 30 yrs
- 0.24%
- Est. flood insurance / yr
- $473 – $860
Fire risk 1/10 · Minimal
- Est. fire insurance / yr
- $713 – $1,323
Heat risk 4/10 · Minor
- Hot days now (above 99°F)
- 7 days/yr
- Hot days in 30 yrs
- 19 days/yr
Wind risk 2/10 · Minimal
- Chance of severe wind over 30 yrs
- 1.0%
Air-quality risk 2/10 · Minimal
- Unhealthy air days now
- 0 days/yr
- Unhealthy air days in 30 yrs
- 1 days/yr
Risk factors via First Street. Map © Google.
Why this score? — see what drove the C- grade
The composite is a weighted blend of 9 inputs, each scored 0–100. Each bar is that input's sub-score; the figure is the points it added to the 100-point composite (weight × sub-score).
- Cash flow +21.4/30.0
- ARV discount +7.5/15.0
- DSCR +6.8/10.0
- 1% rule +5.6/10.0
- Livability +3.6/5.0
- Schools +3.5/10.0
- Rent growth +2.5/5.0
- Condition / age +2.5/5.0
- Appreciation +0.0/10.0
$160,000
🖨 Deal sheet 📄 Offer letter ✓ Due diligence
Listing remarks
Quiet street in Devola ready for a little loving. Estate sale. 2 bedrooms on main floor, 1 upstairs with office area. Full walkout basement. Open kitchen into living room. New deck in the front. Covered entry on side. Large 1 car garage. Large carport. Nice size fenced in yard.
Key facts
- New deck
- Covered entry
- Open kitchen
Tags
Property features AI
Exterior
- Parking: Detached garage; 1 garage space; Detached carport; 1 carport space; Driveway parking; Off-street parking
- Security: Smoke detectors
- Utilities: Public water; Public sewer
- Home design: 2-story home; Fixer condition; Below-grade finished area included
- Construction: Aluminum and vinyl siding; Asphalt/fiberglass roof; Block foundation; Built per assessor records
- Exterior features: Private backyard; Back yard; Rectangular lot; Covered patio/porch; Deck; Front porch
Interior
- Kitchen: Dishwasher; Range; Refrigerator; Freezer
- Bedrooms: 2 main-level bedrooms
- Bathrooms: 1 full bathroom on the main level
- Heating & cooling: Forced air heating (gas); Central air conditioning; Ceiling fans
- Interior features: Primary bedroom is on the main level; Decorative fireplace
- Laundry & utility: Washer in basement; Laundry located in basement
Neighborhood map
What this means for you Summary
Snapshot
- This is a 3-bed/1.0-bath single-family listed at $160k.
Deal economics
- At list price, monthly cash flow is $237 ($3k/yr) — positive.
- The deal already cash-flows at list — no discount required.
- Meets the 1% rule at list price ($2k rent vs $160k).
- Recommended offer: $158k (1.5% below list) — sets the bar for market timing.
Location & tenants
- Location reads 72/100 on livability (#377 in OH) — a middle-class / working-renter tenant base. Strengths: crime A+, employment A+, cost of living A+; Watch: health & safety D, amenities F, commute F.
- Marietta City (town): math 35% / reading 49% proficiency, ranked #534 of 656 in OH (top 81%) — families likely to look elsewhere, expect single-tenant / working-renter base with shorter leases.
- Market conditions: 118 active listings in the ZIP; 3 units permitted in Washington County in 2024 (0 in 5+ unit buildings).
- This rent runs 34% of the median local income ($60k/yr) — at the standard rent-burdened threshold; future hikes will face affordability resistance.
Forward outlook
- Local home prices are declining (-3.0%/yr); year-one equity from $1k of loan paydown is wiped out by about $5k of value loss. Plan a longer hold.
- Washington County population projected at -12% by 2050 — secular population decline; favor cash flow + early exit over multi-decade hold.
Negotiation context
- It's been on market 21 days — a 2% lower offer ($158k) is reasonable based on typical stale-listing flexibility.
- Current owner paid $90k; list at $160k implies a 79% gain — meaningful room to come down on a strong offer.
Risks & watch-outs
- Watch-outs: built in 1951 — expect roof / HVAC / electrical / plumbing capex.
Questions for the listing agent
- Built in 1951 — when were the roof, HVAC, electrical panel, plumbing, and water heater last replaced?
- Is there a deadline driving the sale (1031 exchange, divorce, estate, relocation)? That informs how much negotiation room exists.
- What's the average days-on-market for RENTAL listings here right now (not sales)? A rising rental-DOM trend means longer vacancies and softer asking-rent achievability than the comps imply.
- What's the recent tenant-quality profile in this submarket — average credit score on applications, eviction rate, late-payment / NSF rate, and stable-employment percentage? A property-management company in the area should have these aggregated.
- How much new for-sale + rental construction is in the pipeline within 1–3 miles? Heavy new supply typically softens prices + rents 12–24 months out; constrained supply supports both.
Investment metrics
- 1% rule
- 1.06% ✓
- Cap rate
- 8.07%
- Cash-on-cash
- 6.34%
- DSCR
- 1.28
- GRM
- 7.9
CMA / ARV
- ARV (on-the-fly)
- $378,216
- Comps found
- 12
Show comp detail 12 sales within ~0.75 mi
| Address | Dist | Beds/Ba | Sqft | Sold | Price | $/sf | Match |
|---|---|---|---|---|---|---|---|
| 608 Masonic Park Rd | 0.23mi | 3/2.0 | 2,556 (+3%) | 10mo | $227,500 | $89 | 71 |
| 105 Country Club Dr | 0.72mi | 3/2.5 | 2,380 (-4%) | 2mo | $353,000 | $148 | 53 |
| 106 Marshall Rd | 0.19mi | 2/3.0 (-1) | 2,156 (-13%) | 6mo | $340,000 | $158 | 52 |
| 4 Ness Pl | 0.27mi | 4/2.5 (+1) | 2,276 (-8%) | 15mo | $396,000 | $174 | 51 |
| 116 Robson Rd | 0.40mi | 3/3.0 | 2,250 (-9%) | 14mo | $370,500 | $165 | 47 |
| 4 Julie Ln | 0.52mi | 4/2.5 (+1) | 2,676 (+8%) | 7mo | $365,000 | $136 | 45 |
| 214 Alden Ave | 0.65mi | 4/2.5 (+1) | 2,710 (+10%) | 0mo | $395,000 | $146 | 43 |
| 1145 Ash Rd | 0.61mi | 4/3.0 (+1) | 2,328 (-6%) | 22mo | $315,000 | $135 | 31 |
| 101 Keyser St | 0.62mi | 4/3.5 (+1) | 2,204 (-11%) | 10mo | $350,000 | $159 | 30 |
| 435 Strecker Ln | 0.74mi | 4/3.5 (+1) | 2,320 (-6%) | 15mo | $330,000 | $142 | 28 |
| 218 Alden Ave | 0.67mi | 4/2.5 (+1) | 2,264 (-8%) | 23mo | $347,000 | $153 | 24 |
| 1255 Ash Rd | 0.66mi | 3/2.5 | 2,838 (+15%) | 19mo | $435,000 | $153 | 22 |
Match score weights: distance 35% · size 25% · config 20% · recency 20%. Top-matched comps best support the ARV.
Projected returns pro-forma
-3.0% appreciation · 3.0% rent growth · sell at horizon
- IRR
- -6.5%
- Equity multiple
- 0.76×
- Total profit
- $-10,838
- Equity at exit
- $23,857
- IRR
- 3.1%
- Equity multiple
- 1.22×
- Total profit
- $10,048
- Equity at exit
- $13,834
Cash invested: $44,800 (down + closing). Projections, not guarantees.
Landlord ↔ Tenant lean methodology
- Overall (STATE)
- 73 Landlord-Friendly
- State Ohio
- 73 Landlord-Friendly · R+6
- County
- — inherits STATE
- City
- — inherits STATE
ZIP-level market 45750
- Home prices YoY
- -32.4%
- Active inventory
- 118
- Price-to-rent
- 7.9×
Monthly cashflow live
- Estimated rent
- $1,689 medium interval (Pro) →
- Mortgage (P&I)
- −$839
- Tax from tax record
- −$192 /mo · $2,301/yr
- Insurance
- −$67
- HOA
- −$0
- Vacancy / Maint / Mgmt
- −$355
- Net cashflow
- $237
Break-even live
UW: 25.0% down · 7.5% · 30yr · 1.5% tax · 5.0% vac · 8.0% maint · 8.0% mgmt
Financing live
Cash to close
- Down payment
- $40,000
- Closing costs
- $4,800
- Reserves months
- —
- Total cash needed
- —
Loan-product check · same deal, 3 products live
Conventional
25% down · 7.5% · 30yr
- Down + closing
- —
- Monthly P&I
- —
- Monthly cashflow
- —
- DSCR
- —
- Eligible?
- —
Personal DTI + credit; lowest rate.
DSCR
20% down · 8.5% · 30yr
- Down + closing
- —
- Monthly P&I
- —
- Monthly cashflow
- —
- DSCR
- —
- Eligible?
- —
No personal income docs; deal must DSCR.
Hard money
10% down · 12.0% · 12mo
- Down + closing
- —
- Monthly P&I
- —
- Monthly cashflow
- —
- DSCR
- —
- Eligible?
- —
Short-term bridge; refi at stabilization.
Listing history 18 events
-
2026-06-19days on market $160,000 Active 21 DOM
-
2026-06-18days on market $160,000 Active 20 DOM
-
2026-06-17days on market $160,000 Active 19 DOM
-
2026-06-16days on market $160,000 Active 18 DOM
-
2026-06-15days on market $160,000 Active 17 DOM
-
2026-06-14days on market $160,000 Active 15 DOM
-
2026-06-12days on market $160,000 Active 14 DOM
-
2026-06-09days on market $160,000 Active 11 DOM
-
2026-06-08days on market $160,000 Active 10 DOM
-
2026-06-07days on market $160,000 Active 9 DOM
-
2026-06-07days on market $160,000 Active 8 DOM
-
2026-06-03days on market $160,000 Active 5 DOM
-
2026-06-02days on market $160,000 Active 4 DOM
-
2026-06-01days on market $160,000 Active 3 DOM
-
2026-05-31days on market $160,000 Active 2 DOM
-
2026-05-29$160,000 Active
-
2000-09-25soldstatus $89,500
-
1994-09-06soldstatus $55,000
ⓘ Source: listings_history table (triggers on properties + properties_extension) + one-shot
backfill from property_details.listing_events for pre-trigger history.
Tax reassessment forecast OH · Partial reset (capped growth)
- Current annual tax
- $2,301 · $192/mo
- Projected year-2 tax
- $2,398 · $200/mo
- Expected delta
- +$98/yr (+$8/mo · 4.2%)
ⓘ Screening estimate from a state-policy table — verify with the county assessor before closing.
Climate risk First Street
- Flood 4/10 Moderate FEMA zone X (unshaded) · 24% chance over 30 yrs
- Wildfire 1/10 Low
- Heat 4/10 Moderate 7 d/yr ≥99°F today · 19 d/yr by 30 yrs out
- Wind 2/10 Low 100% chance of damaging wind over 30 yrs
- Air quality 2/10 Low 0 unhealthy d/yr today · 1 by 30 yrs out
Nearby sold comps map
Loading sold comps map…
Walkable amenities ~0.75 mi
Loading nearby amenities…
Taxation est. · year 1
- Rental income
- $20,264
- − Mortgage interest
- −$8,962
- − Property taxes
- −$2,301
- − Insurance
- −$800
- − Repairs & maintenance
- −$1,621
- − Management
- −$1,621
- − Depreciation
- −$4,655
- Taxable income
- $304
- Est. tax owed @ 24.0%
- −$73
- After-tax cash flow
- $2,766/yr
For passive investors: Depreciation is non-cash, so a rental often shows a tax loss while cash-flowing — sheltering income. Rental losses are passive: they offset passive income freely, and up to $25,000/yr can offset ordinary (W-2) income if you actively participate and your MAGI is under $100k (phasing out to $0 by $150k); unused losses carry forward. On sale, claimed depreciation is recaptured at up to 25%, and gains may owe capital-gains tax (a 1031 exchange can defer both). Figures are a year-1 estimate at your 24.0% rate — not tax advice; consult a CPA.
Schools (NCES district)
- District
- Marietta City
- NCES district ID
- 3910019
- Math proficiency
- 35% ▼ -20.00%
- Reading proficiency
- 49% ▼ -12.00%
- Median HH income
- $39,366
- Composite
- 35.08/100
- National rank
- #5025
- State rank
- #534 of 656 in OH
Livability — Devola
- Score
- 72/100
- State rank
- #377
- US rank
- #6141
Category grades
Schools grade is shown separately in the Schools card above.
Census & demographics
- Census place
- Devola, OH
- County
- Washington County · 26,420 people
- Metro
- Marietta, OH
- Population (ZIP)
- 26,420
- Household income
- $60,229
- Rent vs Own
- Severe rent burden
- 727.0
Population outlook (Washington County) Hauer SSP2
- Today (2025)
- 59,640 people
- By 2030
- 58,315 · -2.2%
- By 2040
- 55,186 · -7.5%
- By 2050
- 52,246 · -12.4%
- By 2075
- 45,893 · -23.0%
- By 2100
- 38,128 · -36.1%
Race, ethnicity, and origin ACS 2023
- Neighborhood character
- Predominantly White (94%)
- Race & ethnicity
- White 94% Two or more races 2% Asian 1% Black 1% Hispanic / Latino 1%
- Common ancestry
- Italian 2% Slovak 2% Romanian 2%
- Foreign-born
- 2% · Canada
- Languages at home
- 97% English-only · Tagalog/Filipino 1% Other Indo-European 1%
Political lean MEDSL · Washington
- 2024 margin
- Solid R (+43.8) · D 27.7% · R 71.5%
- 2008→2024 swing
- +40.2pp toward D · 2008: -83.9pp · 2024: -43.8pp
- All cycles
- 2024: R+43.8 2020: R+40.8 2016: R+41.6 2012: R+19.4 2008: R+83.9
Not yet ingested
- Civics
- —
Market trends
- HPI YoY
- ▼ -95.06%
- Current HPI
- 198.6235
- Rent YoY
- —
- Metro
- Marietta, OH
- State GDP YoY
- ▲ 1.98%
- F500 in state
- 48
Industry mix (Fortune 500 HQ in OH)
| Industry | F500 HQs | Revenue |
|---|---|---|
| Insurance | 3 | $145B |
|
||
| Industrial Machinery | 3 | $49B |
|
||
| Financial Services | 3 | $24B |
|
||
| Consumer Goods | 2 | $93B |
|
||
| Aerospace / Defense | 2 | $47B |
|
||
| Utilities | 2 | $33B |
|
||
Price history
+190.9% since first listed3 events — show timeline
- 2026-05-29 Listed $160,000 MLSNOW
- 2000-09-25 Sold (Public Records) $89,500 Public Records
- 1994-09-06 Sold (Public Records) $55,000 Public Records
Property tax history
+3.9%/yrLatest (2025): $2,301 · +12.6% YoY. Source: county tax records.
Cash-flow waterfall
monthlySold comps — $/sqft
last 12 mo · ≤1 miLoading sold comps…