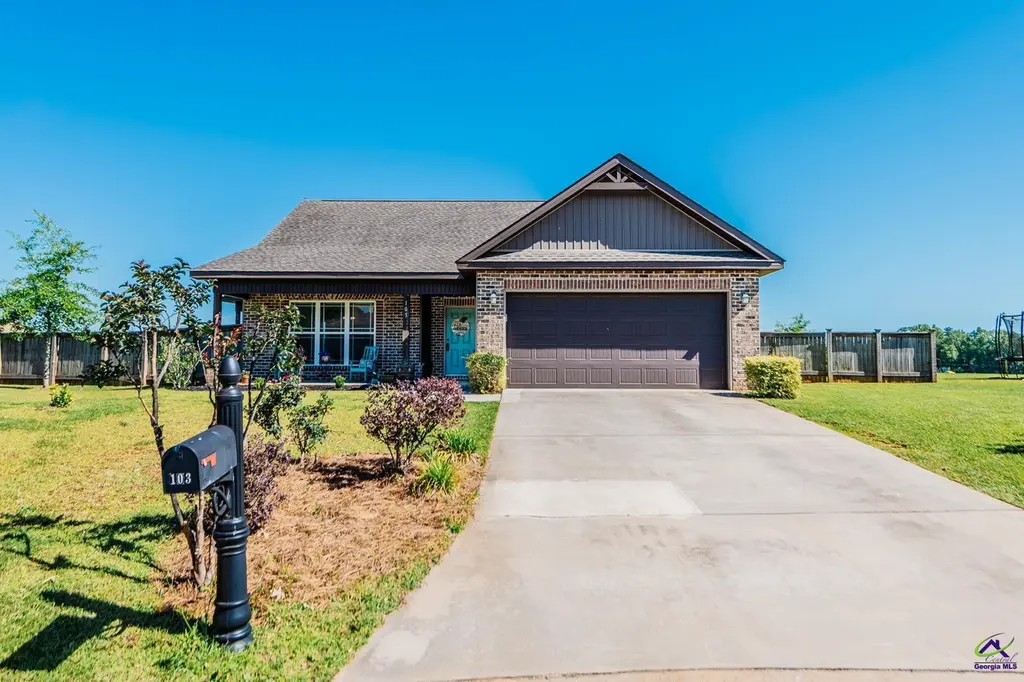
103 Lasseter Ln · Perry, GA
Flood risk 1/10 · Minimal
- FEMA flood zone
- X (unshaded)
- Chance of flooding over 30 yrs
- 0.0%
- Est. flood insurance / yr
- $507 – $1,088
Fire risk 4/10 · Minor
- Est. fire insurance / yr
- $963 – $1,789
Heat risk 7/10 · Major
- Hot days now (above 109°F)
- 7 days/yr
- Hot days in 30 yrs
- 19 days/yr
Wind risk 8/10 · Major
- Chance of severe wind over 30 yrs
- 80.0%
Air-quality risk 2/10 · Minimal
- Unhealthy air days now
- 2 days/yr
- Unhealthy air days in 30 yrs
- 2 days/yr
Risk factors via First Street. Map © Google.
Why this score? — see what drove the D- grade
The composite is a weighted blend of 9 inputs, each scored 0–100. Each bar is that input's sub-score; the figure is the points it added to the 100-point composite (weight × sub-score).
- Cash flow +12.8/30.0
- ARV discount +6.0/15.0
- Schools +3.9/10.0
- DSCR +3.8/10.0
- Livability +3.4/5.0
- Rent growth +3.2/5.0
- 1% rule +2.8/10.0
- Condition / age +2.5/5.0
- Appreciation +0.0/10.0
$259,900
🖨 Deal sheet (PDF) 📄 Offer letter ✓ Due diligence
Listing remarks MLS
Beautiful 4 bedroom, 2 bath home. Upgrades with many extras such as granite, stainless appliances, unique light fixtures, and more.
Key facts
- Spacious island
- Firepit
- Abundant cabinetry
Tags
Property features AI
Finance
- Other: Listing broker: KELLER WILLIAMS REALTY MIDDLE GEORGIA; Listing agent: Alicia Watson, MOB: 478-951-2740
Exterior
- Parking: 2-car garage
- Utilities: Public water; Public sewer
- Home design: Single-family detached residence; Residential property
- Construction: 1,508 above-grade finished area
- Exterior features: Half-acre lot (0.55 acres); Located in REMINGTON CHASE subdivision; Cul-de-sac location (per directions)
Interior
- Kitchen: Electric range
- Bathrooms: 2 full bathrooms
- Heating & cooling: Central heating (electric); Central air conditioning
- Interior features: Fireplace (1)
Neighborhood map
What this means for you Summary
Snapshot
- This is a 4-bed/2.0-bath single-family listed at $260k.
Deal economics
- At list price, monthly cash flow is $-25 ($-298/yr) — negative.
- To cash-flow at today's rent, offer at most $256k (1.7% below list).
- To meet the 1% rule (rent ≥ 1% of price), the offer needs to be $202k (22.1% below list).
- Recommended offer: $202k (22.1% below list) — sets the bar for 1% rule.
- Cap rate 6.2% vs local median 4.5% in Perry — top-decile yield for the area; either an underpriced asset or a hidden risk that comps aren't pricing in. Stress-test before assuming the spread holds.
Location & tenants
- Location reads 68/100 on livability (#149 in GA) — a middle-class / working-renter tenant base. Strengths: cost of living A+, housing A+, crime B+; Watch: amenities F, commute F, health & safety F.
- Houston County (urban): math 43% / reading 46% proficiency, ranked #23 of 174 in GA (top 13%) — families likely to look elsewhere, expect single-tenant / working-renter base with shorter leases.
- Zoned schools: Kings Chapel Elementary School (math 62% / reading 58%, grade B-, #126 of 1,228 statewide, top 10%, 632 students, 32% FRL); Perry Middle School (math 53% / reading 51%, grade C+, #60 of 470 statewide, top 13%, 1,070 students, 51% FRL); Perry High School (math 31% / reading 39%, grade F, #84 of 424 statewide, top 20%, 1,478 students, 48% FRL) — zoned schools at 44% FRL track the district average.
- Market conditions: Rents rising (+2.8%/yr); 166 active listings in the ZIP; 4 comparable units currently listed for rent nearby; rentals at typical pace (median 23d on market — plan ~3-4 weeks tenant-placement turnaround); 1,545 units permitted in Houston County in 2024 (336 in 5+ unit buildings).
- At $2,024/mo this rent would consume 53% of the median local household income ($46k/yr) (locally 1516% of renters already pay >50% of income on rent) — very limited rent-growth headroom before tenants either downsize or default.
Forward outlook
- Local home prices are declining (-3.0%/yr); year-one equity from $2k of loan paydown is wiped out by about $8k of value loss. Plan a longer hold.
- Houston County population projected at +22% by 2050 — long-run rental-demand tailwind backs the buy-and-hold thesis.
Negotiation context
- It's been on market 22 days — a 2% lower offer ($256k) is reasonable based on typical stale-listing flexibility.
- 2 sale attempts since 9y ago with the ask held roughly flat each time — persistent listings suggest the price (not the market) is what's stuck; bring a comps-based counter.
- Current owner paid $157k; list at $260k implies a 66% gain — meaningful room to come down on a strong offer.
Risks & watch-outs
- Climate carrying-cost: severe wind risk, 80% chance of damaging wind over 30y; extreme-heat days projected 7→19/yr by 2055 (HVAC capex compounding) — expect insurance premiums to compound above CPI over the hold.
Questions for the listing agent
- What do current leases actually rent for vs. the listed asking? Can we see a recent rent roll and the last 12 months of T-12 income?
- Is there a deadline driving the sale (1031 exchange, divorce, estate, relocation)? That informs how much negotiation room exists.
- The area grade is low — what's the realistic commute time and amenity access for the typical tenant pool here? Any planned neighborhood developments (good or bad) we should know about?
- What's the average days-on-market for RENTAL listings here right now (not sales)? A rising rental-DOM trend means longer vacancies and softer asking-rent achievability than the comps imply.
- What's the recent tenant-quality profile in this submarket — average credit score on applications, eviction rate, late-payment / NSF rate, and stable-employment percentage? A property-management company in the area should have these aggregated.
- How much new for-sale + rental construction is in the pipeline within 1–3 miles? Heavy new supply typically softens prices + rents 12–24 months out; constrained supply supports both.
Investment metrics
- 1% rule
- 0.78% ✗
- Cap rate
- 6.18%
- Cash-on-cash
- -0.41%
- DSCR
- 0.98
- GRM
- 10.7
CMA / ARV
- ARV (on-the-fly)
- $251,292
- Comps found
- 12
Show comp detail 12 sales within ~0.75 mi
| Address | Dist | Beds/Ba | Sqft | Sold | Price | $/sf | Match |
|---|---|---|---|---|---|---|---|
| 128 Gage Dr | 0.05mi | 3/2.0 (-1) | 1,568 (+7%) | 2mo | $265,000 | $169 | 79 |
| 217 Ellington Ct | 0.29mi | 3/2.0 (-1) | 1,547 (+6%) | 1mo | $229,000 | $148 | 71 |
| 216 Winsted Ct | 0.52mi | 4/2.0 | 1,415 (-3%) | 2mo | $242,500 | $171 | 69 |
| 115 Worchester Cir | 0.56mi | 3/2.0 (-1) | 1,514 (+4%) | 1mo | $264,600 | $175 | 62 |
| 104 Ellington Ct | 0.40mi | 3/2.0 (-1) | 1,299 (-11%) | 2mo | $223,500 | $172 | 56 |
| 106 New Hope Dr | 0.67mi | 3/2.0 (-1) | 1,405 (-4%) | 2mo | $260,000 | $185 | 56 |
| 133 Worchester Cir | 0.47mi | 3/2.0 (-1) | 1,608 (+10%) | 1mo | $259,900 | $162 | 55 |
| 105 Ellington Ct | 0.38mi | 3/2.0 (-1) | 1,270 (-13%) | 0mo | $224,000 | $176 | 55 |
| 212 Haven Way | 0.37mi | 3/2.0 (-1) | 1,270 (-13%) | 2mo | $219,000 | $172 | 54 |
| 212 Winsted Ct | 0.52mi | 3/2.0 (-1) | 1,271 (-13%) | 1mo | $228,000 | $179 | 48 |
| 308 Haven Way | 0.47mi | 3/2.0 (-1) | 1,250 (-14%) | 2mo | $127,000 | $102 | 47 |
| 403 Avington Chase | 0.65mi | 4/2.0 | 1,669 (+14%) | 2mo | $279,500 | $167 | 44 |
Match score weights: distance 35% · size 25% · config 20% · recency 20%. Top-matched comps best support the ARV.
Projected returns pro-forma
-3.0% appreciation · 2.78% rent growth · sell at horizon
- IRR
- -17.2%
- Equity multiple
- 0.39×
- Total profit
- $-44,217
- Equity at exit
- $38,752
- IRR
- -9.6%
- Equity multiple
- 0.41×
- Total profit
- $-42,669
- Equity at exit
- $22,471
Cash invested: $72,772 (down + closing). Projections, not guarantees.
Landlord ↔ Tenant lean methodology
- Overall (STATE)
- 90 Strongly Landlord-Friendly
- State Georgia
- 90 Strongly Landlord-Friendly · R+3
- County
- — inherits STATE
- City
- — inherits STATE
ZIP-level market 31093
- Rents YoY
- 2.8%
- Active inventory
- 166
- Price-to-rent
- 10.7×
Monthly cashflow live
- Estimated rent
- $2,024 medium interval (Pro) →
- Mortgage (P&I)
- −$1,363
- Tax from tax record
- −$153 /mo · $1,831/yr
- Insurance
- −$108
- HOA
- −$0
- Vacancy / Maint / Mgmt
- −$425
- Net cashflow
- $-25
Break-even live
Sensitivity live
| Price | -10% $122 | -5% $49 | +0% $-25 | +5% $-98 | +10% $-172 |
|---|---|---|---|---|---|
| Rent | -10% $-185 | -5% $-105 | +0% $-25 | +5% $55 | +10% $135 |
| Rate | -1.0pp $106 | -0.5pp $41 | base $-25 | +0.5pp $-92 | +1.0pp $-161 |
UW: 25.0% down · 7.5% · 30yr · 1.5% tax · 5.0% vac · 8.0% maint · 8.0% mgmt
Financing live
Cash to close
- Down payment
- $64,975
- Closing costs
- $7,797
- Reserves months
- —
- Total cash needed
- —
Loan-product check · same deal, 3 products live
Conventional
25% down · 7.5% · 30yr
- Down + closing
- —
- Monthly P&I
- —
- Monthly cashflow
- —
- DSCR
- —
- Eligible?
- —
Personal DTI + credit; lowest rate.
DSCR
20% down · 8.5% · 30yr
- Down + closing
- —
- Monthly P&I
- —
- Monthly cashflow
- —
- DSCR
- —
- Eligible?
- —
No personal income docs; deal must DSCR.
Hard money
10% down · 12.0% · 12mo
- Down + closing
- —
- Monthly P&I
- —
- Monthly cashflow
- —
- DSCR
- —
- Eligible?
- —
Short-term bridge; refi at stabilization.
Rent comps 4 comps
| Address | Beds | Baths | Sqft | Rent | $/sqft | DOM | Units | Dist |
|---|---|---|---|---|---|---|---|---|
| 108 Ellington Ct Perry, GA | 3.0 | 2.0 | 1286 | $1,750 | $1.36 | 22d | 1 | 0.37mi |
| 120 Worchester Cir Perry, GA | 4.0 | 2.0 | 1751 | $2,260 | $1.29 | 15d | 1 | 0.55mi |
| 608 Daisy Dr Perry, GA | 4.0 | 2.0 | 1582 | $1,950 | $1.23 | 45d | 1 | 0.83mi |
| 215 Rainsong Trl Perry, GA | 4.0 | 2.0 | 1836 | $2,450 | $1.33 | 22d | 1 | 1.13mi |
Listing history 12 events
-
2026-06-07statusdays on market $259,900 Pending 22 DOM
-
2026-06-05days on market $259,900 Active Under Contract 20 DOM
-
2026-06-03days on market $259,900 Active Under Contract 19 DOM
-
2026-06-02days on market $259,900 Active Under Contract 18 DOM
-
2026-06-01days on market $259,900 Active Under Contract 17 DOM
-
2026-05-31days on market $259,900 Active Under Contract 16 DOM
-
2026-05-30days on market $259,900 Active Under Contract 15 DOM
-
2026-05-15$259,900 Active
-
2017-10-20soldstatus $157,000 131-char remark
Show marketing remark (131 chars)
Beautiful 4 bedroom, 2 bath home. Upgrades with many extras such as granite, stainless appliances, unique light fixtures, and more.
-
2017-10-20soldstatus $157,000 131-char remark
Show marketing remark (131 chars)
Beautiful 4 bedroom, 2 bath home. Upgrades with many extras such as granite, stainless appliances, unique light fixtures, and more.
-
2017-07-26$157,000 131-char remark
Show marketing remark (131 chars)
Beautiful 4 bedroom, 2 bath home. Upgrades with many extras such as granite, stainless appliances, unique light fixtures, and more.
-
2008-12-02soldstatus $19,900
ⓘ Source: listings_history table (triggers on properties + properties_extension) + one-shot
backfill from property_details.listing_events for pre-trigger history.
Tax reassessment forecast GA · Resets to sale price
- Current annual tax
- $1,831 · $153/mo
- Projected year-2 tax
- $2,391 · $199/mo
- Expected delta
- +$561/yr (+$47/mo · 30.6%)
ⓘ Screening estimate from a state-policy table — verify with the county assessor before closing.
Climate risk First Street
- Flood 1/10 Low FEMA zone X (unshaded) · 0% chance over 30 yrs
- Wildfire 4/10 Moderate
- Heat 7/10 Severe 7 d/yr ≥109°F today · 19 d/yr by 30 yrs out
- Wind 8/10 Severe 80% chance of damaging wind over 30 yrs
- Air quality 2/10 Low 2 unhealthy d/yr today · 2 by 30 yrs out
Nearby sold comps map
Loading sold comps map…
Walkable amenities ~0.75 mi
Loading nearby amenities…
Taxation est. · year 1
- Rental income
- $24,288
- − Mortgage interest
- −$14,558
- − Property taxes
- −$1,831
- − Insurance
- −$1,300
- − Repairs & maintenance
- −$1,943
- − Management
- −$1,943
- − Depreciation
- −$7,561
- Taxable loss
- −$4,847
- Est. tax savings @ 24.0%
- +$1,163
- After-tax cash flow
- $866/yr
For passive investors: Depreciation is non-cash, so a rental often shows a tax loss while cash-flowing — sheltering income. Rental losses are passive: they offset passive income freely, and up to $25,000/yr can offset ordinary (W-2) income if you actively participate and your MAGI is under $100k (phasing out to $0 by $150k); unused losses carry forward. On sale, claimed depreciation is recaptured at up to 25%, and gains may owe capital-gains tax (a 1031 exchange can defer both). Figures are a year-1 estimate at your 24.0% rate — not tax advice; consult a CPA.
Schools (NCES district)
- District
- Houston County
- NCES district ID
- 1302880
- Math proficiency
- 43% ▼ -7.00%
- Reading proficiency
- 46% ▼ -2.00%
- Median HH income
- $54,823
- Composite
- 38.68/100
- National rank
- #4144
- State rank
- #23 of 174 in GA
Livability — Perry
- Score
- 68/100
- State rank
- #149
- US rank
- #9757
Category grades
Schools grade is shown separately in the Schools card above.
Census & demographics
- Census place
- Perry, GA
- County
- Houston County · 157,321 people
- City population
- 92,102
- Metro
- Warner Robins, GA
- Population (ZIP)
- 26,872
- Household income
- $45,991
- Rent vs Own
- Severe rent burden
- 1516.0
Population outlook (Houston County) Hauer SSP2
- Today (2025)
- 169,502 people
- By 2030
- 178,486 · +5.3%
- By 2040
- 194,642 · +14.8%
- By 2050
- 207,119 · +22.2%
- By 2075
- 231,480 · +36.6%
- By 2100
- 235,034 · +38.7%
Race, ethnicity, and origin ACS 2023
- Neighborhood character
- Diverse neighborhood (Simpson 0.64)
- Race & ethnicity
- Black 47% White 35% Hispanic / Latino 10% Two or more races 7% Asian 1%
- Hispanic origin (detail)
- Mexican 5%
- Common ancestry
- Iranian 1% Serbian 1% Italian 1%
- Foreign-born
- 6% · Canada, Vietnam, South Korea
- Languages at home
- 91% English-only · Spanish 8%
Political lean MEDSL · Houston
- 2024 margin
- R (+11.3) · D 44.0% · R 55.3%
- 2008→2024 swing
- +8.9pp toward D · 2008: -20.2pp · 2024: -11.3pp
- All cycles
- 2024: R+11.3 2020: R+12.4 2016: R+21.6 2012: R+20.7 2008: R+20.2
Not yet ingested
- Civics
- —
Market trends
- HPI YoY
- ▼ -130.35%
- Current HPI
- 222.1627
- Rent YoY
- ▲ 2.78%
- Metro
- Warner Robins, GA
- State GDP YoY
- ▲ 2.66%
- F500 in state
- 28
Industry mix (Fortune 500 HQ in GA)
| Industry | F500 HQs | Revenue |
|---|---|---|
| Paper / Packaging | 2 | $29B |
|
||
| Retail | 1 | $160B |
|
||
| Transportation / Logistics | 1 | $91B |
|
||
| Airlines | 1 | $62B |
|
||
| Consumer Goods | 1 | $47B |
|
||
| Utilities | 1 | $25B |
|
||
Price history
+1206.0% since first listed5 events — show timeline
- 2026-05-15 Listed $259,900 CGMLS
- 2017-10-20 Sold (MLS) $157,000 CGMLS
- 2017-10-20 Sold (MLS) $157,000 GAMLS
- 2017-07-26 Listed $157,000 CGMLS
- 2008-12-02 Sold (Public Records) $19,900 Public Records
Property tax history
+34.5%/yrLatest (2025): $1,831 · +9.7% YoY. Source: county tax records.
Cash-flow waterfall
monthlySold comps — $/sqft
last 12 mo · ≤1 miLoading sold comps…