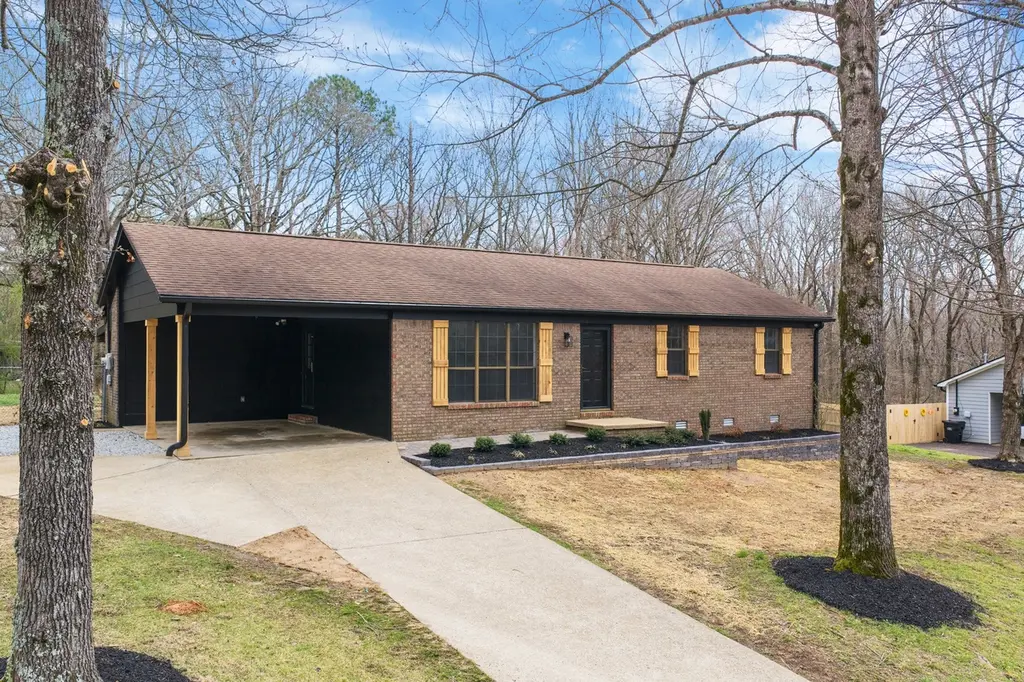
605 Parkburg Rd · Jackson, TN
Flood risk 1/10 · Minimal
- FEMA flood zone
- X (unshaded)
- Chance of flooding over 30 yrs
- 0.0%
- Est. flood insurance / yr
- $507 – $1,088
Fire risk 3/10 · Minor
- Est. fire insurance / yr
- $949 – $1,763
Heat risk 6/10 · Moderate
- Hot days now (above 109°F)
- 7 days/yr
- Hot days in 30 yrs
- 21 days/yr
Wind risk 4/10 · Minor
- Chance of severe wind over 30 yrs
- 13.0%
Air-quality risk 1/10 · Minimal
- Unhealthy air days now
- 0 days/yr
- Unhealthy air days in 30 yrs
- 0 days/yr
Risk factors via First Street. Map © Google.
Why this score? — see what drove the D grade
The composite is a weighted blend of 9 inputs, each scored 0–100. Each bar is that input's sub-score; the figure is the points it added to the 100-point composite (weight × sub-score).
- Cash flow +14.9/30.0
- Appreciation +10.0/10.0
- DSCR +4.6/10.0
- Livability +3.1/5.0
- 1% rule +2.8/10.0
- Rent growth +2.5/5.0
- Condition / age +2.5/5.0
- Schools +1.2/10.0
- ARV discount +0.7/15.0
$244,900
🖨 Deal sheet 📄 Offer letter ✓ Due diligence
Listing remarks MLS
Want country living just minutes from city conveniences? THIS IS IT! Adorable 3 bedroom, 2 bath home features an open floor plan, updated interior and no carpet! Perfect for a first time home buyer or anyone looking to downsize. Home features laminate hardwood, large fenced in back yard and an back patio perfect for relaxing on a warm summer night. Storage shed and refrigerator stay! This is what move in ready looks like! Welcome home!
Key facts
- New landscaping
- Covered back patio
- Paver sidewalk
Tags
Property features AI
Finance
- HOA & community: Near a golf course
Exterior
- Parking: 6 parking spaces total; 1 carport space; 2 open parking spaces; Circular driveway; Gravel parking pad / open parking
- Security: Smoke detector(s)
- Utilities: Public water; Septic tank; Electricity connected
- Home design: Single-family residence; One story
- Construction: Block foundation
- Exterior features: Rain gutters; Covered patio; Chain link backyard fence; Shed(s)
Interior
- Kitchen: Dishwasher; Electric range; Microwave
- Bedrooms: 3 bedrooms on the main level
- Flooring: Ceramic tile; Laminate
- Bathrooms: 2 full bathrooms (both on the main level)
- Heating & cooling: Central heating; Central electric air; Ceiling fan(s)
- Interior features: Beamed ceilings; Ceiling fan(s); Kitchen island; Laminate countertops; Fireplace in the great room (and additional fireplace area)
- Laundry & utility: Laundry room with washer and electric dryer hookups; Electric water heater
Neighborhood map
What this means for you Summary
Snapshot
- This is a 3-bed/2.0-bath single-family listed at $245k.
Deal economics
- At list price, monthly cash flow is $73 ($877/yr) — positive.
- The deal already cash-flows at list — no discount required.
- To meet the 1% rule (rent ≥ 1% of price), the offer needs to be $191k (22.2% below list).
- Recommended offer: $191k (22.2% below list) — sets the bar for 1% rule.
- Cap rate 6.7% vs local median 3.5% in Jackson — top-decile yield for the area; either an underpriced asset or a hidden risk that comps aren't pricing in. Stress-test before assuming the spread holds.
Location & tenants
- Location reads 62/100 on livability (#216 in TN) — a middle-class / working-renter tenant base. Strengths: cost of living A+, housing A+; Watch: health & safety C-, schools F, crime F.
- Madison County (urban): math 10% / reading 17% proficiency, ranked #131 of 139 in TN (top 94%) — low school quality limits family demand, transient renter base, plan for 1-2y turnover; 68% free/reduced lunch — lower-income household profile, screen leases tightly.
- Market conditions: 26 active listings in the ZIP; 247 units permitted in Madison County in 2024 (0 in 5+ unit buildings).
Forward outlook
- In year one you build about $26k of equity ($2k loan paydown + $24k appreciation (10.0% local appreciation)).
- Madison County population projected at -12% by 2050 — secular population decline; favor cash flow + early exit over multi-decade hold.
- At projected returns (10.0% appreciation + 3.0% rent growth), your $69k cash investment doubles in ~3 years — after that, you're playing with house money.
- By year 2, paydown + projected appreciation supports a ~$42k cash-out refi (75% LTV) — recoverable capital for the next deal without selling this one.
Negotiation context
- Only 11 days on market — expect competitive offers; lowballing is unlikely to land.
- 2 sale attempts since 5y ago with the ask held roughly flat each time — persistent listings suggest the price (not the market) is what's stuck; bring a comps-based counter.
- Current owner paid $150k; list at $245k implies a 63% gain — meaningful room to come down on a strong offer.
Risks & watch-outs
- Climate carrying-cost: extreme-heat days projected 7→21/yr by 2055 (HVAC capex compounding) — expect insurance premiums to compound above CPI over the hold.
Questions for the listing agent
- Is there a deadline driving the sale (1031 exchange, divorce, estate, relocation)? That informs how much negotiation room exists.
- Schools are F-rated, which usually means shorter tenancies and higher turnover. Who's the typical renter profile here, and what's been the actual vacancy rate?
- Crime grade is F in this area — have there been break-ins, vandalism, or insurance claims at this property in the last 3 years? What carrier currently insures it and at what premium?
- The area grade is low — what's the realistic commute time and amenity access for the typical tenant pool here? Any planned neighborhood developments (good or bad) we should know about?
- What's the average days-on-market for RENTAL listings here right now (not sales)? A rising rental-DOM trend means longer vacancies and softer asking-rent achievability than the comps imply.
- What's the recent tenant-quality profile in this submarket — average credit score on applications, eviction rate, late-payment / NSF rate, and stable-employment percentage? A property-management company in the area should have these aggregated.
- How much new for-sale + rental construction is in the pipeline within 1–3 miles? Heavy new supply typically softens prices + rents 12–24 months out; constrained supply supports both.
Investment metrics
- 1% rule
- 0.78% ✗
- Cap rate
- 6.65%
- Cash-on-cash
- 1.28%
- DSCR
- 1.06
- GRM
- 10.7
CMA / ARV
- ARV (on-the-fly)
- $212,724
- Comps found
- 3
Show comp detail 3 sales within ~0.75 mi
| Address | Dist | Beds/Ba | Sqft | Sold | Price | $/sf | Match |
|---|---|---|---|---|---|---|---|
| 609 Parkburg Rd | 0.02mi | 3/2.0 | 1,244 (0%) | 8mo | $242,900 | $195 | 92 |
| 9 Roy Davis Rd | 0.05mi | 2/1.0 (-1) | 1,069 (-14%) | 19mo | $154,500 | $145 | 49 |
| 526 Parkburg Rd | 0.45mi | 3/2.0 | 1,389 (+12%) | 24mo | $238,000 | $171 | 40 |
Match score weights: distance 35% · size 25% · config 20% · recency 20%. Top-matched comps best support the ARV.
Projected returns pro-forma
10.0% appreciation · 3.0% rent growth · sell at horizon
- IRR
- 25.2%
- Equity multiple
- 3.01×
- Total profit
- $137,902
- Equity at exit
- $220,625
- IRR
- 22.2%
- Equity multiple
- 6.87×
- Total profit
- $402,178
- Equity at exit
- $475,787
Cash invested: $68,572 (down + closing). Projections, not guarantees.
Landlord ↔ Tenant lean methodology
- Overall (STATE)
- 87 Strongly Landlord-Friendly
- State Tennessee
- 87 Strongly Landlord-Friendly · R+13
- County
- — inherits STATE
- City
- — inherits STATE
ZIP-level market 38366
- Home prices YoY
- 4.4%
- Active inventory
- 26
- Price-to-rent
- 10.7×
Monthly cashflow live
- Estimated rent
- $1,906 medium interval (Pro) →
- Mortgage (P&I)
- −$1,284
- Tax from tax record
- −$46 /mo · $553/yr
- Insurance
- −$102
- HOA
- −$0
- Vacancy / Maint / Mgmt
- −$400
- Net cashflow
- $73
Break-even live
UW: 25.0% down · 7.5% · 30yr · 1.5% tax · 5.0% vac · 8.0% maint · 8.0% mgmt
Financing live
Cash to close
- Down payment
- $61,225
- Closing costs
- $7,347
- Reserves months
- —
- Total cash needed
- —
Loan-product check · same deal, 3 products live
Conventional
25% down · 7.5% · 30yr
- Down + closing
- —
- Monthly P&I
- —
- Monthly cashflow
- —
- DSCR
- —
- Eligible?
- —
Personal DTI + credit; lowest rate.
DSCR
20% down · 8.5% · 30yr
- Down + closing
- —
- Monthly P&I
- —
- Monthly cashflow
- —
- DSCR
- —
- Eligible?
- —
No personal income docs; deal must DSCR.
Hard money
10% down · 12.0% · 12mo
- Down + closing
- —
- Monthly P&I
- —
- Monthly cashflow
- —
- DSCR
- —
- Eligible?
- —
Short-term bridge; refi at stabilization.
Listing history 26 events
-
2026-06-19days on market $244,900 Active 11 DOM
-
2026-06-18days on market $244,900 Active 10 DOM
-
2026-06-17days on market $244,900 Active 9 DOM
-
2026-06-16days on market $244,900 Active 8 DOM
-
2026-06-15days on market $244,900 Active 7 DOM
-
2026-06-14days on market $244,900 Active 5 DOM
-
2026-06-13days on market $244,900 Active 4 DOM
-
2026-06-10days on market $244,900 Active 2 DOM
-
2026-06-09pricedays on market $244,900 Active 1 DOM
-
2026-06-08days on market $249,900 Active 89 DOM
-
2026-06-07days on market $249,900 Active 88 DOM
-
2026-06-05days on market $249,900 Active 85 DOM
-
2026-06-03days on market $249,900 Active 84 DOM
-
2026-06-02days on market $249,900 Active 83 DOM
-
2026-06-01days on market $249,900 Active 82 DOM
-
2026-05-31days on market $249,900 Active 81 DOM
-
2026-05-30days on market $249,900 Active 80 DOM
-
2026-03-11$249,900 Active
-
2025-11-08price $199,900
-
2025-09-01price $209,000
-
2021-05-04soldstatus $150,000
-
2021-04-30soldstatus $150,000 439-char remark
Show marketing remark (439 chars)
Want country living just minutes from city conveniences? THIS IS IT! Adorable 3 bedroom, 2 bath home features an open floor plan, updated interior and no carpet! Perfect for a first time home buyer or anyone looking to downsize. Home features laminate hardwood, large fenced in back yard and an back patio perfect for relaxing on a warm summer night. Storage shed and refrigerator stay! This is what move in ready looks like! Welcome home!
-
2021-03-12$150,000 439-char remark
Show marketing remark (439 chars)
Want country living just minutes from city conveniences? THIS IS IT! Adorable 3 bedroom, 2 bath home features an open floor plan, updated interior and no carpet! Perfect for a first time home buyer or anyone looking to downsize. Home features laminate hardwood, large fenced in back yard and an back patio perfect for relaxing on a warm summer night. Storage shed and refrigerator stay! This is what move in ready looks like! Welcome home!
-
2019-07-17soldstatus $95,000
-
2006-10-05soldstatus $83,000
-
2003-08-18soldstatus $87,500
ⓘ Source: listings_history table (triggers on properties + properties_extension) + one-shot
backfill from property_details.listing_events for pre-trigger history.
Tax reassessment forecast TN · Resets to sale price
- Current annual tax
- $553 · $46/mo
- Projected year-2 tax
- $1,739 · $145/mo
- Expected delta
- +$1,186/yr (+$99/mo · 214.4%)
ⓘ Screening estimate from a state-policy table — verify with the county assessor before closing.
Climate risk First Street
- Flood 1/10 Low FEMA zone X (unshaded) · 0% chance over 30 yrs
- Wildfire 3/10 Moderate
- Heat 6/10 Major 7 d/yr ≥109°F today · 21 d/yr by 30 yrs out
- Wind 4/10 Moderate 13% chance of damaging wind over 30 yrs
- Air quality 1/10 Low 0 unhealthy d/yr today · 0 by 30 yrs out
Nearby sold comps map
Loading sold comps map…
Walkable amenities ~0.75 mi
Loading nearby amenities…
Taxation est. · year 1
- Rental income
- $22,868
- − Mortgage interest
- −$13,718
- − Property taxes
- −$553
- − Insurance
- −$1,224
- − Repairs & maintenance
- −$1,829
- − Management
- −$1,829
- − Depreciation
- −$7,124
- Taxable loss
- −$3,411
- Est. tax savings @ 24.0%
- +$819
- After-tax cash flow
- $1,695/yr
For passive investors: Depreciation is non-cash, so a rental often shows a tax loss while cash-flowing — sheltering income. Rental losses are passive: they offset passive income freely, and up to $25,000/yr can offset ordinary (W-2) income if you actively participate and your MAGI is under $100k (phasing out to $0 by $150k); unused losses carry forward. On sale, claimed depreciation is recaptured at up to 25%, and gains may owe capital-gains tax (a 1031 exchange can defer both). Figures are a year-1 estimate at your 24.0% rate — not tax advice; consult a CPA.
Schools (NCES district)
- District
- Madison County
- NCES district ID
- 4702580
- Math proficiency
- 10% ▼ -11.00%
- Reading proficiency
- 17% ▼ -4.00%
- Median HH income
- $42,015
- Composite
- 11.74/100
- National rank
- #9687
- State rank
- #131 of 139 in TN
Livability — Jackson
- Score
- 62/100
- State rank
- #216
- US rank
- #16488
Category grades
Schools grade is shown separately in the Schools card above.
Census & demographics
- City population
- 87,024
- Population (ZIP)
- 2,386
Population outlook (Madison County) Hauer SSP2
- Today (2025)
- 95,952 people
- By 2030
- 94,264 · -1.8%
- By 2040
- 89,607 · -6.6%
- By 2050
- 84,133 · -12.3%
- By 2075
- 72,215 · -24.7%
- By 2100
- 62,062 · -35.3%
Race, ethnicity, and origin ACS 2023
- Neighborhood character
- Predominantly White (86%)
- Race & ethnicity
- White 86% Two or more races 5% Hispanic / Latino 5% Black 4%
- Common ancestry
- Serbian 4% Portuguese 1% Slovak 1%
- Foreign-born
- 1% · Canada
- Languages at home
- 97% English-only · Spanish 3%
Political lean MEDSL · Madison
- 2024 margin
- R (+18.2) · D 40.3% · R 58.5% · Other 1.2%
- 2008→2024 swing
- +3.4pp toward D · 2008: -21.6pp · 2024: -18.2pp
- All cycles
- 2024: R+18.2 2020: R+12.9 2016: R+15.6 2012: R+8.9 2008: R+21.6
Not yet ingested
- Civics
- —
Market trends
- HPI YoY
- ▲ 10.09%
- Current HPI
- 241.1757
- Rent YoY
- —
- Metro
- —
- State GDP YoY
- ▲ 2.78%
- F500 in state
- 22
Industry mix (Fortune 500 HQ in TN)
| Industry | F500 HQs | Revenue |
|---|---|---|
| Healthcare | 3 | $91B |
|
||
| Retail | 3 | $72B |
|
||
| Transportation / Logistics | 1 | $88B |
|
||
| Paper / Packaging | 1 | $19B |
|
||
| Insurance | 1 | $13B |
|
||
| Energy | 1 | $12B |
|
||
Price history
+185.6% since first listed9 events — show timeline
- 2026-03-11 Listed $249,900 CWTAR
- 2025-11-08 Price Changed $199,900 CWTAR
- 2025-09-01 Price Changed $209,000 CWTAR
- 2021-05-04 Sold (Public Records) $150,000 Public Records
- 2021-04-30 Sold (MLS) $150,000 CWTAR
- 2021-03-12 Listed $150,000 CWTAR
- 2019-07-17 Sold (Public Records) $95,000 Public Records
- 2006-10-05 Sold (Public Records) $83,000 Public Records
- 2003-08-18 Sold (Public Records) $87,500 Public Records
Property tax history
+6.7%/yrLatest (2025): $553 · +0.0% YoY. Source: county tax records.
Cash-flow waterfall
monthlySold comps — $/sqft
last 12 mo · ≤1 miLoading sold comps…