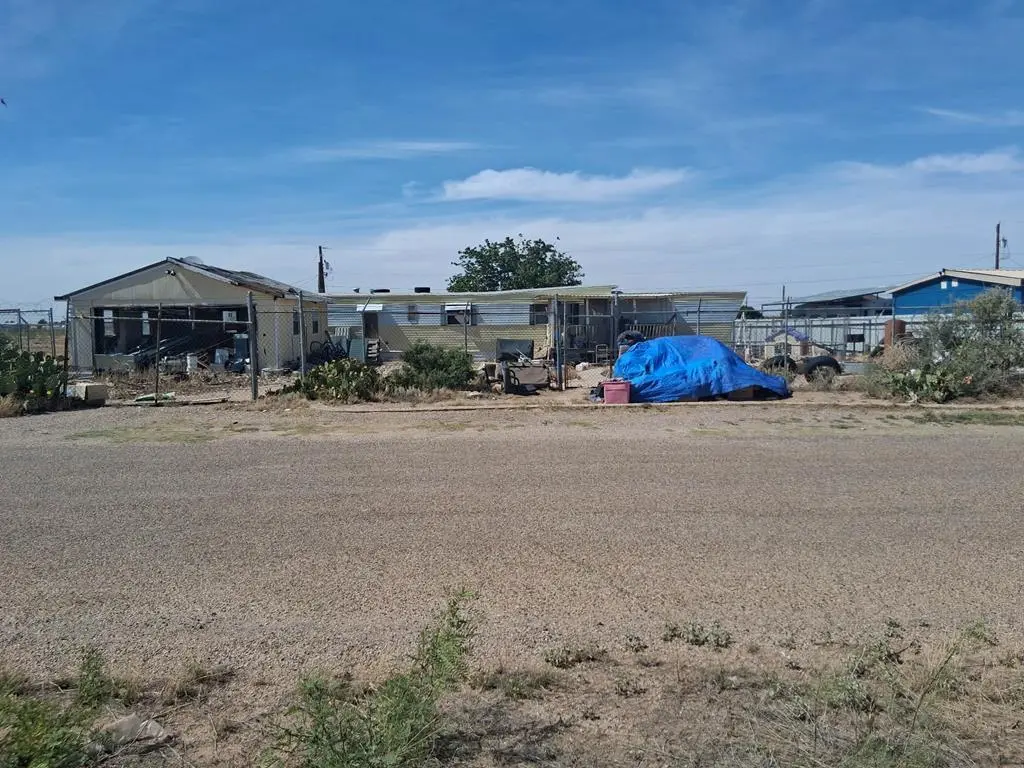
12908 W Treva Dr · West Odessa, TX
Flood risk 1/10 · Minimal
- FEMA flood zone
- X (unshaded)
- Chance of flooding over 30 yrs
- 0.0%
- Est. flood insurance / yr
- $507 – $1,088
Fire risk 7/10 · Major
- Est. fire insurance / yr
- $1,222 – $2,270
Heat risk 6/10 · Moderate
- Hot days now (above 102°F)
- 7 days/yr
- Hot days in 30 yrs
- 21 days/yr
Wind risk 2/10 · Minimal
- Chance of severe wind over 30 yrs
- 3.0%
Air-quality risk 1/10 · Minimal
- Unhealthy air days now
- 0 days/yr
- Unhealthy air days in 30 yrs
- 0 days/yr
Risk factors via First Street. Map © Google.
Why this score? — see what drove the B- grade
The composite is a weighted blend of 9 inputs, each scored 0–100. Each bar is that input's sub-score; the figure is the points it added to the 100-point composite (weight × sub-score).
- Cash flow +30.0/30.0
- 1% rule +10.0/10.0
- DSCR +10.0/10.0
- ARV discount +7.5/15.0
- Livability +3.1/5.0
- Rent growth +2.5/5.0
- Condition / age +2.5/5.0
- Schools +2.2/10.0
- Appreciation +0.0/10.0
$49,900
🖨 Deal sheet 📄 Offer letter ✓ Due diligence
Listing remarks
Great investment opportunity on this home! Call today before its gone!
Key facts
- 0.4 acre lot
- 2 garage spots
- Built 1980
Property features AI
Finance
- Other: Property sits on approximately 0.399 acre
Exterior
- Parking: Detached garage; 2 covered parking spaces; 2 total garage spaces; Circular driveway; Open parking available
- Utilities: Well water; Septic tank sewer; Propane utilities
- Home design: Residential single-family home; Single wide mobile-home body type
- Construction: Aluminum siding; Metal roof; Other foundation
- Exterior features: Covered patio; Landscaped lot; Paved road access; Solar energy
Interior
- Kitchen: No appliances listed
- Flooring: Hardwood flooring; Other flooring
- Bathrooms: 1 full bathroom
- Heating & cooling: Window unit cooling; No heating system listed
- Interior features: Water heater included; No fireplace
Neighborhood map
What this means for you Summary
Snapshot
- This is a 2-bed/1.0-bath manufactured listed at $50k.
Deal economics
- At list price, monthly cash flow is $1k ($12k/yr) — positive.
- The deal already cash-flows at list — no discount required.
- Meets the 1% rule at list price ($2k rent vs $50k).
- Recommended offer: $48k (3.0% below list) — sets the bar for market timing.
Location & tenants
- Location reads 61/100 on livability (#1,026 in TX) — a middle-class / working-renter tenant base. Strengths: cost of living A+, housing A+; Watch: health & safety C-, crime F, amenities F.
- Ector County ISD (urban): math 22% / reading 27% proficiency, ranked #707 of 826 in TX (top 86%) — low school quality limits family demand, transient renter base, plan for 1-2y turnover.
- Zoned schools: Murry Fly El (math 28% / reading 23%, grade F, #2,982 of 4,322 statewide, top 70%, 998 students, 81% FRL); Crockett Middle (math 21% / reading 19%, grade F, #1,428 of 1,662 statewide, top 87%, 1,036 students, 66% FRL); Odessa H S (math 18% / reading 22%, grade F, #1,397 of 1,632 statewide, top 87%, 3,874 students, 68% FRL) — zoned schools average 72% FRL vs 56% district-wide (16 pts higher); higher-poverty schools than district average — tighter screening recommended.
- Market conditions: 107 active listings in the ZIP; 1,004 units permitted in Ector County in 2024 (0 in 5+ unit buildings).
Forward outlook
- Local home prices are declining (-3.0%/yr); year-one equity from $345 of loan paydown is wiped out by about $1k of value loss. Plan a longer hold.
- Ector County population projected at +78% by 2050 — long-run rental-demand tailwind backs the buy-and-hold thesis.
- At projected returns (-3.0% appreciation + 3.0% rent growth), your $14k cash investment doubles in ~2 years — after that, you're playing with house money.
Negotiation context
- It's been on market 57 days — a 3% lower offer ($48k) is reasonable based on typical stale-listing flexibility.
Risks & watch-outs
- Climate carrying-cost: major wildfire risk; extreme-heat days projected 7→21/yr by 2055 (HVAC capex compounding) — expect insurance premiums to compound above CPI over the hold.
Questions for the listing agent
- It's been on market 57 days. Have you received any prior offers? Is the seller open to a 3% concession, seller financing, or rate buy-down credit?
- Is there a deadline driving the sale (1031 exchange, divorce, estate, relocation)? That informs how much negotiation room exists.
- Schools are F-rated, which usually means shorter tenancies and higher turnover. Who's the typical renter profile here, and what's been the actual vacancy rate?
- Crime grade is F in this area — have there been break-ins, vandalism, or insurance claims at this property in the last 3 years? What carrier currently insures it and at what premium?
- What's the average days-on-market for RENTAL listings here right now (not sales)? A rising rental-DOM trend means longer vacancies and softer asking-rent achievability than the comps imply.
- What's the recent tenant-quality profile in this submarket — average credit score on applications, eviction rate, late-payment / NSF rate, and stable-employment percentage? A property-management company in the area should have these aggregated.
- How much new for-sale + rental construction is in the pipeline within 1–3 miles? Heavy new supply typically softens prices + rents 12–24 months out; constrained supply supports both.
Investment metrics
- 1% rule
- 3.34% ✓
- Cap rate
- 30.51%
- Cash-on-cash
- 86.48%
- DSCR
- 4.85
- GRM
- 2.5
CMA / ARV
No comps found within radius.
Projected returns pro-forma
-3.0% appreciation · 3.0% rent growth · sell at horizon
- IRR
- 87.0%
- Equity multiple
- 5.01×
- Total profit
- $56,046
- Equity at exit
- $7,440
- IRR
- 90.1%
- Equity multiple
- 10.40×
- Total profit
- $131,396
- Equity at exit
- $4,314
Cash invested: $13,972 (down + closing). Projections, not guarantees.
Landlord ↔ Tenant lean methodology
- Overall (STATE)
- 87 Strongly Landlord-Friendly
- State Texas
- 87 Strongly Landlord-Friendly · R+5
- County
- — inherits STATE
- City
- — inherits STATE
ZIP-level market 79764
- Home prices YoY
- -28.0%
- Active inventory
- 107
- Price-to-rent
- 2.5×
Monthly cashflow live
- Estimated rent
- $1,668 medium interval (Pro) →
- Mortgage (P&I)
- −$262
- Tax from tax record
- −$28 /mo · $342/yr
- Insurance
- −$21
- HOA
- −$0
- Vacancy / Maint / Mgmt
- −$350
- Net cashflow
- $1,007
Break-even live
UW: 25.0% down · 7.5% · 30yr · 1.5% tax · 5.0% vac · 8.0% maint · 8.0% mgmt
Financing live
Cash to close
- Down payment
- $12,475
- Closing costs
- $1,497
- Reserves months
- —
- Total cash needed
- —
Loan-product check · same deal, 3 products live
Conventional
25% down · 7.5% · 30yr
- Down + closing
- —
- Monthly P&I
- —
- Monthly cashflow
- —
- DSCR
- —
- Eligible?
- —
Personal DTI + credit; lowest rate.
DSCR
20% down · 8.5% · 30yr
- Down + closing
- —
- Monthly P&I
- —
- Monthly cashflow
- —
- DSCR
- —
- Eligible?
- —
No personal income docs; deal must DSCR.
Hard money
10% down · 12.0% · 12mo
- Down + closing
- —
- Monthly P&I
- —
- Monthly cashflow
- —
- DSCR
- —
- Eligible?
- —
Short-term bridge; refi at stabilization.
Listing history 17 events
-
2026-06-19days on market $49,900 Active 57 DOM
-
2026-06-18days on market $49,900 Active 56 DOM
-
2026-06-17days on market $49,900 Active 55 DOM
-
2026-06-16days on market $49,900 Active 54 DOM
-
2026-06-15days on market $49,900 Active 53 DOM
-
2026-06-14days on market $49,900 Active 51 DOM
-
2026-06-13days on market $49,900 Active 50 DOM
-
2026-06-10days on market $49,900 Active 48 DOM
-
2026-06-09days on market $49,900 Active 47 DOM
-
2026-06-08days on market $49,900 Active 46 DOM
-
2026-06-07days on market $49,900 Active 45 DOM
-
2026-06-03days on market $49,900 Active 40 DOM
-
2026-06-01days on market $49,900 Active 39 DOM
-
2026-05-31days on market $49,900 Active 38 DOM
-
2026-05-30days on market $49,900 Active 37 DOM
-
2026-04-24$55,000 Active 70-char remark
-
1997-11-01soldstatus
ⓘ Source: listings_history table (triggers on properties + properties_extension) + one-shot
backfill from property_details.listing_events for pre-trigger history.
Tax reassessment forecast TX · Resets to sale price
- Current annual tax
- $342 · $28/mo
- Projected year-2 tax
- $913 · $76/mo
- Expected delta
- +$571/yr (+$48/mo · 167.2%)
ⓘ Screening estimate from a state-policy table — verify with the county assessor before closing.
Climate risk First Street
- Flood 1/10 Low FEMA zone X (unshaded) · 0% chance over 30 yrs
- Wildfire 7/10 Severe
- Heat 6/10 Major 7 d/yr ≥102°F today · 21 d/yr by 30 yrs out
- Wind 2/10 Low 3% chance of damaging wind over 30 yrs
- Air quality 1/10 Low 0 unhealthy d/yr today · 0 by 30 yrs out
Nearby sold comps map
Loading sold comps map…
Walkable amenities ~0.75 mi
Loading nearby amenities…
Taxation est. · year 1
- Rental income
- $20,017
- − Mortgage interest
- −$2,795
- − Property taxes
- −$342
- − Insurance
- −$250
- − Repairs & maintenance
- −$1,601
- − Management
- −$1,601
- − Depreciation
- −$1,452
- Taxable income
- $11,977
- Est. tax owed @ 24.0%
- −$2,874
- After-tax cash flow
- $9,208/yr
For passive investors: Depreciation is non-cash, so a rental often shows a tax loss while cash-flowing — sheltering income. Rental losses are passive: they offset passive income freely, and up to $25,000/yr can offset ordinary (W-2) income if you actively participate and your MAGI is under $100k (phasing out to $0 by $150k); unused losses carry forward. On sale, claimed depreciation is recaptured at up to 25%, and gains may owe capital-gains tax (a 1031 exchange can defer both). Figures are a year-1 estimate at your 24.0% rate — not tax advice; consult a CPA.
Schools (NCES district)
- District
- Ector County ISD
- NCES district ID
- 4818000
- Math proficiency
- 22% ▼ -9.00%
- Reading proficiency
- 27% ▼ -4.00%
- Median HH income
- $52,740
- Composite
- 21.89/100
- National rank
- #8233
- State rank
- #707 of 826 in TX
Livability — West Odessa
- Score
- 61/100
- State rank
- #1026
- US rank
- #18223
Category grades
Schools grade is shown separately in the Schools card above.
Census & demographics
- Census place
- West Odessa, TX
- City population
- 61,683
- Population (ZIP)
- 26,805
Population outlook (Ector County) Hauer SSP2
- Today (2025)
- 212,765 people
- By 2030
- 241,962 · +13.7%
- By 2040
- 306,582 · +44.1%
- By 2050
- 379,755 · +78.5%
- By 2075
- 568,991 · +167.4%
- By 2100
- 709,829 · +233.6%
Race, ethnicity, and origin ACS 2023
- Neighborhood character
- Majority Hispanic (59%)
- Race & ethnicity
- Hispanic / Latino 59% White 37% Two or more races 17% Black 3% Asian 1%
- Hispanic origin (detail)
- Mexican 54%
- Common ancestry
- Slovak 1%
- Foreign-born
- 20% · Canada, Vietnam
- Languages at home
- 54% English-only · Spanish 45% Vietnamese 1%
Political lean MEDSL · Ector
- 2024 margin
- Solid R (+52.9) · D 23.2% · R 76.1%
- 2008→2024 swing
- -4.9pp toward R · 2008: -48.0pp · 2024: -52.9pp
- All cycles
- 2024: R+52.9 2020: R+47.8 2016: R+40.6 2012: R+48.9 2008: R+48.0
Not yet ingested
- Civics
- —
Market trends
- HPI YoY
- ▼ -92.67%
- Current HPI
- 238.7065
- Rent YoY
- —
- Metro
- —
- State GDP YoY
- ▲ 3.95%
- F500 in state
- 110
Industry mix (Fortune 500 HQ in TX)
| Industry | F500 HQs | Revenue |
|---|---|---|
| Energy | 16 | $1,198B |
|
||
| Technology | 5 | $198B |
|
||
| Engineering / Construction | 4 | $72B |
|
||
| Energy Services | 3 | $60B |
|
||
| Utilities | 3 | $41B |
|
||
| Healthcare | 2 | $330B |
|
||
Price history
-9.3% since first listed3 events — show timeline
- 2026-05-24 Price Changed $49,900 ODMLS
- 2026-04-24 Listed $55,000 ODMLS
- 1997-11-01 Sold (Public Records) — Public Records
Property tax history
-6.2%/yrLatest (2025): $342 · +34.3% YoY. Source: county tax records.
Cash-flow waterfall
monthlySold comps — $/sqft
last 12 mo · ≤1 miLoading sold comps…