 Multi-family
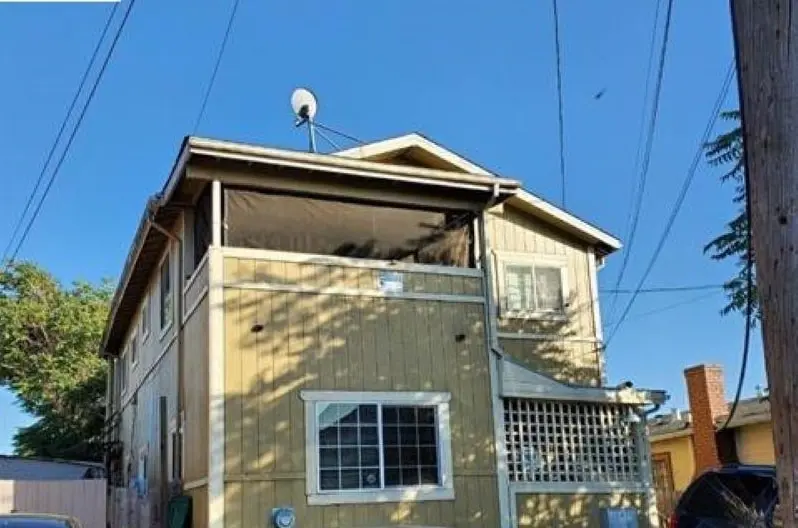
2714 79th Ave · Oakland, CA
Flood risk 1/10 · Minimal
- FEMA flood zone
- X (unshaded)
- Chance of flooding over 30 yrs
- 0.0%
- Est. flood insurance / yr
- $507 – $1,088
Fire risk 3/10 · Minor
- Est. fire insurance / yr
- $659 – $1,223
Heat risk 4/10 · Minor
- Hot days now (above 84°F)
- 7 days/yr
- Hot days in 30 yrs
- 15 days/yr
Wind risk 1/10 · Minimal
- Chance of severe wind over 30 yrs
- —
Air-quality risk 8/10 · Major
- Unhealthy air days now
- 14 days/yr
- Unhealthy air days in 30 yrs
- 14 days/yr
Risk factors via First Street. Map © Google.
Why this score? — see what drove the B- grade
The composite is a weighted blend of 9 inputs, each scored 0–100. Each bar is that input's sub-score; the figure is the points it added to the 100-point composite (weight × sub-score).
- Cash flow +26.6/30.0
- ARV discount +15.0/15.0
- DSCR +9.1/10.0
- 1% rule +6.4/10.0
- Livability +3.6/5.0
- Schools +3.0/10.0
- Rent growth +2.7/5.0
- Condition / age +2.5/5.0
- Appreciation +0.0/10.0
$745,000
🖨 Deal sheet (PDF) 📄 Offer letter ✓ Due diligence
Multi-family units
County records classify this as Multi-Family (2-4 Unit). Listing-text estimate: 1 unit. estimate disagrees with records
Listing remarks MLS
Great Investment Opportunity with Strong Rent Upside! Well-maintained triplex located on a quiet cul-de-sac surrounded primarily by single-family residences. All units feature separate entrances, offering privacy and strong tenant appeal. The front building is a duplex with Unit A (lower) and Unit B (upper). The rear building is a two-story standalone structure comprising Unit C, complete with a private yard. Each unit includes off-street parking (one space per unit).
Key facts
- Quiet cul-de-sac
- Private yard
- Separate entrances
Tags
Neighborhood map
What this means for you Summary
Snapshot
- This is a 7-bed/4.0-bath multifamily listed at $745k.
Deal economics
- At list price, monthly cash flow is $2k ($24k/yr) — positive.
- The deal already cash-flows at list — no discount required.
- Meets the 1% rule at list price ($9k rent vs $745k).
- Recommended offer: $656k (12.0% below list) — sets the bar for market timing.
- Cap rate 9.5% vs local median 2.5% in Oakland — top-decile yield for the area; either an underpriced asset or a hidden risk that comps aren't pricing in. Stress-test before assuming the spread holds.
Location & tenants
- Location reads 71/100 on livability (#224 in CA) — a middle-class / working-renter tenant base. Strengths: amenities A+, commute A+, employment A+; Watch: crime F, cost of living F.
- Oakland Unified (urban): math 27% / reading 33% proficiency, ranked #1,007 of 1,400 in CA (top 72%) — families likely to look elsewhere, expect single-tenant / working-renter base with shorter leases; 68% free/reduced lunch — lower-income household profile, screen leases tightly.
- Zoned schools: Melrose Leadership Academy (656 students, 47% FRL); Frick United Academy of Language Middle (334 students, 98% FRL); Castlemont High (680 students, 98% FRL).
- Market conditions: Rents flat; 187 active listings in the ZIP; solid renter incomes; 1,742 units permitted in Alameda County in 2024 (856 in 5+ unit buildings).
- At $8,510/mo this rent would consume 96% of the median local household income ($106k/yr) (locally 2086% of renters already pay >50% of income on rent) — very limited rent-growth headroom before tenants either downsize or default.
Forward outlook
- Local home prices are declining (-3.0%/yr); year-one equity from $5k of loan paydown is wiped out by about $22k of value loss. Plan a longer hold.
- Alameda County population projected at +34% by 2050 — long-run rental-demand tailwind backs the buy-and-hold thesis.
Negotiation context
- It's been on market 159 days — a 12% lower offer ($656k) is reasonable based on typical stale-listing flexibility.
- 9 sale attempts since 23y ago with the ask held roughly flat each time — persistent listings suggest the price (not the market) is what's stuck; bring a comps-based counter.
- Current owner paid $178k; list at $745k implies a 320% gain — meaningful room to come down on a strong offer.
Risks & watch-outs
- Watch-outs: built in 1925 — expect roof / HVAC / electrical / plumbing capex.
Questions for the listing agent
- It's been on market 159 days. Have you received any prior offers? Is the seller open to a 12% concession, seller financing, or rate buy-down credit?
- Built in 1925 — when were the roof, HVAC, electrical panel, plumbing, and water heater last replaced?
- Why hasn't it sold? Are there any deal-killer items the seller is aware of (foundation, flood, title, zoning, code violations)?
- Is there a deadline driving the sale (1031 exchange, divorce, estate, relocation)? That informs how much negotiation room exists.
- Crime grade is F in this area — have there been break-ins, vandalism, or insurance claims at this property in the last 3 years? What carrier currently insures it and at what premium?
- What's the average days-on-market for RENTAL listings here right now (not sales)? A rising rental-DOM trend means longer vacancies and softer asking-rent achievability than the comps imply.
- What's the recent tenant-quality profile in this submarket — average credit score on applications, eviction rate, late-payment / NSF rate, and stable-employment percentage? A property-management company in the area should have these aggregated.
- How much new apartment / multifamily construction is in the pipeline within 1–3 miles? Heavy new supply (>2% of stock underway) typically softens rents 12–24 months out; light construction supports rent growth.
Investment metrics
- 1% rule
- 1.14% ✓
- Cap rate
- 9.50%
- Cash-on-cash
- 11.45%
- DSCR
- 1.51
- GRM
- 7.3
CMA / ARV
- ARV (median comp)
- $911,588
- List price
- $745,000
- Delta
- -18.27%
- Verdict
- UNDERPRICED
- Comps
- 20 within 1.0 mi
Show comp detail 6 sales within ~0.75 mi
| Address | Dist | Beds/Ba | Sqft | Sold | Price | $/sf | Match |
|---|---|---|---|---|---|---|---|
| 6931 Macarthur Blvd | 0.53mi | 6/4.0 (-1) | 3,120 (+1%) | 14mo | $825,000 | $264 | 58 |
| 6921 Macarthur Blvd | 0.54mi | 6/4.0 (-1) | 3,120 (+1%) | 14mo | $825,000 | $264 | 57 |
| 2726 73rd Ave | 0.35mi | 6/4.0 (-1) | 2,653 (-14%) | 1mo | $490,000 | $185 | 54 |
| 1749 84th Ave | 0.57mi | 8/4.0 (+1) | 3,456 (+12%) | 8mo | $870,000 | $252 | 43 |
| 8836 Dowling St | 0.66mi | 8/4.0 (+1) | 2,900 (-6%) | 19mo | $885,000 | $305 | 38 |
| 3328 66th Ave | 0.74mi | 8/4.0 (+1) | 3,452 (+11%) | 5mo | $825,000 | $239 | 37 |
Match score weights: distance 35% · size 25% · config 20% · recency 20%. Top-matched comps best support the ARV.
Projected returns pro-forma
-3.0% appreciation · 0.65% rent growth · sell at horizon
- IRR
- -1.8%
- Equity multiple
- 0.93×
- Total profit
- $-13,738
- Equity at exit
- $111,082
- IRR
- 5.3%
- Equity multiple
- 1.35×
- Total profit
- $73,795
- Equity at exit
- $64,414
Cash invested: $208,600 (down + closing). Projections, not guarantees.
Landlord ↔ Tenant lean methodology
- Overall (CITY)
- 0 Strongly Tenant-Friendly
- State California
- 18 Strongly Tenant-Friendly · D+13
- County
- — inherits STATE
- City Oakland
- 0 Strongly Tenant-Friendly · D+62
ZIP-level market 94605
- Rents YoY
- 0.7%
- Active inventory
- 187
- Price-to-rent
- 21.9×
Monthly cashflow live
- Estimated rent
- $8,510 high interval (Pro) →
- Mortgage (P&I)
- −$3,907
- Tax from tax record
- −$515 /mo · $6,182/yr
- Insurance
- −$310
- HOA
- −$0
- Vacancy / Maint / Mgmt
- −$1,787
- Net cashflow
- $1,990
Break-even live
Sensitivity live
| Price | -10% $2,412 | -5% $2,201 | +0% $1,990 | +5% $1,780 | +10% $1,569 |
|---|---|---|---|---|---|
| Rent | -10% $1,318 | -5% $1,654 | +0% $1,990 | +5% $2,327 | +10% $2,663 |
| Rate | -1.0pp $2,366 | -0.5pp $2,180 | base $1,990 | +0.5pp $1,797 | +1.0pp $1,601 |
3-unit breakdown (identical units grouped — click to expand)
| Units | Beds | Baths | Est. rent |
|---|---|---|---|
| 3× units | 3 | 1.5 | $8,511 |
| #1 | 3 | 1.5 | $2,837 |
| #2 | 3 | 1.5 | $2,837 |
| #3 | 3 | 1.5 | $2,837 |
| Total (3 units) | $8,510 | ||
UW: 25.0% down · 7.5% · 30yr · 1.5% tax · 5.0% vac · 8.0% maint · 8.0% mgmt
Financing live
Cash to close
- Down payment
- $186,250
- Closing costs
- $22,350
- Reserves months
- —
- Total cash needed
- —
Loan-product check · same deal, 3 products live
Conventional
25% down · 7.5% · 30yr
- Down + closing
- —
- Monthly P&I
- —
- Monthly cashflow
- —
- DSCR
- —
- Eligible?
- —
Personal DTI + credit; lowest rate.
DSCR
20% down · 8.5% · 30yr
- Down + closing
- —
- Monthly P&I
- —
- Monthly cashflow
- —
- DSCR
- —
- Eligible?
- —
No personal income docs; deal must DSCR.
Hard money
10% down · 12.0% · 12mo
- Down + closing
- —
- Monthly P&I
- —
- Monthly cashflow
- —
- DSCR
- —
- Eligible?
- —
Short-term bridge; refi at stabilization.
Listing history 42 events
-
2026-06-21days on market $745,000 Active 159 DOM
-
2026-06-18days on market $745,000 Active 156 DOM
-
2026-06-17days on market $745,000 Active 155 DOM
-
2026-06-16days on market $745,000 Active 154 DOM
-
2026-06-15days on market $745,000 Active 153 DOM
-
2026-06-13days on market $745,000 Active 151 DOM
-
2026-06-13days on market $745,000 Active 150 DOM
-
2026-06-09days on market $745,000 Active 147 DOM
-
2026-06-08days on market $745,000 Active 146 DOM
-
2026-06-07days on market $745,000 Active 145 DOM
-
2026-06-04remarks 699-char remark
-
2026-06-04days on market $745,000 Active 142 DOM
-
2026-06-03days on market $745,000 Active 141 DOM
-
2026-06-02days on market $745,000 Active 140 DOM
-
2026-06-01days on market $745,000 Active 139 DOM
-
2026-05-31days on market $745,000 Active 138 DOM
-
2026-01-13$745,000 Active 472-char remark
Show marketing remark (472 chars)
Great Investment Opportunity with Strong Rent Upside! Well-maintained triplex located on a quiet cul-de-sac surrounded primarily by single-family residences. All units feature separate entrances, offering privacy and strong tenant appeal. The front building is a duplex with Unit A (lower) and Unit B (upper). The rear building is a two-story standalone structure comprising Unit C, complete with a private yard. Each unit includes off-street parking (one space per unit).
-
2025-05-22historical
-
2025-03-05price
-
2025-02-13Active
-
2024-09-26historical
-
2024-09-18Active
-
2023-11-16historical
-
2023-11-14status Active
-
2023-11-05historical
-
2023-09-29status Active
-
2023-09-27status Pending
-
2023-09-15status Pending
-
2023-08-29price
-
2023-08-25New
-
2022-12-31historical
-
2022-11-04price
-
2022-10-10New
-
2010-12-28soldstatus $177,500 Sold
-
2010-11-29status Pending
-
2010-11-18$204,900 New
-
2003-12-08soldstatus $520,000
-
2003-12-08soldstatus $520,000
-
2003-09-25$540,000
-
1995-09-15soldstatus $163,000
-
1991-04-30soldstatus $201,000
-
1987-11-13soldstatus $50,000
ⓘ Source: listings_history table (triggers on properties + properties_extension) + one-shot
backfill from property_details.listing_events for pre-trigger history.
Tax reassessment forecast CA · Resets to sale price
- Current annual tax
- $6,182 · $515/mo
- Projected year-2 tax
- $6,182 · $515/mo
- Expected delta
- $0/yr ($0/mo · 0.0%)
ⓘ Screening estimate from a state-policy table — verify with the county assessor before closing.
Climate risk First Street
- Flood 1/10 Low FEMA zone X (unshaded) · 0% chance over 30 yrs
- Wildfire 3/10 Moderate
- Heat 4/10 Moderate 7 d/yr ≥84°F today · 15 d/yr by 30 yrs out
- Wind 1/10 Low
- Air quality 8/10 Severe 14 unhealthy d/yr today · 14 by 30 yrs out
Nearby sold comps map
Loading sold comps map…
Walkable amenities ~0.75 mi
Loading nearby amenities…
Taxation est. · year 1
- Rental income
- $102,120
- − Mortgage interest
- −$41,732
- − Property taxes
- −$6,182
- − Insurance
- −$3,725
- − Repairs & maintenance
- −$8,170
- − Management
- −$8,170
- − Depreciation
- −$21,673
- Taxable income
- $12,469
- Est. tax owed @ 24.0%
- −$2,993
- After-tax cash flow
- $20,893/yr
For passive investors: Depreciation is non-cash, so a rental often shows a tax loss while cash-flowing — sheltering income. Rental losses are passive: they offset passive income freely, and up to $25,000/yr can offset ordinary (W-2) income if you actively participate and your MAGI is under $100k (phasing out to $0 by $150k); unused losses carry forward. On sale, claimed depreciation is recaptured at up to 25%, and gains may owe capital-gains tax (a 1031 exchange can defer both). Figures are a year-1 estimate at your 24.0% rate — not tax advice; consult a CPA.
Schools (NCES district)
- District
- Oakland Unified
- NCES district ID
- 0628050
- Math proficiency
- 27% ▬ 0.00%
- Reading proficiency
- 33% ▬ 0.00%
- Median HH income
- $55,194
- Composite
- 29.52/100
- National rank
- #11769
- State rank
- #1007 of 1400 in CA
Livability — Oakland
- Score
- 71/100
- State rank
- #224
- US rank
- #7245
Category grades
Schools grade is shown separately in the Schools card above.
Census & demographics
- Census place
- Oakland, CA
- County
- Alameda County · 1,614,355 people
- City population
- 385,993
- Metro
- San Francisco-Oakland-Berkeley, CA
- Population (ZIP)
- 44,103
- Household income
- $106,068
- Rent vs Own
- Severe rent burden
- 2086.0
Population outlook (Alameda County) Hauer SSP2
- Today (2025)
- 1,928,884 people
- By 2030
- 2,069,146 · +7.3%
- By 2040
- 2,338,405 · +21.2%
- By 2050
- 2,586,608 · +34.1%
- By 2075
- 3,061,911 · +58.7%
- By 2100
- 3,234,133 · +67.7%
Race, ethnicity, and origin ACS 2023
- Neighborhood character
- Highly diverse neighborhood (Simpson 0.73)
- Race & ethnicity
- Black 40% Hispanic / Latino 27% White 17% Two or more races 11% Asian 9%
- Hispanic origin (detail)
- Mexican 18% Puerto Rican 1%
- Common ancestry
- Italian 2% Lithuanian 1% Romanian 1%
- Foreign-born
- 20% · Canada, China, Vietnam
- Languages at home
- 70% English-only · Spanish 21% Chinese 2% Other Asian/Pacific 2%
Political lean MEDSL · Alameda
- 2024 margin
- Solid D (+53.6) · D 74.6% · R 21.0% · Other 4.4%
- 2008→2024 swing
- -5.9pp toward R · 2008: 59.5pp · 2024: 53.6pp
- All cycles
- 2024: D+53.6 2020: D+62.5 2016: D+64.4 2012: D+59.8 2008: D+59.5
Not yet ingested
- Civics
- —
Market trends
- HPI YoY
- ▼ -793.09%
- Current HPI
- 294.5467
- Rent YoY
- ▲ 0.65%
- Metro
- San Francisco-Oakland-Berkeley, CA
- State GDP YoY
- ▲ 3.21%
- F500 in state
- 116
Industry mix (Fortune 500 HQ in CA)
| Industry | F500 HQs | Revenue |
|---|---|---|
| Technology | 27 | $1,492B |
|
||
| Financial Services | 3 | $174B |
|
||
| Retail | 3 | $44B |
|
||
| Insurance | 3 | $26B |
|
||
| Media / Entertainment | 2 | $115B |
|
||
| Pharmaceuticals / Biotech | 2 | $62B |
|
||
Price history
+1390.0% since first listed26 events — show timeline
- 2026-01-13 Listed $745,000 bridgeMLS, Bay East AOR, or Contra Costa AOR
- 2025-05-22 Listing Removed — bridgeMLS, Bay East AOR, or Contra Costa AOR
- 2025-03-05 Price Changed — bridgeMLS, Bay East AOR, or Contra Costa AOR
- 2025-02-13 Listed — bridgeMLS, Bay East AOR, or Contra Costa AOR
- 2024-09-26 Listing Removed — bridgeMLS, Bay East AOR, or Contra Costa AOR
- 2024-09-18 Listed — bridgeMLS, Bay East AOR, or Contra Costa AOR
- 2023-11-16 Listing Removed — bridgeMLS, Bay East AOR, or Contra Costa AOR
- 2023-11-14 Relisted — bridgeMLS, Bay East AOR, or Contra Costa AOR
- 2023-11-05 Listing Removed — bridgeMLS, Bay East AOR, or Contra Costa AOR
- 2023-09-29 Relisted — bridgeMLS, Bay East AOR, or Contra Costa AOR
- 2023-09-27 Pending — bridgeMLS, Bay East AOR, or Contra Costa AOR
- 2023-09-15 Pending — bridgeMLS, Bay East AOR, or Contra Costa AOR
- 2023-08-29 Price Changed — bridgeMLS, Bay East AOR, or Contra Costa AOR
- 2023-08-25 Listed — bridgeMLS, Bay East AOR, or Contra Costa AOR
- 2022-12-31 Listing Removed — bridgeMLS, Bay East AOR, or Contra Costa AOR
- 2022-11-04 Price Changed — bridgeMLS, Bay East AOR, or Contra Costa AOR
- 2022-10-10 Listed — bridgeMLS, Bay East AOR, or Contra Costa AOR
- 2010-12-28 Sold (MLS) $177,500 bridgeMLS, Bay East AOR, or Contra Costa AOR
- 2010-11-29 Pending — bridgeMLS, Bay East AOR, or Contra Costa AOR
- 2010-11-18 Listed $204,900 bridgeMLS, Bay East AOR, or Contra Costa AOR
- 2003-12-08 Sold (Public Records) $520,000 Public Records
- 2003-12-08 Sold (MLS) $520,000 bridgeMLS, Bay East AOR, or Contra Costa AOR
- 2003-09-25 Listed $540,000 bridgeMLS, Bay East AOR, or Contra Costa AOR
- 1995-09-15 Sold (Public Records) $163,000 Public Records
- 1991-04-30 Sold (Public Records) $201,000 Public Records
- 1987-11-13 Sold (Public Records) $50,000 Public Records
Property tax history
-2.0%/yrLatest (2025): $6,182 · +5.0% YoY. Source: county tax records.
Cash-flow waterfall
monthlySold comps — $/sqft
last 12 mo · ≤1 miLoading sold comps…