250 W Merrick Rd Unit 2R · Freeport, NY
Flood risk 1/10 · Minimal
- FEMA flood zone
- X (unshaded)
- Chance of flooding over 30 yrs
- 0.0%
- Est. flood insurance / yr
- $473 – $860
Fire risk 1/10 · Minimal
- Est. fire insurance / yr
- $691 – $1,283
Heat risk 6/10 · Moderate
- Hot days now (above 95°F)
- 7 days/yr
- Hot days in 30 yrs
- 16 days/yr
Wind risk 6/10 · Moderate
- Chance of severe wind over 30 yrs
- 69.0%
Air-quality risk 4/10 · Minor
- Unhealthy air days now
- 5 days/yr
- Unhealthy air days in 30 yrs
- 8 days/yr
Risk factors via First Street. Map © Google.
Why this score? — see what drove the F grade
The composite is a weighted blend of 9 inputs, each scored 0–100. Each bar is that input's sub-score; the figure is the points it added to the 100-point composite (weight × sub-score).
- ARV discount +7.5/15.0
- Schools +4.6/10.0
- Livability +4.2/5.0
- 1% rule +3.5/10.0
- Rent growth +2.5/5.0
- Condition / age +2.5/5.0
- Cash flow +0.2/30.0
- DSCR +0.0/10.0
- Appreciation +0.0/10.0
$325,888
🖨 Deal sheet 📄 Offer letter ✓ Due diligence
Listing remarks
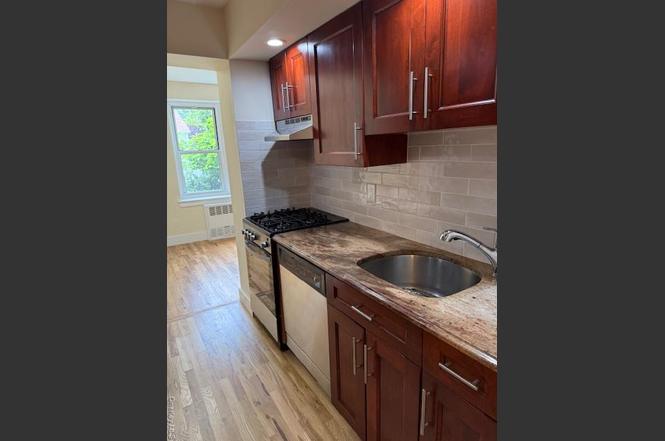
Welcome to Country Club Manor in the heart of Freeport! This spacious and beautifully maintained 2-bedroom, 1-bath co-op offers a perfect blend of comfort, style, and convenience. Located on the 2nd floor, Unit 2R features gleaming hardwood floors, an updated kitchen with modern appliances and ample cabinet space, and a newly renovated bathroom with sleek finishes. Enjoy a bright and airy layout with generously sized bedrooms and abundant closet space. The building offers fantastic amenities, including a swimming pool, BBQ/patio area, laundry available in the building, bike storage, and first-come, first-served parking space. Heat, hot water, and property maintenance are included in the mon
Key facts
- Bbq patio area
- Swimming pool
- Updated kitchen
Tags
Neighborhood map
What this means for you Summary
Snapshot
- This is a 2-bed/1.0-bath condo listed at $326k.
Deal economics
- At list price, monthly cash flow is $-1k ($-18k/yr) — negative.
- To cash-flow at today's rent, offer at most $316k (3.0% below list).
- To meet the 1% rule (rent ≥ 1% of price), the offer needs to be $277k (15.1% below list).
- Recommended offer: $277k (15.1% below list) — sets the bar for 1% rule.
- Cap rate 0.9% vs local median 3.0% in Freeport — below-typical yield; the buyer is paying a premium for something (appreciation thesis, condition, location) that the cap rate doesn't capture.
Location & tenants
- Location reads 83/100 on livability (#69 in NY, #1,033 nationally) — a professional / high-income tenant draw. Strengths: commute A+, employment A+, housing A+; Watch: cost of living F.
- Freeport Union Free School District (suburban): math 49% / reading 55% proficiency, ranked #325 of 590 in NY (top 55%) — acceptable for families but not a draw, mixed tenant base, ~2y average lease.
- Zoned schools: Bayview Avenue School (math 67% / reading 52%, grade B-, #745 of 2,108 statewide, top 39%, 516 students, 69% FRL); John W Dodd Middle School (math 16% / reading 41%, grade F, #569 of 729 statewide, top 78%, 986 students, 67% FRL); Freeport High School (math 82% / reading 85%, grade A, #409 of 1,100 statewide, top 39%, 2,264 students, 62% FRL).
- Market conditions: 199 active listings in the ZIP; 7 comparable units currently listed for rent nearby; rentals lingering (median 44d on market — plan ~5-8 weeks vacancy on turnover, expect pricing pressure); 57% of comp listings sitting > 30 days — soft ceiling on asking rent; 824 units permitted in Nassau County in 2024 (153 in 5+ unit buildings).
Forward outlook
- Local home prices are declining (-3.0%/yr); year-one equity from $2k of loan paydown is wiped out by about $10k of value loss. Plan a longer hold.
- Nassau County population projected at +7% by 2050 — modest demand growth; plan on rents tracking national, not racing it.
Negotiation context
- It's been on market 73 days — a 6% lower offer ($306k) is reasonable based on typical stale-listing flexibility.
- 4 sale attempts; this cycle's ask is 9% above the opening price — seller raised mid-cycle; expect resistance to lowballs.
Risks & watch-outs
- Watch-outs: HOA is 51% of rent.
- Climate carrying-cost: major wind risk, 69% chance of damaging wind over 30y; extreme-heat days projected 7→16/yr by 2055 (HVAC capex compounding) — expect insurance premiums to compound above CPI over the hold.
Questions for the listing agent
- What do current leases actually rent for vs. the listed asking? Can we see a recent rent roll and the last 12 months of T-12 income?
- It's been on market 73 days. Have you received any prior offers? Is the seller open to a 15% concession, seller financing, or rate buy-down credit?
- Built in 1960 — when were the roof, HVAC, electrical panel, plumbing, and water heater last replaced?
- What does the HOA fee cover, when was the last increase, and are there any pending special assessments or reserve-fund shortfalls?
- Any open or pending special assessments — roof, HVAC, plumbing, elevator, façade? What's the per-unit balance and payoff schedule, and is the seller paying it off at close or rolling it to the buyer?
- Why hasn't it sold? Are there any deal-killer items the seller is aware of (foundation, flood, title, zoning, code violations)?
- Is there a deadline driving the sale (1031 exchange, divorce, estate, relocation)? That informs how much negotiation room exists.
- Schools are B-rated — typically a magnet for longer-tenancy family renters. What's the average tenant stay here, and is there a school-zone premium baked into asking?
- The area grade is low — what's the realistic commute time and amenity access for the typical tenant pool here? Any planned neighborhood developments (good or bad) we should know about?
- What's the average days-on-market for RENTAL listings here right now (not sales)? A rising rental-DOM trend means longer vacancies and softer asking-rent achievability than the comps imply.
- What's the recent tenant-quality profile in this submarket — average credit score on applications, eviction rate, late-payment / NSF rate, and stable-employment percentage? A property-management company in the area should have these aggregated.
- How much new apartment / multifamily construction is in the pipeline within 1–3 miles? Heavy new supply (>2% of stock underway) typically softens rents 12–24 months out; light construction supports rent growth.
Investment metrics
- 1% rule
- 0.85% ✗
- Cap rate
- 0.88%
- Cash-on-cash
- -19.31%
- DSCR
- 0.14
- GRM
- 9.8
CMA / ARV
No comps found within radius.
Projected returns pro-forma
-3.0% appreciation · 3.0% rent growth · sell at horizon
- IRR
- -55.1%
- Equity multiple
- -0.59×
- Total profit
- $-145,447
- Equity at exit
- $48,591
- IRR
- —
- Equity multiple
- -1.67×
- Total profit
- $-243,434
- Equity at exit
- $28,177
Cash invested: $91,249 (down + closing). Projections, not guarantees.
Landlord ↔ Tenant lean methodology
- Overall (STATE)
- 15 Strongly Tenant-Friendly
- State New York
- 15 Strongly Tenant-Friendly · D+10
- County
- — inherits STATE
- City
- — inherits STATE
ZIP-level market 11520
- Active inventory
- 199
- Price-to-rent
- 9.8×
Monthly cashflow live
- Estimated rent
- $2,766 high interval (Pro) →
- Mortgage (P&I)
- −$1,709
- Tax est. 1.5%
- −$407 /mo · $4,888/yr
- Insurance
- −$136
- HOA est. from 1 same-building comp
- −$1,402
- Vacancy / Maint / Mgmt
- −$581
- Net cashflow
- $-1,469
Break-even live
UW: 25.0% down · 7.5% · 30yr · 1.5% tax · 5.0% vac · 8.0% maint · 8.0% mgmt
Financing live
Cash to close
- Down payment
- $81,472
- Closing costs
- $9,777
- Reserves months
- —
- Total cash needed
- —
Loan-product check · same deal, 3 products live
Conventional
25% down · 7.5% · 30yr
- Down + closing
- —
- Monthly P&I
- —
- Monthly cashflow
- —
- DSCR
- —
- Eligible?
- —
Personal DTI + credit; lowest rate.
DSCR
20% down · 8.5% · 30yr
- Down + closing
- —
- Monthly P&I
- —
- Monthly cashflow
- —
- DSCR
- —
- Eligible?
- —
No personal income docs; deal must DSCR.
Hard money
10% down · 12.0% · 12mo
- Down + closing
- —
- Monthly P&I
- —
- Monthly cashflow
- —
- DSCR
- —
- Eligible?
- —
Short-term bridge; refi at stabilization.
Rent comps 7 comps
| Address | Beds | Baths | Sqft | Rent | $/sqft | DOM | Units | Dist |
|---|---|---|---|---|---|---|---|---|
| 178 Pine St Freeport, NY | 1.0 | 1.0 | 745 | $2,588 | $3.47 | 2d | 3 | 0.15mi |
| 87-89 S Main St Unit 204 Freeport, NY | 1.0 | 1.0 | 900 | $2,900 | $3.22 | 44d | 1 | 0.58mi |
| 66 E Seaman Ave Freeport, NY | 3.0 | 2.5 | 1200 | $3,600 | $3.00 | 44d | 1 | 0.93mi |
| 2092 Grand Ave Unit 2 Baldwin, NY | 2.0 | 1.0 | 1000 | $2,800 | $2.80 | 44d | 1 | 1.01mi |
| 840 Seaman Ave Unit 2w Baldwin, NY | 2.0 | 1.0 | 850 | $2,500 | $2.94 | 13d | 1 | 1.11mi |
| 196 E Seaman Ave Freeport, NY | 3.0 | 2.5 | 1062 | $8,500 | $8.00 | 17d | 1 | 1.15mi |
| 1690 Grand Ave Unit B2 North Baldwin, NY | 1.0 | 1.0 | 750 | $2,800 | $3.73 | 44d | 1 | 1.49mi |
HOA detail condo
- Monthly dues
- $0 · $0/yr
- Likely covers
- waterpool
- Assessments
- None detected in remarks — confirm with the listing agent.
Listing history 8 events
-
2026-04-07status Pending
-
2026-02-26status Active
-
2025-12-24status Pending
-
2025-12-02status Active
-
2025-10-30status Active
-
2025-10-30price $325,888
-
2025-08-13status Pending
-
2025-07-31$299,888 Active
ⓘ Source: listings_history table (triggers on properties + properties_extension) + one-shot
backfill from property_details.listing_events for pre-trigger history.
Climate risk First Street
- Flood 1/10 Low FEMA zone X (unshaded) · 0% chance over 30 yrs
- Wildfire 1/10 Low
- Heat 6/10 Major 7 d/yr ≥95°F today · 16 d/yr by 30 yrs out
- Wind 6/10 Major 69% chance of damaging wind over 30 yrs
- Air quality 4/10 Moderate 5 unhealthy d/yr today · 8 by 30 yrs out
Nearby sold comps map
Loading sold comps map…
Walkable amenities ~0.75 mi
Loading nearby amenities…
Taxation est. · year 1
- Rental income
- $33,196
- − Mortgage interest
- −$18,255
- − Property taxes
- −$4,888
- − Insurance
- −$1,629
- − Repairs & maintenance
- −$2,656
- − Management
- −$2,656
- − HOA
- −$16,824
- − Depreciation
- −$9,480
- Taxable loss
- −$23,192
- Est. tax savings @ 24.0%
- +$5,566
- After-tax cash flow
- $-12,058/yr
For passive investors: Depreciation is non-cash, so a rental often shows a tax loss while cash-flowing — sheltering income. Rental losses are passive: they offset passive income freely, and up to $25,000/yr can offset ordinary (W-2) income if you actively participate and your MAGI is under $100k (phasing out to $0 by $150k); unused losses carry forward. On sale, claimed depreciation is recaptured at up to 25%, and gains may owe capital-gains tax (a 1031 exchange can defer both). Figures are a year-1 estimate at your 24.0% rate — not tax advice; consult a CPA.
Schools (NCES district)
- District
- Freeport Union Free School District
- NCES district ID
- 3611550
- Math proficiency
- 49% ▼ -4.00%
- Reading proficiency
- 55% ▲ 2.00%
- Median HH income
- $67,772
- Composite
- 46.12/100
- National rank
- #2507
- State rank
- #325 of 590 in NY
Livability — Freeport
- Score
- 83/100
- State rank
- #69
- US rank
- #1033
Category grades
Schools grade is shown separately in the Schools card above.
Census & demographics
- Census place
- Freeport, NY
- City population
- 44,873
- Population (ZIP)
- 44,873
Population outlook (Nassau County) Hauer SSP2
- Today (2025)
- 1,409,302 people
- By 2030
- 1,431,482 · +1.6%
- By 2040
- 1,471,607 · +4.4%
- By 2050
- 1,502,845 · +6.6%
- By 2075
- 1,575,403 · +11.8%
- By 2100
- 1,554,356 · +10.3%
Race, ethnicity, and origin ACS 2023
- Neighborhood character
- Diverse neighborhood (Simpson 0.67)
- Race & ethnicity
- Hispanic / Latino 43% Black 33% White 19% Two or more races 17% Asian 2%
- Hispanic origin (detail)
- Puerto Rican 4% Dominican 15%
- Common ancestry
- Hispanic 5% Scotch-Irish 1% Romanian 1%
- Foreign-born
- 34% · Canada, Jamaica, Guatemala
- Languages at home
- 55% English-only · Spanish 38% French/Haitian/Cajun 3% Other Indo-European 1%
Political lean MEDSL · Nassau
- 2024 margin
- Toss-up / Even · D 47.9% · R 52.1%
- 2008→2024 swing
- -12.6pp toward R · 2008: 8.4pp · 2024: -4.2pp
- All cycles
- 2024: R+4.2 2020: D+9.5 2016: D+5.3 2012: D+6.7 2008: D+8.4
Not yet ingested
- Civics
- —
Market trends
- HPI YoY
- ▼ -721.06%
- Current HPI
- 317.6076
- Rent YoY
- —
- Metro
- —
- State GDP YoY
- ▲ 2.60%
- F500 in state
- 92
Industry mix (Fortune 500 HQ in NY)
| Industry | F500 HQs | Revenue |
|---|---|---|
| Financial Services | 10 | $950B |
|
||
| Consumer Goods | 9 | $162B |
|
||
| Insurance | 4 | $225B |
|
||
| Telecommunications | 2 | $144B |
|
||
| Pharmaceuticals | 2 | $112B |
|
||
| Media / Entertainment | 2 | $69B |
|
||
Price history
+8.7% since first listed8 events — show timeline
- 2026-04-07 Pending — OneKey® MLS as Distributed by MLS Grid
- 2026-02-26 Relisted — OneKey® MLS as Distributed by MLS Grid
- 2025-12-24 Pending — OneKey® MLS as Distributed by MLS Grid
- 2025-12-02 Relisted — OneKey® MLS as Distributed by MLS Grid
- 2025-10-30 Relisted — OneKey® MLS as Distributed by MLS Grid
- 2025-10-30 Price Changed $325,888 OneKey® MLS as Distributed by MLS Grid
- 2025-08-13 Pending — OneKey® MLS as Distributed by MLS Grid
- 2025-07-31 Listed $299,888 OneKey® MLS as Distributed by MLS Grid
Cash-flow waterfall
monthlySold comps — $/sqft
last 12 mo · ≤1 miLoading sold comps…