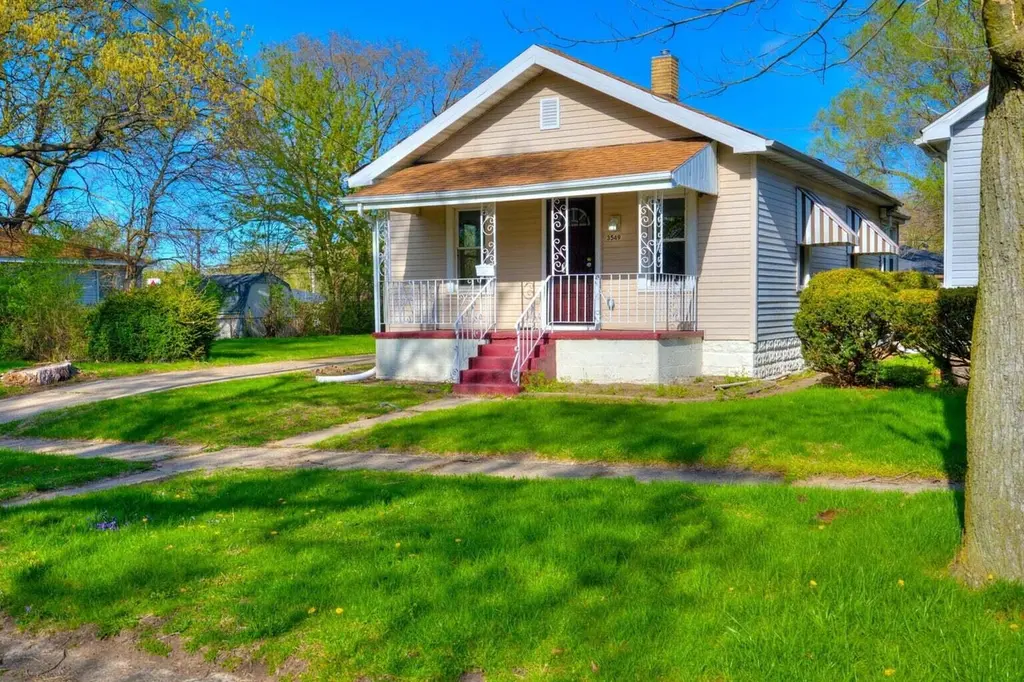
3549 Carolina St · Gary, IN
Flood risk 1/10 · Minimal
- FEMA flood zone
- X (unshaded)
- Chance of flooding over 30 yrs
- 0.0%
- Est. flood insurance / yr
- $473 – $860
Fire risk 2/10 · Minimal
- Est. fire insurance / yr
- $717 – $1,331
Heat risk 3/10 · Minor
- Hot days now (above 102°F)
- 7 days/yr
- Hot days in 30 yrs
- 15 days/yr
Wind risk 2/10 · Minimal
- Chance of severe wind over 30 yrs
- 0.0%
Air-quality risk 4/10 · Minor
- Unhealthy air days now
- 6 days/yr
- Unhealthy air days in 30 yrs
- 7 days/yr
Risk factors via First Street. Map © Google.
Why this score? — see what drove the D grade
The composite is a weighted blend of 9 inputs, each scored 0–100. Each bar is that input's sub-score; the figure is the points it added to the 100-point composite (weight × sub-score).
- Cash flow +15.8/30.0
- ARV discount +7.5/15.0
- DSCR +4.9/10.0
- Rent growth +3.7/5.0
- Livability +3.7/5.0
- 1% rule +3.0/10.0
- Appreciation +3.0/10.0
- Condition / age +2.5/5.0
- Schools +0.5/10.0
$149,900
🖨 Deal sheet (PDF) 📄 Offer letter ✓ Due diligence
Listing remarks
Charming and beautifully updated 2-bedroom, 1-bath bungalow located in Gary, IN! Welcome to 3549 Carolina Street, where modern updates meet timeless character. Relax on the inviting front porch before stepping inside to a bright and welcoming interior featuring fresh neutral paint, refinished hardwood floors throughout the main living area, and new carpet in the bedrooms. The updated kitchen offers white shaker cabinets, granite countertops, and a stylish tile backsplash, creating a clean and modern feel. The fully renovated bathroom features designer tile surround, updated fixtures, and a sleek vanity. A bonus sunroom provides additional flexible space perfect for a home office, sitting ar
Key facts
- Bonus sunroom
- Updated kitchen
- Granite countertops
Tags
Property features AI
Exterior
- Parking: Detached oversized garage; Detached 2-car garage; Driveway parking; On-street parking; Off-street parking; Alley access; Additional parking
- Security: Smoke detector(s)
- Utilities: Electricity connected (100 amp service); Natural gas connected; Public water; Public sewer
- Home design: One-story home; Built in 1914
- Construction: Vinyl siding; Shingle roof; Has basement (interior entry, unfinished)
- Exterior features: Front and rear covered porches (including enclosed front porch); Rain gutters; Chain link partial fenced backyard; Neighborhood view; Garages on site
Interior
- Kitchen: Country-style kitchen with stone counters
- Bedrooms: Primary bedroom; Second bedroom
- Flooring: Carpet; Laminate; Hardwood
- Bathrooms: 1 full bathroom
- Heating & cooling: Forced air heating (natural gas); Central air conditioning
- Interior features: High ceilings; Country kitchen; Stone counters; Soaking tub; Interior entry basement (unfinished); Smoke detector(s)
- Laundry & utility: Washer hookup (lower level); Gas dryer hookup (lower level)
Neighborhood map
What this means for you Summary
Snapshot
- This is a 3-bed/1.0-bath single-family listed at $150k.
Deal economics
- At list price, monthly cash flow is $70 ($838/yr) — positive.
- The deal already cash-flows at list — no discount required.
- To meet the 1% rule (rent ≥ 1% of price), the offer needs to be $120k (20.2% below list).
- Recommended offer: $120k (20.2% below list) — sets the bar for 1% rule.
- Cap rate 6.9% vs local median 9.1% in Gary — below-typical yield; the buyer is paying a premium for something (appreciation thesis, condition, location) that the cap rate doesn't capture.
Location & tenants
- Location reads 73/100 on livability (#105 in IN) — a middle-class / working-renter tenant base. Strengths: commute A+, cost of living A+, housing A+; Watch: schools F, crime F, employment F.
- Gary Community School Corporation (urban): math 3% / reading 11% proficiency, ranked #299 of 301 in IN (top 99%) — low school quality limits family demand, transient renter base, plan for 1-2y turnover; 80% free/reduced lunch — lower-income household profile, screen leases tightly.
- Market conditions: Rents rising fast (+4.8%/yr); 77 active listings in the ZIP; 9 comparable units currently listed for rent nearby; rentals leasing fast (median 10d on market — plan ~1-2 weeks tenant-placement turnaround); lower-income renter base — watch delinquency; 1,642 units permitted in Lake County in 2024 (14 in 5+ unit buildings).
- This rent runs 32% of the median local income ($45k/yr) — at the standard rent-burdened threshold; future hikes will face affordability resistance.
Forward outlook
- Local home prices are declining (-3.0%/yr); year-one equity from $1k of loan paydown is wiped out by about $4k of value loss. Plan a longer hold.
- Lake County population projected to shrink 7% by 2050 — rents likely to lag national; underwrite the cash flow, not the appreciation.
Negotiation context
- It's been on market 33 days — a 3% lower offer ($145k) is reasonable based on typical stale-listing flexibility.
- 4 sale attempts with the ask held roughly flat each time — persistent listings suggest the price (not the market) is what's stuck; bring a comps-based counter.
Risks & watch-outs
- Watch-outs: built in 1914 — expect roof / HVAC / electrical / plumbing capex.
Questions for the listing agent
- It's been on market 33 days. Have you received any prior offers? Is the seller open to a 20% concession, seller financing, or rate buy-down credit?
- Built in 1914 — when were the roof, HVAC, electrical panel, plumbing, and water heater last replaced?
- Is there a deadline driving the sale (1031 exchange, divorce, estate, relocation)? That informs how much negotiation room exists.
- Schools are F-rated, which usually means shorter tenancies and higher turnover. Who's the typical renter profile here, and what's been the actual vacancy rate?
- Crime grade is F in this area — have there been break-ins, vandalism, or insurance claims at this property in the last 3 years? What carrier currently insures it and at what premium?
- The area grade is low — what's the realistic commute time and amenity access for the typical tenant pool here? Any planned neighborhood developments (good or bad) we should know about?
- What's the average days-on-market for RENTAL listings here right now (not sales)? A rising rental-DOM trend means longer vacancies and softer asking-rent achievability than the comps imply.
- What's the recent tenant-quality profile in this submarket — average credit score on applications, eviction rate, late-payment / NSF rate, and stable-employment percentage? A property-management company in the area should have these aggregated.
- How much new for-sale + rental construction is in the pipeline within 1–3 miles? Heavy new supply typically softens prices + rents 12–24 months out; constrained supply supports both.
Investment metrics
- 1% rule
- 0.80% ✗
- Cap rate
- 6.85%
- Cash-on-cash
- 2.00%
- DSCR
- 1.09
- GRM
- 10.4
CMA / ARV
- ARV (on-the-fly)
- $24,640
- Comps found
- 9
Show comp detail 9 sales within ~0.75 mi
| Address | Dist | Beds/Ba | Sqft | Sold | Price | $/sf | Match |
|---|---|---|---|---|---|---|---|
| 3621 Virginia St | 0.11mi | 2/1.0 (-1) | 748 (+6%) | 7mo | $25,000 | $33 | 74 |
| 933 E Ridge Rd | 0.26mi | 3/1.0 | 651 (-8%) | 17mo | $5,488 | $8 | 61 |
| 3632 Virginia St | 0.14mi | 2/1.0 (-1) | 754 (+7%) | 19mo | $59,750 | $79 | 61 |
| 3705 Mississippi St | 0.60mi | 2/1.0 (-1) | 704 (0%) | 8mo | $83,500 | $119 | 60 |
| 3518 Massachusetts St | 0.40mi | 2/1.0 (-1) | 660 (-6%) | 9mo | $23,000 | $35 | 58 |
| 1015 E 36th Pl | 0.25mi | 2/1.0 (-1) | 780 (+11%) | 9mo | $82,000 | $105 | 58 |
| 4001 Virginia St | 0.57mi | 2/1.0 (-1) | 760 (+8%) | 8mo | $45,000 | $59 | 48 |
| 4045 Massachusetts St | 0.73mi | 2/1.5 (-1) | 736 (+4%) | 8mo | $3,500 | $5 | 45 |
| 3939 Massachusetts St | 0.61mi | 2/1.0 (-1) | 792 (+12%) | 13mo | $18,000 | $23 | 35 |
Match score weights: distance 35% · size 25% · config 20% · recency 20%. Top-matched comps best support the ARV.
Projected returns pro-forma
-3.0% appreciation · 4.85% rent growth · sell at horizon
- IRR
- -11.4%
- Equity multiple
- 0.58×
- Total profit
- $-17,656
- Equity at exit
- $22,351
- IRR
- -0.1%
- Equity multiple
- 0.99×
- Total profit
- $-310
- Equity at exit
- $12,961
Cash invested: $41,972 (down + closing). Projections, not guarantees.
Landlord ↔ Tenant lean methodology
- Overall (STATE)
- 90 Strongly Landlord-Friendly
- State Indiana
- 90 Strongly Landlord-Friendly · R+11
- County
- — inherits STATE
- City
- — inherits STATE
ZIP-level market 46409
- Home prices YoY
- -2.0%
- Rents YoY
- 4.8%
- Active inventory
- 77
- Price-to-rent
- 10.4×
Monthly cashflow live
- Estimated rent
- $1,197 high interval (Pro) →
- Mortgage (P&I)
- −$786
- Tax from tax record
- −$27 /mo · $323/yr
- Insurance
- −$62
- HOA
- −$0
- Vacancy / Maint / Mgmt
- −$251
- Net cashflow
- $70
Break-even live
Sensitivity live
| Price | -10% $155 | -5% $112 | +0% $70 | +5% $27 | +10% $-194 |
|---|---|---|---|---|---|
| Rent | -10% $-25 | -5% $23 | +0% $70 | +5% $117 | +10% $164 |
| Rate | -1.0pp $145 | -0.5pp $108 | base $70 | +0.5pp $31 | +1.0pp $-9 |
UW: 25.0% down · 7.5% · 30yr · 1.5% tax · 5.0% vac · 8.0% maint · 8.0% mgmt
Financing live
Cash to close
- Down payment
- $37,475
- Closing costs
- $4,497
- Reserves months
- —
- Total cash needed
- —
Loan-product check · same deal, 3 products live
Conventional
25% down · 7.5% · 30yr
- Down + closing
- —
- Monthly P&I
- —
- Monthly cashflow
- —
- DSCR
- —
- Eligible?
- —
Personal DTI + credit; lowest rate.
DSCR
20% down · 8.5% · 30yr
- Down + closing
- —
- Monthly P&I
- —
- Monthly cashflow
- —
- DSCR
- —
- Eligible?
- —
No personal income docs; deal must DSCR.
Hard money
10% down · 12.0% · 12mo
- Down + closing
- —
- Monthly P&I
- —
- Monthly cashflow
- —
- DSCR
- —
- Eligible?
- —
Short-term bridge; refi at stabilization.
Rent comps 9 comps
| Address | Beds | Baths | Sqft | Rent | $/sqft | DOM | Units | Dist |
|---|---|---|---|---|---|---|---|---|
| 1005 W 35th Ave Apt 202 Gary, IN | 2.0 | 1.0 | 617 | $795 | $1.29 | 3d | 1 | 1.08mi |
| 1005 W 35th Ave Apt 105 Gary, IN | 2.0 | 1.0 | 601 | $795 | $1.32 | 20d | 1 | 1.08mi |
| 1015 W 35th Ave Apt 206 Gary, IN | 2.0 | 1.0 | 601 | $795 | $1.32 | 45d | 1 | 1.10mi |
| 2453 Prospect St Gary, IN | 2.0 | 1.0 | 704 | $1,095 | $1.56 | 0d | 1 | 1.37mi |
| 4170 Fillmore St Gary, IN | 2.0 | 1.0 | 720 | $950 | $1.32 | 21d | 1 | 1.38mi |
| 3942 Lincoln St Gary, IN | 2.0 | 1.0 | 520 | $1,150 | $2.21 | 9d | 1 | 1.41mi |
| 3942 Lincoln St Gary, IN | 2.0 | 1.0 | 520 | $1,150 | $2.21 | 5d | 1 | 1.41mi |
| 837 W 27th Ave Unit A Gary, IN | 2.0 | 1.0 | 750 | $1,150 | $1.53 | 0d | 1 | 1.45mi |
| 2355 Rhode Island St Gary, IN | 2.0 | 1.0 | 701 | $1,095 | $1.56 | 45d | 1 | 1.49mi |
Listing history 22 events
-
2026-06-21days on market $149,900 Active 33 DOM
-
2026-06-18days on market $149,900 Active 30 DOM
-
2026-06-17days on market $149,900 Active 29 DOM
-
2026-06-16days on market $149,900 Active 28 DOM
-
2026-06-15days on market $149,900 Active 27 DOM
-
2026-06-13days on market $149,900 Active 25 DOM
-
2026-06-13days on market $149,900 Active 24 DOM
-
2026-06-09days on market $149,900 Active 21 DOM
-
2026-06-08days on market $149,900 Active 20 DOM
-
2026-06-07days on market $149,900 Active 19 DOM
-
2026-06-04days on market $149,900 Active 16 DOM
-
2026-06-03days on market $149,900 Active 15 DOM
-
2026-06-02days on market $149,900 Active 14 DOM
-
2026-06-01days on market $149,900 Active 13 DOM
-
2026-05-31days on market $149,900 Active 12 DOM
-
2026-05-19$149,900 Active
-
2026-03-01historical
-
2025-11-01$149,900 Active
-
2025-11-01historical
-
2025-07-01$149,900 Active
-
2025-07-01historical
-
2025-03-11$149,900 Active
ⓘ Source: listings_history table (triggers on properties + properties_extension) + one-shot
backfill from property_details.listing_events for pre-trigger history.
Tax reassessment forecast IN · Partial reset (capped growth)
- Current annual tax
- $323 · $27/mo
- Projected year-2 tax
- $799 · $67/mo
- Expected delta
- +$476/yr (+$40/mo · 147.3%)
ⓘ Screening estimate from a state-policy table — verify with the county assessor before closing.
Climate risk First Street
- Flood 1/10 Low FEMA zone X (unshaded) · 0% chance over 30 yrs
- Wildfire 2/10 Low
- Heat 3/10 Moderate 7 d/yr ≥102°F today · 15 d/yr by 30 yrs out
- Wind 2/10 Low 0% chance of damaging wind over 30 yrs
- Air quality 4/10 Moderate 6 unhealthy d/yr today · 7 by 30 yrs out
Nearby sold comps map
Loading sold comps map…
Walkable amenities ~0.75 mi
Loading nearby amenities…
Taxation est. · year 1
- Rental income
- $14,359
- − Mortgage interest
- −$8,397
- − Property taxes
- −$323
- − Insurance
- −$750
- − Repairs & maintenance
- −$1,149
- − Management
- −$1,149
- − Depreciation
- −$4,361
- Taxable loss
- −$1,769
- Est. tax savings @ 24.0%
- +$424
- After-tax cash flow
- $1,262/yr
For passive investors: Depreciation is non-cash, so a rental often shows a tax loss while cash-flowing — sheltering income. Rental losses are passive: they offset passive income freely, and up to $25,000/yr can offset ordinary (W-2) income if you actively participate and your MAGI is under $100k (phasing out to $0 by $150k); unused losses carry forward. On sale, claimed depreciation is recaptured at up to 25%, and gains may owe capital-gains tax (a 1031 exchange can defer both). Figures are a year-1 estimate at your 24.0% rate — not tax advice; consult a CPA.
Schools (NCES district)
- District
- Gary Community School Corporation
- NCES district ID
- 1803870
- Math proficiency
- 3% ▼ -10.00%
- Reading proficiency
- 11% ▼ -6.00%
- Median HH income
- $27,739
- Composite
- 4.98/100
- National rank
- #10039
- State rank
- #299 of 301 in IN
Livability — Gary
- Score
- 73/100
- State rank
- #105
- US rank
- #5592
Category grades
Schools grade is shown separately in the Schools card above.
Census & demographics
- Census place
- Gary, IN
- County
- Lake County · 422,878 people
- City population
- 63,701
- Metro
- Chicago-Naperville-Elgin, IL-IN-WI
- Population (ZIP)
- 7,184
- Household income
- $44,667
- Rent vs Own
- Severe rent burden
- 516.0
Population outlook (Lake County) Hauer SSP2
- Today (2025)
- 484,026 people
- By 2030
- 478,091 · -1.2%
- By 2040
- 462,974 · -4.3%
- By 2050
- 449,894 · -7.1%
- By 2075
- 436,169 · -9.9%
- By 2100
- 426,607 · -11.9%
Race, ethnicity, and origin ACS 2023
- Neighborhood character
- Predominantly Black (68%)
- Race & ethnicity
- Black 68% Two or more races 17% Hispanic / Latino 14% White 11%
- Hispanic origin (detail)
- Mexican 8% Puerto Rican 5%
- Common ancestry
- Iranian 1% Romanian 1%
- Foreign-born
- 2% · Canada
- Languages at home
- 94% English-only · Spanish 6%
Political lean MEDSL · Lake
- 2024 margin
- Lean D (+5.6) · D 52.1% · R 46.5% · Other 1.5%
- 2008→2024 swing
- -28.6pp toward R · 2008: 34.3pp · 2024: 5.6pp
- All cycles
- 2024: D+5.6 2020: D+15.1 2016: D+20.6 2012: D+31.0 2008: D+34.3
Not yet ingested
- Civics
- —
Market trends
- HPI YoY
- ▼ -3.91%
- Current HPI
- 190.6724
- Rent YoY
- ▲ 4.85%
- Metro
- Chicago-Naperville-Elgin, IL-IN-WI
- State GDP YoY
- ▲ 2.90%
- F500 in state
- 18
Industry mix (Fortune 500 HQ in IN)
| Industry | F500 HQs | Revenue |
|---|---|---|
| Industrial Machinery | 2 | $37B |
|
||
| Healthcare | 1 | $177B |
|
||
| Pharmaceuticals | 1 | $45B |
|
||
| Metals / Steel | 1 | $18B |
|
||
| Agriculture | 1 | $17B |
|
||
| Packaging | 1 | $12B |
|
||
Price history
+0.0% since first listed7 events — show timeline
- 2026-05-19 Listed $149,900 NIRA MLS as Distributed by MLS Grid
- 2026-03-01 Listing Removed — NIRA MLS as Distributed by MLS Grid
- 2025-11-01 Listed $149,900 NIRA MLS as Distributed by MLS Grid
- 2025-11-01 Listing Removed — NIRA MLS as Distributed by MLS Grid
- 2025-07-01 Listed $149,900 NIRA MLS as Distributed by MLS Grid
- 2025-07-01 Listing Removed — NIRA MLS as Distributed by MLS Grid
- 2025-03-11 Listed $149,900 NIRA MLS as Distributed by MLS Grid
Property tax history
+15.1%/yrLatest (2024): $323 · +207.5% YoY. Source: county tax records.
Cash-flow waterfall
monthlySold comps — $/sqft
last 12 mo · ≤1 miLoading sold comps…