55 Eland Dr #55 · North Fort Myers, FL
Flood risk No data
- FEMA flood zone
- —
- Chance of flooding over 30 yrs
- —
- Est. flood insurance / yr
- —
Fire risk No data
- Est. fire insurance / yr
- —
Heat risk No data
- Hot days now (above threshold)
- —
- Hot days in 30 yrs
- —
Wind risk No data
- Chance of severe wind over 30 yrs
- —
Air-quality risk No data
- Unhealthy air days now
- —
- Unhealthy air days in 30 yrs
- —
Risk factors via First Street. Map © Google.
Why this score? — see what drove the B- grade
The composite is a weighted blend of 9 inputs, each scored 0–100. Each bar is that input's sub-score; the figure is the points it added to the 100-point composite (weight × sub-score).
- Cash flow +30.0/30.0
- DSCR +10.0/10.0
- 1% rule +8.7/10.0
- ARV discount +7.5/15.0
- Schools +4.1/10.0
- Livability +3.7/5.0
- Rent growth +3.2/5.0
- Condition / age +2.5/5.0
- Appreciation +0.0/10.0
$155,000
🖨 Deal sheet 📄 Offer letter ✓ Due diligence
Listing remarks
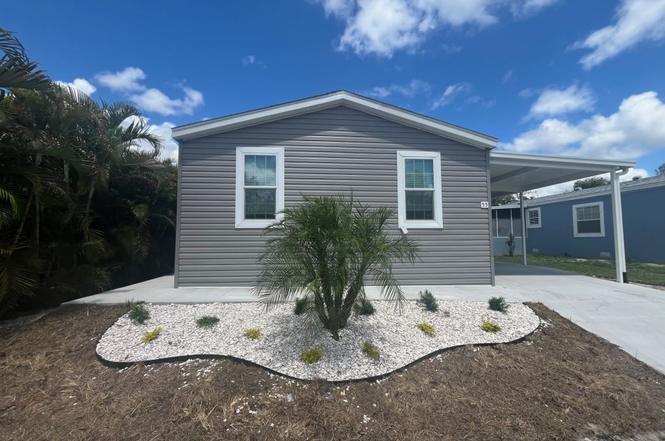
Welcome to Island Vista Estates an all ages active and vibrant community, where you can find yourself in your dream home. We have a stunning, brand new, beautiful, 2025 4 bed, 2 bath home for sale featuring 1355.12 sq ft of beautifully designed living space. Located in/near North Fort Myers, this property offers the perfect blend of modern amenities and timeless charm. Step inside to find an open-concept floor plan, hardwood floors, high ceilings, natural lighting. The kitchen features like quartz countertops, stainless steel appliances, custom cabinetry, perfect for both everyday living and entertaining. The spacious primary suite offers a peaceful retreat, complete with features like dual
Key facts
- Walk-in closet
- En-suite bathroom
- Built 2025
Tags
Property features AI
Finance
- Financial info: List price $155,000
Exterior
- Home design: Spec inventory home — Hawthorne plan; Active status
- Construction: Property located at 55 Eland Dr #55, North Fort Myers, FL 33917
Interior
- Bedrooms: 4 bedrooms
- Bathrooms: 2 full bathrooms
- Interior features: Living area approximately 1290
Neighborhood map
What this means for you Summary
Snapshot
- This is a 4-bed/2.0-bath manufactured listed at $155k.
Deal economics
- At list price, monthly cash flow is $612 ($7k/yr) — positive.
- The deal already cash-flows at list — no discount required.
- Meets the 1% rule at list price ($2k rent vs $155k).
- Recommended offer: $136k (12.0% below list) — sets the bar for market timing.
- Cap rate 11.0% vs local median 3.6% in North Fort Myers — top-decile yield for the area; either an underpriced asset or a hidden risk that comps aren't pricing in. Stress-test before assuming the spread holds.
Location & tenants
- Location reads 74/100 on livability (#269 in FL, #4,409 nationally) — a middle-class / working-renter tenant base. Strengths: cost of living A+, housing A+, health & safety A+; Watch: employment C-, amenities F, commute F.
- Lee (suburban): math 47% / reading 50% proficiency, ranked #42 of 73 in FL (top 58%) — families likely to look elsewhere, expect single-tenant / working-renter base with shorter leases.
- Market conditions: Rents rising (+2.6%/yr); 841 active listings in the ZIP; 36 comparable units currently listed for rent nearby; rentals at typical pace (median 16d on market — plan ~3-4 weeks tenant-placement turnaround); 15,411 units permitted in Lee County in 2024 (4,686 in 5+ unit buildings).
- At $2,130/mo this rent would consume 46% of the median local household income ($55k/yr) (locally 775% of renters already pay >50% of income on rent) — very limited rent-growth headroom before tenants either downsize or default.
Forward outlook
- Local home prices are declining (-3.0%/yr); year-one equity from $1k of loan paydown is wiped out by about $5k of value loss. Plan a longer hold.
- Lee County population projected at +44% by 2050 — long-run rental-demand tailwind backs the buy-and-hold thesis.
- At projected returns (-3.0% appreciation + 2.6% rent growth), your $43k cash investment doubles in ~8 years — after that, you're playing with house money.
Negotiation context
- It's been on market 282 days — a 12% lower offer ($136k) is reasonable based on typical stale-listing flexibility.
Questions for the listing agent
- It's been on market 282 days. Have you received any prior offers? Is the seller open to a 12% concession, seller financing, or rate buy-down credit?
- Why hasn't it sold? Are there any deal-killer items the seller is aware of (foundation, flood, title, zoning, code violations)?
- Is there a deadline driving the sale (1031 exchange, divorce, estate, relocation)? That informs how much negotiation room exists.
- What's the average days-on-market for RENTAL listings here right now (not sales)? A rising rental-DOM trend means longer vacancies and softer asking-rent achievability than the comps imply.
- What's the recent tenant-quality profile in this submarket — average credit score on applications, eviction rate, late-payment / NSF rate, and stable-employment percentage? A property-management company in the area should have these aggregated.
- How much new for-sale + rental construction is in the pipeline within 1–3 miles? Heavy new supply typically softens prices + rents 12–24 months out; constrained supply supports both.
Investment metrics
- 1% rule
- 1.37% ✓
- Cap rate
- 11.03%
- Cash-on-cash
- 16.91%
- DSCR
- 1.75
- GRM
- 6.1
CMA / ARV
No comps found within radius.
Projected returns pro-forma
-3.0% appreciation · 2.63% rent growth · sell at horizon
- IRR
- 7.7%
- Equity multiple
- 1.30×
- Total profit
- $13,083
- Equity at exit
- $23,111
- IRR
- 16.7%
- Equity multiple
- 2.35×
- Total profit
- $58,469
- Equity at exit
- $13,402
Cash invested: $43,400 (down + closing). Projections, not guarantees.
Landlord ↔ Tenant lean methodology
- Overall (STATE)
- 87 Strongly Landlord-Friendly
- State Florida
- 87 Strongly Landlord-Friendly · R+3
- County
- — inherits STATE
- City
- — inherits STATE
ZIP-level market 33917
- Home prices YoY
- -30.2%
- Rents YoY
- 2.6%
- Active inventory
- 841
- Price-to-rent
- 6.1×
Monthly cashflow live
- Estimated rent
- $2,130 high interval (Pro) →
- Mortgage (P&I)
- −$813
- Tax est. 1.5%
- −$194 /mo · $2,325/yr
- Insurance
- −$65
- HOA
- −$0
- Vacancy / Maint / Mgmt
- −$447
- Net cashflow
- $612
Break-even live
UW: 25.0% down · 7.5% · 30yr · 1.5% tax · 5.0% vac · 8.0% maint · 8.0% mgmt
Financing live
Cash to close
- Down payment
- $38,750
- Closing costs
- $4,650
- Reserves months
- —
- Total cash needed
- —
Loan-product check · same deal, 3 products live
Conventional
25% down · 7.5% · 30yr
- Down + closing
- —
- Monthly P&I
- —
- Monthly cashflow
- —
- DSCR
- —
- Eligible?
- —
Personal DTI + credit; lowest rate.
DSCR
20% down · 8.5% · 30yr
- Down + closing
- —
- Monthly P&I
- —
- Monthly cashflow
- —
- DSCR
- —
- Eligible?
- —
No personal income docs; deal must DSCR.
Hard money
10% down · 12.0% · 12mo
- Down + closing
- —
- Monthly P&I
- —
- Monthly cashflow
- —
- DSCR
- —
- Eligible?
- —
Short-term bridge; refi at stabilization.
Rent comps 36 comps
| Address | Beds | Baths | Sqft | Rent | $/sqft | DOM | Units | Dist |
|---|---|---|---|---|---|---|---|---|
| 574 Leopard Ln #574 North Fort Myers, FL | 4.0 | 2.0 | 1459 | $1,599 | $1.10 | 13d | 1 | 0.22mi |
| 266 Mongoose Ln #266 North Fort Myers, FL | 3.0 | 2.0 | 1372 | $1,499 | $1.09 | 3d | 1 | 0.23mi |
| 17244 Cantu Ct North Fort Myers, FL | 4.0 | 2.0 | 1824 | $2,200 | $1.21 | 14d | 1 | 0.29mi |
| 17225 Cantu Ct North Fort Myers, FL | 4.0 | 2.0 | 1824 | $2,200 | $1.21 | 23d | 1 | 0.35mi |
| 535 Zebra Dr #535 North Fort Myers, FL | 3.0 | 2.0 | 1352 | $1,499 | $1.11 | 14d | 1 | 0.42mi |
| 4106 San Felice Ln North Fort Myers, FL | 4.0 | 2.5 | 1874 | $2,400 | $1.28 | 23d | 1 | 0.42mi |
| 4120 Pine Drop Ln North Fort Myers, FL | 3.0 | 2.0 | 957 | $1,895 | $1.98 | 23d | 1 | 0.44mi |
| 4106 Lattuca Ln North Fort Myers, FL | 4.0 | 2.5 | 1874 | $2,200 | $1.17 | 23d | 1 | 0.47mi |
| 4106 Granita Ct North Fort Myers, FL | 4.0 | 2.5 | 1812 | $2,300 | $1.27 | 23d | 1 | 0.51mi |
| 3358 Sabal Springs Blvd North Fort Myers, FL | 3.0 | 2.0 | 1621 | $2,200 | $1.36 | 23d | 1 | 0.58mi |
| 17669 Paradiso Way North Fort Myers, FL | 3.0 | 2.0 | 1551 | $1,999 | $1.29 | 23d | 1 | 0.58mi |
| 17669 Paradiso Way North Fort Myers, FL | 3.0 | 2.0 | 1551 | $1,999 | $1.29 | 3d | 1 | 0.58mi |
| 17499 Monte Isola Way Unit 17499 North Fort Myers, FL | 3.0 | 2.5 | 1405 | $1,800 | $1.28 | 13d | 1 | 0.66mi |
| 17489 Monte Isola Way North Fort Myers, FL | 3.0 | 2.5 | 1347 | $1,800 | $1.34 | 14d | 1 | 0.67mi |
| 4208 Caterina Ct North Fort Myers, FL | 3.0 | 2.5 | 1347 | $1,800 | $1.34 | 14d | 1 | 0.74mi |
| 17400 Monte Isola Way North Fort Myers, FL | 3.0 | 2.0 | 1448 | $1,875 | $1.29 | 23d | 1 | 0.77mi |
| 4228 Caterina Ct North Fort Myers, FL | 3.0 | 2.5 | 1700 | $1,850 | $1.09 | 11d | 1 | 0.78mi |
| 4241 Caterina Ct North Fort Myers, FL | 3.0 | 2.5 | 1529 | $1,900 | $1.24 | 15d | 1 | 0.80mi |
| 4264 Cirella Ct North Fort Myers, FL | 3.0 | 2.5 | 1442 | $2,000 | $1.39 | 11d | 1 | 0.81mi |
| 4276 Cirella Ct North Fort Myers, FL | 3.0 | 2.5 | 1378 | $1,800 | $1.31 | 23d | 1 | 0.82mi |
| 17392 Monte Isola Way North Fort Myers, FL | 4.0 | 2.5 | 1871 | $2,299 | $1.23 | 23d | 1 | 0.84mi |
| 4275 Cirella Ct North Fort Myers, FL | 3.0 | 2.5 | 1378 | $1,800 | $1.31 | 23d | 1 | 0.85mi |
| 4216 Villa Rapallo Way North Fort Myers, FL | 4.0 | 2.0 | 1817 | $2,000 | $1.10 | 1d | 1 | 0.95mi |
| 3153 Cozumel Ct Cape Coral, FL | 3.0 | 2.0 | 1747 | $2,000 | $1.14 | 14d | 1 | 0.97mi |
| 4232 Villa Rapallo Way North Fort Myers, FL | 4.0 | 2.0 | 1812 | $1,900 | $1.05 | 23d | 1 | 0.98mi |
| 2864 Star Coral Dr Unit Na North Fort Myers, FL | 3.0 | 2.0 | 1614 | $1,999 | $1.24 | 23d | 1 | 0.99mi |
| 3187 Cozumel Ct Cape Coral, FL | 3.0 | 2.0 | 1747 | $2,000 | $1.14 | 2d | 1 | 1.00mi |
| 2497 Ciales Ct Cape Coral, FL | 3.0 | 2.0 | 1747 | $1,850 | $1.06 | 15d | 1 | 1.07mi |
| 28 Nyborg Ave North Fort Myers, FL | 3.0 | 2.0 | 1042 | $1,299 | $1.25 | 14d | 1 | 1.12mi |
| 2729 Foralesca Ct Cape Coral, FL | 4.0 | 2.0 | 1828 | $2,300 | $1.26 | 23d | 1 | 1.12mi |
| 2729 Foralesca Ct Cape Coral, FL | 4.0 | 2.0 | 1828 | $2,300 | $1.26 | 3d | 1 | 1.12mi |
| 3953 Pomodoro Cir Cape Coral, FL | 1.0–3.0 | 1.0–2.0 | 1044 | $1,624 | $1.56 | 14d | 9 | 1.17mi |
| 3944 Pomodoro Cir #202 Cape Coral, FL | 3.0 | 2.0 | 1411 | $2,200 | $1.56 | 23d | 1 | 1.24mi |
| 3420 Cancun Ct Cape Coral, FL | 3.0 | 2.0 | 1747 | $1,895 | $1.08 | 14d | 1 | 1.30mi |
| 3440 Cancun Ct Cape Coral, FL | 3.0 | 2.0 | 1747 | $1,950 | $1.12 | 23d | 1 | 1.31mi |
| 3940 Villa Del Mar CIR Cape Coral, FL | 1.0–3.0 | 1.0–2.0 | 1051 | $2,739 | $2.60 | 1d | 21 | 1.32mi |
Listing history 8 events
-
2026-06-17days on market $155,000 Active 282 DOM
-
2026-06-16days on market $155,000 Active 281 DOM
-
2026-06-16days on market $155,000 Active 280 DOM
-
2026-06-13days on market $155,000 Active 278 DOM
-
2026-06-09days on market $155,000 Active 274 DOM
-
2026-06-07days on market $155,000 Active 272 DOM
-
2026-06-01days on market $155,000 Active 266 DOM
-
2026-06-01days on market $155,000 Active 265 DOM
ⓘ Source: listings_history table (triggers on properties + properties_extension) + one-shot
backfill from property_details.listing_events for pre-trigger history.
Nearby sold comps map
Loading sold comps map…
Walkable amenities ~0.75 mi
Loading nearby amenities…
Taxation est. · year 1
- Rental income
- $25,562
- − Mortgage interest
- −$8,682
- − Property taxes
- −$2,325
- − Insurance
- −$775
- − Repairs & maintenance
- −$2,045
- − Management
- −$2,045
- − Depreciation
- −$4,509
- Taxable income
- $5,181
- Est. tax owed @ 24.0%
- −$1,243
- After-tax cash flow
- $6,097/yr
For passive investors: Depreciation is non-cash, so a rental often shows a tax loss while cash-flowing — sheltering income. Rental losses are passive: they offset passive income freely, and up to $25,000/yr can offset ordinary (W-2) income if you actively participate and your MAGI is under $100k (phasing out to $0 by $150k); unused losses carry forward. On sale, claimed depreciation is recaptured at up to 25%, and gains may owe capital-gains tax (a 1031 exchange can defer both). Figures are a year-1 estimate at your 24.0% rate — not tax advice; consult a CPA.
Schools (NCES district)
- District
- Lee
- NCES district ID
- 1201080
- Math proficiency
- 47% ▼ -11.00%
- Reading proficiency
- 50% ▼ -4.00%
- Median HH income
- $49,518
- Composite
- 41.49/100
- National rank
- #3458
- State rank
- #42 of 73 in FL
Livability — North Fort Myers
- Score
- 74/100
- State rank
- #269
- US rank
- #4409
Category grades
Schools grade is shown separately in the Schools card above.
Census & demographics
- Census place
- North Fort Myers, FL
- County
- Lee County · 788,662 people
- City population
- 57,035
- Metro
- Cape Coral-Fort Myers, FL
- Population (ZIP)
- 33,380
- Household income
- $55,000
- Rent vs Own
- Severe rent burden
- 775.0
Population outlook (Lee County) Hauer SSP2
- Today (2025)
- 871,946 people
- By 2030
- 955,468 · +9.6%
- By 2040
- 1,113,587 · +27.7%
- By 2050
- 1,256,891 · +44.1%
- By 2075
- 1,560,270 · +78.9%
- By 2100
- 1,726,848 · +98.0%
Race, ethnicity, and origin ACS 2023
- Neighborhood character
- Predominantly White (85%)
- Race & ethnicity
- White 85% Hispanic / Latino 10% Two or more races 7% Asian 1% Black 1%
- Hispanic origin (detail)
- Mexican 2% Puerto Rican 1% Cuban 3%
- Common ancestry
- Lithuanian 3% Romanian 3% Slovak 2%
- Foreign-born
- 10% · Canada
- Languages at home
- 88% English-only · Spanish 9% Other Indo-European 1% Russian/Polish/Slavic 1%
Political lean MEDSL · Lee
- 2024 margin
- Strong R (+28.4) · D 35.5% · R 63.9%
- 2008→2024 swing
- -18.0pp toward R · 2008: -10.4pp · 2024: -28.4pp
- All cycles
- 2024: R+28.4 2020: R+19.2 2016: R+20.4 2012: R+16.6 2008: R+10.4
Not yet ingested
- Civics
- —
Market trends
- HPI YoY
- ▼ -122.28%
- Current HPI
- 282.2895
- Rent YoY
- ▲ 2.63%
- Metro
- Cape Coral-Fort Myers, FL
- State GDP YoY
- ▲ 3.28%
- F500 in state
- 36
Industry mix (Fortune 500 HQ in FL)
| Industry | F500 HQs | Revenue |
|---|---|---|
| Industrial Technology | 2 | $29B |
|
||
| Insurance | 2 | $17B |
|
||
| Retail | 1 | $60B |
|
||
| Technology Distribution | 1 | $58B |
|
||
| Homebuilding | 1 | $35B |
|
||
| Technology Manufacturing | 1 | $35B |
|
||
Cash-flow waterfall
monthlySold comps — $/sqft
last 12 mo · ≤1 miLoading sold comps…