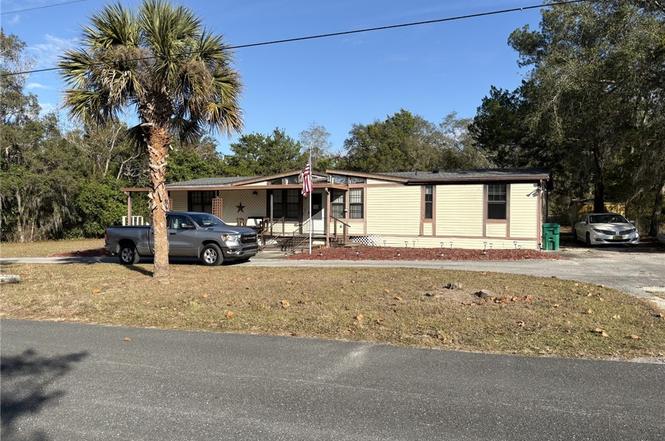
5437 S Doyle Ter · Homosassa Springs, FL
Flood risk 1/10 · Minimal
- FEMA flood zone
- X (unshaded)
- Chance of flooding over 30 yrs
- 0.0%
- Est. flood insurance / yr
- $507 – $1,088
Fire risk 3/10 · Minor
- Est. fire insurance / yr
- $947 – $1,759
Heat risk 10/10 · Severe
- Hot days now (above 108°F)
- 7 days/yr
- Hot days in 30 yrs
- 25 days/yr
Wind risk 9/10 · Severe
- Chance of severe wind over 30 yrs
- 99.0%
Air-quality risk 1/10 · Minimal
- Unhealthy air days now
- 0 days/yr
- Unhealthy air days in 30 yrs
- 0 days/yr
Risk factors via First Street. Map © Google.
Why this score? — see what drove the B+ grade
The composite is a weighted blend of 9 inputs, each scored 0–100. Each bar is that input's sub-score; the figure is the points it added to the 100-point composite (weight × sub-score).
- Cash flow +30.0/30.0
- ARV discount +15.0/15.0
- DSCR +10.0/10.0
- 1% rule +9.7/10.0
- Schools +4.1/10.0
- Livability +3.6/5.0
- Rent growth +2.5/5.0
- Condition / age +2.5/5.0
- Appreciation +0.0/10.0
$134,900
🖨 Deal sheet 📄 Offer letter ✓ Due diligence
Listing remarks
OPPORTUNITY KNOCKS! 3BR/2BA Plus Den/Ofc 1,472 SF on Half Acre! Fireplace, Screened Deck, Utility Room with Washer/Dryer. NEW ROOF 2022! Pool/Swimspa is Located on Rear Deck. Home in Need of Repairs and TLC BUT is a Great Value for the Handy Person!
Key facts
- Screened deck
- Utility room
- New roof
Tags
Property features AI
Exterior
- Parking: Concrete driveway
- Utilities: Private well water; Septic tank sewer
- Home design: Manufactured home (double wide); Single-story
- Construction: Asphalt shingle roof
- Exterior features: Fiberglass in-ground pool; Cleared, level lot; Paved road frontage on a county road
Interior
- Kitchen: Electric oven; Electric range; Dishwasher; Garbage disposal; Owned water purifier
- Flooring: Carpet; Vinyl
- Bathrooms: 2 full bathrooms
- Heating & cooling: Central heating (electric); Central air conditioning
- Interior features: Dryer; Dishwasher; Electric oven; Electric range; Garbage disposal; Owned water purifier; Washer
- Laundry & utility: Washer; Dryer
Neighborhood map
What this means for you Summary
Snapshot
- This is a 3-bed/2.0-bath manufactured listed at $135k.
Deal economics
- At list price, monthly cash flow is $762 ($9k/yr) — positive.
- The deal already cash-flows at list — no discount required.
- Meets the 1% rule at list price ($2k rent vs $135k).
- Recommended offer: $119k (12.0% below list) — sets the bar for market timing.
- Cap rate 13.1% vs local median 5.9% in Homosassa Springs — top-decile yield for the area; either an underpriced asset or a hidden risk that comps aren't pricing in. Stress-test before assuming the spread holds.
Location & tenants
- Location reads 71/100 on livability (#391 in FL) — a middle-class / working-renter tenant base. Strengths: cost of living A+, housing A+, health & safety A+; Watch: crime C-, amenities F, commute F.
- Citrus (rural): math 49% / reading 50% proficiency, ranked #44 of 73 in FL (top 60%) — families likely to look elsewhere, expect single-tenant / working-renter base with shorter leases.
- Zoned schools: Lecanto Primary School (math 55% / reading 53%, grade C, #936 of 2,144 statewide, top 44%, 820 students, 63% FRL); Lecanto Middle School (math 49% / reading 49%, grade C-, #265 of 571 statewide, top 48%, 809 students, 55% FRL); Lecanto High School (math 46% / reading 53%, grade D, #179 of 667 statewide, top 29%, 1,630 students, 46% FRL) — zoned schools at 54% FRL track the district average.
- Market conditions: 582 active listings in the ZIP; 2,443 units permitted in Citrus County in 2024 (0 in 5+ unit buildings).
- This rent runs 40% of the median local income ($59k/yr) — at the standard rent-burdened threshold; future hikes will face affordability resistance.
Forward outlook
- Local home prices are declining (-3.0%/yr); year-one equity from $933 of loan paydown is wiped out by about $4k of value loss. Plan a longer hold.
- Citrus County population projected to shrink 10% by 2050 — rents likely to lag national; underwrite the cash flow, not the appreciation.
- At projected returns (-3.0% appreciation + 3.0% rent growth), your $38k cash investment doubles in ~6 years — after that, you're playing with house money.
Negotiation context
- It's been on market 163 days — a 12% lower offer ($119k) is reasonable based on typical stale-listing flexibility.
- Current owner paid $80k; list at $135k implies a 69% gain — meaningful room to come down on a strong offer.
Risks & watch-outs
- Climate carrying-cost: severe wind risk, 99% chance of damaging wind over 30y; extreme-heat days projected 7→25/yr by 2055 (HVAC capex compounding) — expect insurance premiums to compound above CPI over the hold.
Questions for the listing agent
- It's been on market 163 days. Have you received any prior offers? Is the seller open to a 12% concession, seller financing, or rate buy-down credit?
- Why hasn't it sold? Are there any deal-killer items the seller is aware of (foundation, flood, title, zoning, code violations)?
- Is there a deadline driving the sale (1031 exchange, divorce, estate, relocation)? That informs how much negotiation room exists.
- Schools are F-rated, which usually means shorter tenancies and higher turnover. Who's the typical renter profile here, and what's been the actual vacancy rate?
- What's the average days-on-market for RENTAL listings here right now (not sales)? A rising rental-DOM trend means longer vacancies and softer asking-rent achievability than the comps imply.
- What's the recent tenant-quality profile in this submarket — average credit score on applications, eviction rate, late-payment / NSF rate, and stable-employment percentage? A property-management company in the area should have these aggregated.
- How much new for-sale + rental construction is in the pipeline within 1–3 miles? Heavy new supply typically softens prices + rents 12–24 months out; constrained supply supports both.
Investment metrics
- 1% rule
- 1.47% ✓
- Cap rate
- 13.07%
- Cash-on-cash
- 24.20%
- DSCR
- 2.08
- GRM
- 5.7
CMA / ARV
- ARV (on-the-fly)
- $197,248
- Comps found
- 12
Show comp detail 12 sales within ~0.75 mi
| Address | Dist | Beds/Ba | Sqft | Sold | Price | $/sf | Match |
|---|---|---|---|---|---|---|---|
| 5624 S Dunromin Pt | 0.30mi | 3/2.0 | 1,431 (-3%) | 6mo | $225,000 | $157 | 76 |
| 5292 S Bayliner St | 0.38mi | 3/2.0 | 1,404 (-5%) | 1mo | $170,000 | $121 | 74 |
| 5341 S Oldfield Ave | 0.19mi | 4/3.0 (+1) | 1,484 (+1%) | 11mo | $89,000 | $60 | 71 |
| 5174 S Oldfield Ave | 0.31mi | 3/2.0 | 1,620 (+10%) | 1mo | $335,000 | $207 | 68 |
| 5317 S Bayliner Pt | 0.33mi | 3/2.0 | 1,616 (+10%) | 1mo | $173,000 | $107 | 67 |
| 5738 W Sandstone Ct | 0.48mi | 3/2.0 | 1,380 (-6%) | 2mo | $87,000 | $63 | 66 |
| 5510 S Delilah Pt | 0.17mi | 3/2.0 | 1,288 (-12%) | 8mo | $169,500 | $132 | 64 |
| 5800 S Greenfield Ter | 0.39mi | 3/2.0 | 1,269 (-14%) | 4mo | $199,900 | $158 | 55 |
| 5475 S Oldfield Ave | 0.17mi | 4/2.0 (+1) | 1,344 (-9%) | 21mo | $172,000 | $128 | 55 |
| 5599 S Glenn Acres Ter | 0.48mi | 3/2.0 | 1,678 (+14%) | 2mo | $225,000 | $134 | 52 |
| 5442 S Glenn Acres Ter | 0.48mi | 4/2.0 (+1) | 1,344 (-9%) | 10mo | $200,000 | $149 | 50 |
| 5384 W Starburst Ln | 0.49mi | 3/2.0 | 1,294 (-12%) | 13mo | $177,900 | $137 | 46 |
Match score weights: distance 35% · size 25% · config 20% · recency 20%. Top-matched comps best support the ARV.
Projected returns pro-forma
-3.0% appreciation · 3.0% rent growth · sell at horizon
- IRR
- 17.4%
- Equity multiple
- 1.70×
- Total profit
- $26,612
- Equity at exit
- $20,114
- IRR
- 25.9%
- Equity multiple
- 3.26×
- Total profit
- $85,456
- Equity at exit
- $11,664
Cash invested: $37,772 (down + closing). Projections, not guarantees.
Landlord ↔ Tenant lean methodology
- Overall (STATE)
- 87 Strongly Landlord-Friendly
- State Florida
- 87 Strongly Landlord-Friendly · R+3
- County
- — inherits STATE
- City
- — inherits STATE
ZIP-level market 34446
- Home prices YoY
- -10.4%
- Active inventory
- 582
- Price-to-rent
- 5.7×
Monthly cashflow live
- Estimated rent
- $1,984 medium interval (Pro) →
- Mortgage (P&I)
- −$707
- Tax from tax record
- −$42 /mo · $505/yr
- Insurance
- −$56
- HOA
- −$0
- Vacancy / Maint / Mgmt
- −$417
- Net cashflow
- $762
Break-even live
UW: 25.0% down · 7.5% · 30yr · 1.5% tax · 5.0% vac · 8.0% maint · 8.0% mgmt
Financing live
Cash to close
- Down payment
- $33,725
- Closing costs
- $4,047
- Reserves months
- —
- Total cash needed
- —
Loan-product check · same deal, 3 products live
Conventional
25% down · 7.5% · 30yr
- Down + closing
- —
- Monthly P&I
- —
- Monthly cashflow
- —
- DSCR
- —
- Eligible?
- —
Personal DTI + credit; lowest rate.
DSCR
20% down · 8.5% · 30yr
- Down + closing
- —
- Monthly P&I
- —
- Monthly cashflow
- —
- DSCR
- —
- Eligible?
- —
No personal income docs; deal must DSCR.
Hard money
10% down · 12.0% · 12mo
- Down + closing
- —
- Monthly P&I
- —
- Monthly cashflow
- —
- DSCR
- —
- Eligible?
- —
Short-term bridge; refi at stabilization.
Listing history 19 events
-
2026-06-19days on market $134,900 Active 163 DOM
-
2026-06-18days on market $134,900 Active 162 DOM
-
2026-06-17days on market $134,900 Active 161 DOM
-
2026-06-16days on market $134,900 Active 160 DOM
-
2026-06-15days on market $134,900 Active 159 DOM
-
2026-06-14days on market $134,900 Active 157 DOM
-
2026-06-13days on market $134,900 Active 156 DOM
-
2026-06-09days on market $134,900 Active 153 DOM
-
2026-06-08days on market $134,900 Active 152 DOM
-
2026-06-03days on market $134,900 Active 147 DOM
-
2026-06-02days on market $134,900 Active 146 DOM
-
2026-06-01days on market $134,900 Active 145 DOM
-
2026-05-31days on market $134,900 Active 144 DOM
-
2026-05-30days on market $134,900 Active 143 DOM
-
2026-05-13price $134,900
-
2026-01-07$140,000 Active
-
2006-04-10soldstatus $80,000
-
2005-02-04soldstatus $79,900
-
1987-06-01soldstatus $50,000
ⓘ Source: listings_history table (triggers on properties + properties_extension) + one-shot
backfill from property_details.listing_events for pre-trigger history.
Tax reassessment forecast FL · Resets to sale price
- Current annual tax
- $505 · $42/mo
- Projected year-2 tax
- $1,120 · $93/mo
- Expected delta
- +$615/yr (+$51/mo · 121.8%)
ⓘ Screening estimate from a state-policy table — verify with the county assessor before closing.
Climate risk First Street
- Flood 1/10 Low FEMA zone X (unshaded) · 0% chance over 30 yrs
- Wildfire 3/10 Moderate
- Heat 10/10 Extreme 7 d/yr ≥108°F today · 25 d/yr by 30 yrs out
- Wind 9/10 Extreme 99% chance of damaging wind over 30 yrs
- Air quality 1/10 Low 0 unhealthy d/yr today · 0 by 30 yrs out
Nearby sold comps map
Loading sold comps map…
Walkable amenities ~0.75 mi
Loading nearby amenities…
Taxation est. · year 1
- Rental income
- $23,810
- − Mortgage interest
- −$7,556
- − Property taxes
- −$505
- − Insurance
- −$674
- − Repairs & maintenance
- −$1,905
- − Management
- −$1,905
- − Depreciation
- −$3,924
- Taxable income
- $7,340
- Est. tax owed @ 24.0%
- −$1,762
- After-tax cash flow
- $7,380/yr
For passive investors: Depreciation is non-cash, so a rental often shows a tax loss while cash-flowing — sheltering income. Rental losses are passive: they offset passive income freely, and up to $25,000/yr can offset ordinary (W-2) income if you actively participate and your MAGI is under $100k (phasing out to $0 by $150k); unused losses carry forward. On sale, claimed depreciation is recaptured at up to 25%, and gains may owe capital-gains tax (a 1031 exchange can defer both). Figures are a year-1 estimate at your 24.0% rate — not tax advice; consult a CPA.
Schools (NCES district)
- District
- Citrus
- NCES district ID
- 1200270
- Math proficiency
- 49% ▼ -10.00%
- Reading proficiency
- 50% ▼ -6.00%
- Median HH income
- $38,618
- Composite
- 41.28/100
- National rank
- #3519
- State rank
- #44 of 73 in FL
Livability — Homosassa Springs
- Score
- 71/100
- State rank
- #391
- US rank
- #6877
Category grades
Schools grade is shown separately in the Schools card above.
Census & demographics
- Census place
- Homosassa Springs, FL
- County
- Citrus County · 111,314 people
- City population
- 18,797
- Metro
- Homosassa Springs, FL
- Population (ZIP)
- 19,102
- Household income
- $58,802
- Rent vs Own
- Severe rent burden
- 121.0
Population outlook (Citrus County) Hauer SSP2
- Today (2025)
- 138,622 people
- By 2030
- 136,886 · -1.3%
- By 2040
- 132,009 · -4.8%
- By 2050
- 125,196 · -9.7%
- By 2075
- 108,570 · -21.7%
- By 2100
- 84,454 · -39.1%
Race, ethnicity, and origin ACS 2023
- Neighborhood character
- Predominantly White (87%)
- Race & ethnicity
- White 87% Two or more races 8% Hispanic / Latino 6%
- Hispanic origin (detail)
- Mexican 2% Puerto Rican 3%
- Common ancestry
- Romanian 4% Lithuanian 4% Slovak 3%
- Foreign-born
- 5% · Canada
- Languages at home
- 95% English-only · Spanish 4%
Political lean MEDSL · Citrus
- 2024 margin
- Solid R (+45.9) · D 26.8% · R 72.6%
- 2008→2024 swing
- -29.8pp toward R · 2008: -16.1pp · 2024: -45.9pp
- All cycles
- 2024: R+45.9 2020: R+41.0 2016: R+39.7 2012: R+21.9 2008: R+16.1
Not yet ingested
- Civics
- —
Market trends
- HPI YoY
- ▼ -32.11%
- Current HPI
- 277.2576
- Rent YoY
- —
- Metro
- Homosassa Springs, FL
- State GDP YoY
- ▲ 3.28%
- F500 in state
- 36
Industry mix (Fortune 500 HQ in FL)
| Industry | F500 HQs | Revenue |
|---|---|---|
| Industrial Technology | 2 | $29B |
|
||
| Insurance | 2 | $17B |
|
||
| Retail | 1 | $60B |
|
||
| Technology Distribution | 1 | $58B |
|
||
| Homebuilding | 1 | $35B |
|
||
| Technology Manufacturing | 1 | $35B |
|
||
Price history
+169.8% since first listed5 events — show timeline
- 2026-05-13 Price Changed $134,900 RACC
- 2026-01-07 Listed $140,000 RACC
- 2006-04-10 Sold (Public Records) $80,000 Public Records
- 2005-02-04 Sold (Public Records) $79,900 Public Records
- 1987-06-01 Sold (Public Records) $50,000 Public Records
Property tax history
+5.7%/yrLatest (2025): $505 · +14.7% YoY. Source: county tax records.
Cash-flow waterfall
monthlySold comps — $/sqft
last 12 mo · ≤1 miLoading sold comps…