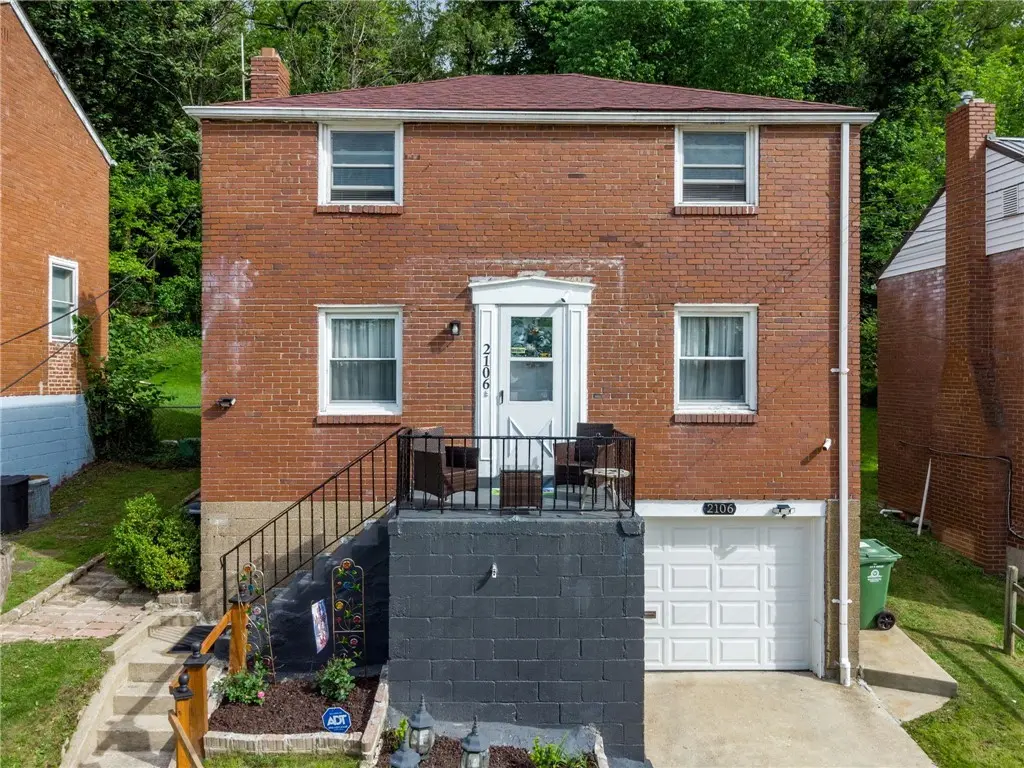
2106 Lindsay Rd · Wilkinsburg, PA
Flood risk 1/10 · Minimal
- FEMA flood zone
- X (unshaded)
- Chance of flooding over 30 yrs
- 0.0%
- Est. flood insurance / yr
- $473 – $860
Fire risk 1/10 · Minimal
- Est. fire insurance / yr
- $511 – $949
Heat risk 3/10 · Minor
- Hot days now (above 96°F)
- 6 days/yr
- Hot days in 30 yrs
- 13 days/yr
Wind risk 2/10 · Minimal
- Chance of severe wind over 30 yrs
- —
Air-quality risk 4/10 · Minor
- Unhealthy air days now
- 4 days/yr
- Unhealthy air days in 30 yrs
- 5 days/yr
Risk factors via First Street. Map © Google.
Why this score? — see what drove the C- grade
The composite is a weighted blend of 9 inputs, each scored 0–100. Each bar is that input's sub-score; the figure is the points it added to the 100-point composite (weight × sub-score).
- Cash flow +24.7/30.0
- DSCR +8.0/10.0
- 1% rule +5.6/10.0
- Livability +3.8/5.0
- Rent growth +3.5/5.0
- ARV discount +3.0/15.0
- Condition / age +2.5/5.0
- Schools +1.5/10.0
- Appreciation +0.0/10.0
$150,000
🖨 Deal sheet 📄 Offer letter ✓ Due diligence
Listing remarks
Sink your teeth into this classic post-World War II brick home which captures the timeless architectural integrity and robust craftsmanship of a transformative era in American housing. Spanning an incredibly efficient and thoughtfully optimized 1,092 square feet of interior living space, this charming residence offers a harmonious blend of mid-century character and essential modern upgrades, making it an exceptional find for anyone seeking a solid, low-maintenance property in the Steel City. From the moment you arrive, the handsome and enduring all-brick exterior commands attention, showcasing the superior durability, natural insulation, and permanent curb appeal that defined the post-war b
Key facts
- Newer furnace
- Newer roof
- Updated windows
Tags
Property features AI
Exterior
- Parking: Attached garage with built-in parking and garage door opener; 1 total parking space
- Utilities: Public water; Public sewer
- Home design: 2 stories; Resale property; Asphalt roof; Brick construction
- Construction: Brick exterior; Asphalt roof; Full basement
- Exterior features: Public transportation access
Interior
- Kitchen: Dishwasher; Disposal; Microwave; Refrigerator; Stove; Some electric appliances
- Bedrooms: Upper bedroom (11 x 11); Upper bedroom (10 x 8); Upper bedroom (14 x 10)
- Flooring: Hardwood; Carpet
- Bathrooms: 1 full bathroom
- Heating & cooling: Forced air heating (gas); Central air conditioning
- Interior features: Screens and window treatments; Full walk-out basement
- Laundry & utility: Basement laundry
Neighborhood map
What this means for you Summary
Snapshot
- This is a 3-bed/1.0-bath single-family listed at $150k.
Deal economics
- At list price, monthly cash flow is $312 ($4k/yr) — positive.
- The deal already cash-flows at list — no discount required.
- Meets the 1% rule at list price ($2k rent vs $150k).
- Recommended offer: $148k (1.5% below list) — sets the bar for market timing.
- Cap rate 8.8% vs local median 11.3% in Wilkinsburg — below-typical yield; the buyer is paying a premium for something (appreciation thesis, condition, location) that the cap rate doesn't capture.
Location & tenants
- Location reads 76/100 on livability (#411 in PA, #3,754 nationally) — a middle-class / working-renter tenant base. Strengths: commute A+, cost of living A+, housing A+; Watch: schools D+, health & safety D+, crime F.
- Wilkinsburg Borough SD (suburban): math 14% / reading 23% proficiency, ranked #503 of 539 in PA (top 93%) — low school quality limits family demand, transient renter base, plan for 1-2y turnover; 96% free/reduced lunch — lower-income household profile, screen leases tightly.
- Market conditions: Rents rising (+3.9%/yr); 118 active listings in the ZIP; 22 comparable units currently listed for rent nearby; rentals at typical pace (median 14d on market — plan ~3-4 weeks tenant-placement turnaround); 2,996 units permitted in Allegheny County in 2024 (1,588 in 5+ unit buildings).
- This rent runs 35% of the median local income ($55k/yr) — at the standard rent-burdened threshold; future hikes will face affordability resistance.
Forward outlook
- Local home prices are declining (-3.0%/yr); year-one equity from $1k of loan paydown is wiped out by about $4k of value loss. Plan a longer hold.
Negotiation context
- It's been on market 23 days — a 2% lower offer ($148k) is reasonable based on typical stale-listing flexibility.
Risks & watch-outs
- Watch-outs: built in 1950 — expect roof / HVAC / electrical / plumbing capex.
Questions for the listing agent
- Built in 1950 — when were the roof, HVAC, electrical panel, plumbing, and water heater last replaced?
- Is there a deadline driving the sale (1031 exchange, divorce, estate, relocation)? That informs how much negotiation room exists.
- Schools are D-rated, which usually means shorter tenancies and higher turnover. Who's the typical renter profile here, and what's been the actual vacancy rate?
- Crime grade is F in this area — have there been break-ins, vandalism, or insurance claims at this property in the last 3 years? What carrier currently insures it and at what premium?
- What's the average days-on-market for RENTAL listings here right now (not sales)? A rising rental-DOM trend means longer vacancies and softer asking-rent achievability than the comps imply.
- What's the recent tenant-quality profile in this submarket — average credit score on applications, eviction rate, late-payment / NSF rate, and stable-employment percentage? A property-management company in the area should have these aggregated.
- How much new for-sale + rental construction is in the pipeline within 1–3 miles? Heavy new supply typically softens prices + rents 12–24 months out; constrained supply supports both.
Investment metrics
- 1% rule
- 1.06% ✓
- Cap rate
- 8.79%
- Cash-on-cash
- 8.91%
- DSCR
- 1.40
- GRM
- 7.9
CMA / ARV
- ARV (on-the-fly)
- $136,500
- Comps found
- 12
Show comp detail 12 sales within ~0.75 mi
| Address | Dist | Beds/Ba | Sqft | Sold | Price | $/sf | Match |
|---|---|---|---|---|---|---|---|
| 2165 Lindsay Rd | 0.09mi | 3/1.0 | 1,092 (0%) | 3mo | $150,000 | $137 | 94 |
| 1533 Williamsburg Pl | 0.33mi | 2/1.5 (-1) | 1,092 (0%) | 2mo | $185,000 | $169 | 76 |
| 1074 Osage Dr | 0.33mi | 3/1.5 | 1,135 (+4%) | 2mo | $219,900 | $194 | 75 |
| 2070 Boggs Ave | 0.13mi | 2/2.0 (-1) | 1,144 (+5%) | 3mo | $140,000 | $122 | 74 |
| 29 Barton Dr | 0.41mi | 2/2.0 (-1) | 1,102 (+1%) | 4mo | $128,000 | $116 | 67 |
| 2205 Chalfant St | 0.37mi | 2/1.0 (-1) | 1,044 (-4%) | 8mo | $102,500 | $98 | 64 |
| 1938 Laketon Rd | 0.26mi | 2/1.0 (-1) | 968 (-11%) | 2mo | $17,504 | $18 | 63 |
| 1608 Clark St | 0.53mi | 3/1.0 | 1,170 (+7%) | 9mo | $62,500 | $53 | 56 |
| 1521 Weinman St | 0.56mi | 2/1.0 (-1) | 1,000 (-8%) | 8mo | $25,000 | $25 | 48 |
| 2506 Collins Rd | 0.50mi | 2/1.5 (-1) | 1,000 (-8%) | 10mo | $215,000 | $215 | 48 |
| 1358 Laketon Rd | 0.69mi | 3/2.5 | 1,160 (+6%) | 8mo | $145,000 | $125 | 45 |
| 2036 Sampson St | 0.74mi | 3/2.0 | 1,218 (+12%) | 1mo | $162,000 | $133 | 41 |
Match score weights: distance 35% · size 25% · config 20% · recency 20%. Top-matched comps best support the ARV.
Projected returns pro-forma
-3.0% appreciation · 3.86% rent growth · sell at horizon
- IRR
- -1.9%
- Equity multiple
- 0.93×
- Total profit
- $-3,102
- Equity at exit
- $22,365
- IRR
- 8.6%
- Equity multiple
- 1.68×
- Total profit
- $28,497
- Equity at exit
- $12,969
Cash invested: $42,000 (down + closing). Projections, not guarantees.
Landlord ↔ Tenant lean methodology
- Overall (STATE)
- 62 Landlord-Friendly
- State Pennsylvania
- 62 Landlord-Friendly · EVEN
- County
- — inherits STATE
- City
- — inherits STATE
ZIP-level market 15221
- Home prices YoY
- -32.3%
- Rents YoY
- 3.9%
- Active inventory
- 118
- Price-to-rent
- 7.9×
Monthly cashflow live
- Estimated rent
- $1,584 high interval (Pro) →
- Mortgage (P&I)
- −$787
- Tax from tax record
- −$91 /mo · $1,086/yr
- Insurance
- −$62
- HOA
- −$0
- Vacancy / Maint / Mgmt
- −$333
- Net cashflow
- $312
Break-even live
UW: 25.0% down · 7.5% · 30yr · 1.5% tax · 5.0% vac · 8.0% maint · 8.0% mgmt
Financing live
Cash to close
- Down payment
- $37,500
- Closing costs
- $4,500
- Reserves months
- —
- Total cash needed
- —
Loan-product check · same deal, 3 products live
Conventional
25% down · 7.5% · 30yr
- Down + closing
- —
- Monthly P&I
- —
- Monthly cashflow
- —
- DSCR
- —
- Eligible?
- —
Personal DTI + credit; lowest rate.
DSCR
20% down · 8.5% · 30yr
- Down + closing
- —
- Monthly P&I
- —
- Monthly cashflow
- —
- DSCR
- —
- Eligible?
- —
No personal income docs; deal must DSCR.
Hard money
10% down · 12.0% · 12mo
- Down + closing
- —
- Monthly P&I
- —
- Monthly cashflow
- —
- DSCR
- —
- Eligible?
- —
Short-term bridge; refi at stabilization.
Rent comps 22 comps
| Address | Beds | Baths | Sqft | Rent | $/sqft | DOM | Units | Dist |
|---|---|---|---|---|---|---|---|---|
| 2031 Chalfant St Pittsburgh, PA | 3.0 | 1.5 | 1150 | $1,950 | $1.70 | 43d | 1 | 0.22mi |
| 7534 Penn Bridge Ct Pittsburgh, PA | 2.0 | 2.0 | 1259 | $1,750 | $1.39 | 43d | 1 | 0.29mi |
| 7215 Beacon Hill Dr Pittsburgh, PA | 2.0 | 2.0 | 1259 | $1,795 | $1.43 | 4d | 1 | 0.43mi |
| 1713-1715 Clark St Unit 79-1804C Pittsburgh, PA | 2.0 | 1.0 | 972 | $1,200 | $1.23 | 4d | 1 | 0.48mi |
| 1515 Penn Ave Wilkinsburg, PA | 2.0 | 2.0 | 1012 | $1,100 | $1.09 | 43d | 1 | 0.55mi |
| 648 Southern Ave Penn Hills, PA | 3.0 | 1.0 | 1100 | $1,600 | $1.45 | 7d | 1 | 0.77mi |
| 610 Churchill Ave Pittsburgh, PA | 3.0 | 1.0 | 1100 | $1,395 | $1.27 | 1d | 1 | 0.87mi |
| 100 Bryn Mawr Ct W Pittsburgh, PA | 1.0–2.0 | 1.0–2.0 | 975 | $1,904 | $1.95 | 2d | 15 | 0.89mi |
| 3005 Laketon Rd Pittsburgh, PA | 3.0 | 1.0 | 1100 | $1,295 | $1.18 | 14d | 1 | 0.90mi |
| 185 Howard St Pittsburgh, PA | 2.0 | 1.0 | 1000 | $1,250 | $1.25 | 43d | 1 | 0.93mi |
| 565 Ardmore Blvd Pittsburgh, PA | 4.0 | 1.0 | 1368 | $1,450 | $1.06 | 10d | 1 | 1.02mi |
| 8918 Frankstown Rd Pittsburgh, PA | 3.0 | 1.0 | 1400 | $1,907 | $1.36 | 14d | 1 | 1.06mi |
| 700 Filmore Rd Pittsburgh, PA | 3.0 | 2.0 | 1072 | $1,800 | $1.68 | 12d | 1 | 1.13mi |
| 641 Penny Dr Pittsburgh, PA | 3.0 | 1.5 | 1199 | $1,525 | $1.27 | 14d | 1 | 1.13mi |
| 314 Penn Vista Dr Pittsburgh, PA | 2.0 | 1.0 | 1150 | $1,250 | $1.09 | 43d | 1 | 1.16mi |
| 220 Briarwood Dr Pittsburgh, PA | 3.0 | 1.0 | 869 | $1,465 | $1.69 | 14d | 1 | 1.20mi |
| 209 Briarwood Dr Pittsburgh, PA | 3.0 | 2.0 | 1080 | $1,500 | $1.39 | 23d | 1 | 1.20mi |
| 62 Melvin Ct Penn Hills Township, PA | 1.0–2.0 | 1.0 | 825 | $1,549 | $1.88 | 7d | 2 | 1.22mi |
| 10043 Calvin St Pittsburgh, PA | 2.0 | 1.0 | 778 | $1,195 | $1.54 | 43d | 1 | 1.29mi |
| 150 Marshall Dr Pittsburgh, PA | 3.0 | 1.5 | 923 | $1,450 | $1.57 | 23d | 1 | 1.29mi |
| 8612 Oakcrest Rd Pittsburgh, PA | 2.0 | 1.0 | 1218 | $1,450 | $1.19 | 23d | 1 | 1.37mi |
| 826 Walnut St Pittsburgh, PA | 2.0 | 1.0 | 1270 | $1,195 | $0.94 | 43d | 1 | 1.43mi |
Listing history 15 events
-
2026-06-18days on market $150,000 Active 23 DOM
-
2026-06-17days on market $150,000 Active 22 DOM
-
2026-06-16days on market $150,000 Active 21 DOM
-
2026-06-15days on market $150,000 Active 20 DOM
-
2026-06-13days on market $150,000 Active 18 DOM
-
2026-06-09pricedays on market $150,000 Active 14 DOM
-
2026-06-08days on market $155,000 Active 13 DOM
-
2026-06-07days on market $155,000 Active 12 DOM
-
2026-06-05days on market $155,000 Active 9 DOM
-
2026-06-03days on market $155,000 Active 8 DOM
-
2026-06-02days on market $155,000 Active 7 DOM
-
2026-06-02price $155,000 Active 6 DOM
-
2026-06-01days on market $160,000 Active 6 DOM
-
2026-05-31days on market $160,000 Active 5 DOM
-
2026-05-23$160,000 Active
ⓘ Source: listings_history table (triggers on properties + properties_extension) + one-shot
backfill from property_details.listing_events for pre-trigger history.
Tax reassessment forecast PA · Partial reset (capped growth)
- Current annual tax
- $1,086 · $91/mo
- Projected year-2 tax
- $1,728 · $144/mo
- Expected delta
- +$642/yr (+$53/mo · 59.1%)
ⓘ Screening estimate from a state-policy table — verify with the county assessor before closing.
Climate risk First Street
- Flood 1/10 Low FEMA zone X (unshaded) · 0% chance over 30 yrs
- Wildfire 1/10 Low
- Heat 3/10 Moderate 6 d/yr ≥96°F today · 13 d/yr by 30 yrs out
- Wind 2/10 Low
- Air quality 4/10 Moderate 4 unhealthy d/yr today · 5 by 30 yrs out
Nearby sold comps map
Loading sold comps map…
Walkable amenities ~0.75 mi
Loading nearby amenities…
Taxation est. · year 1
- Rental income
- $19,009
- − Mortgage interest
- −$8,402
- − Property taxes
- −$1,086
- − Insurance
- −$750
- − Repairs & maintenance
- −$1,521
- − Management
- −$1,521
- − Depreciation
- −$4,364
- Taxable income
- $1,365
- Est. tax owed @ 24.0%
- −$328
- After-tax cash flow
- $3,414/yr
For passive investors: Depreciation is non-cash, so a rental often shows a tax loss while cash-flowing — sheltering income. Rental losses are passive: they offset passive income freely, and up to $25,000/yr can offset ordinary (W-2) income if you actively participate and your MAGI is under $100k (phasing out to $0 by $150k); unused losses carry forward. On sale, claimed depreciation is recaptured at up to 25%, and gains may owe capital-gains tax (a 1031 exchange can defer both). Figures are a year-1 estimate at your 24.0% rate — not tax advice; consult a CPA.
Schools (NCES district)
- District
- Wilkinsburg Borough SD
- NCES district ID
- 4226370
- Math proficiency
- 14% ▼ -8.00%
- Reading proficiency
- 23% ▼ -9.00%
- Median HH income
- $32,204
- Composite
- 14.94/100
- National rank
- #9368
- State rank
- #503 of 539 in PA
Livability — Wilkinsburg
- Score
- 76/100
- State rank
- #411
- US rank
- #3754
Category grades
Schools grade is shown separately in the Schools card above.
Census & demographics
- Census place
- Wilkinsburg, PA
- County
- Allegheny County · 1,022,028 people
- City population
- 29,513
- Metro
- Pittsburgh, PA
- Population (ZIP)
- 29,374
- Household income
- $55,028
- Rent vs Own
- Severe rent burden
- 1933.0
Population outlook (Allegheny County) Hauer SSP2
- Today (2025)
- 1,250,282 people
- By 2030
- 1,256,482 · +0.5%
- By 2040
- 1,256,318 · +0.5%
- By 2050
- 1,244,169 · -0.5%
- By 2075
- 1,197,693 · -4.2%
- By 2100
- 1,093,187 · -12.6%
Race, ethnicity, and origin ACS 2023
- Neighborhood character
- Diverse neighborhood (Simpson 0.60)
- Race & ethnicity
- White 47% Black 43% Two or more races 7% Hispanic / Latino 4% Asian 1%
- Common ancestry
- Romanian 4% Lithuanian 2% Serbian 1%
- Foreign-born
- 4% · Canada, South Korea, China
- Languages at home
- 93% English-only · Spanish 2% French/Haitian/Cajun 1% Other Indo-European 1%
Political lean MEDSL · Allegheny
- 2024 margin
- Strong D (+20.3) · D 59.7% · R 39.4%
- 2008→2024 swing
- +4.8pp toward D · 2008: 15.5pp · 2024: 20.3pp
- All cycles
- 2024: D+20.3 2020: D+20.4 2016: D+16.4 2012: D+14.4 2008: D+15.5
Not yet ingested
- Civics
- —
Market trends
- HPI YoY
- ▼ -109.77%
- Current HPI
- 230.0486
- Rent YoY
- ▲ 3.86%
- Metro
- Pittsburgh, PA
- State GDP YoY
- ▲ 1.68%
- F500 in state
- 34
Industry mix (Fortune 500 HQ in PA)
| Industry | F500 HQs | Revenue |
|---|---|---|
| Healthcare | 2 | $309B |
|
||
| Insurance | 2 | $27B |
|
||
| Telecommunications / Media | 1 | $124B |
|
||
| Industrial Distribution | 1 | $22B |
|
||
| Financial Services | 1 | $20B |
|
||
| Chemicals / Materials | 1 | $18B |
|
||
Price history
1 event — show timeline
- 2026-05-23 Listed $160,000 West Penn MLS
Property tax history
-2.2%/yrLatest (2026): $1,086 · +3.0% YoY. Source: county tax records.
Cash-flow waterfall
monthlySold comps — $/sqft
last 12 mo · ≤1 miLoading sold comps…