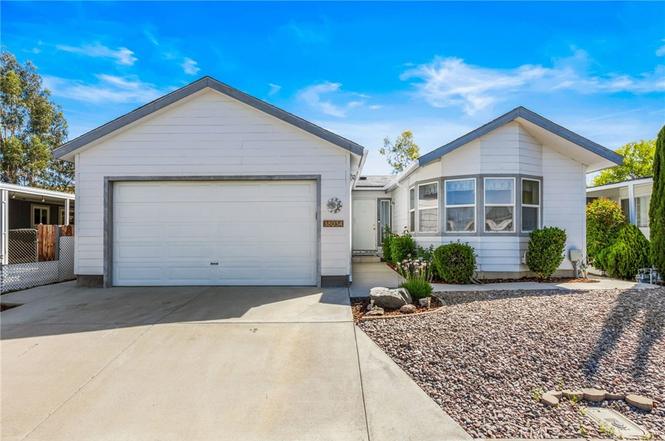
38034 Via Del Largo · Murrieta, CA
Flood risk 1/10 · Minimal
- FEMA flood zone
- D
- Chance of flooding over 30 yrs
- 0.0%
- Est. flood insurance / yr
- $544 – $1,084
Fire risk 6/10 · Moderate
- Est. fire insurance / yr
- $659 – $1,223
Heat risk 7/10 · Major
- Hot days now (above 105°F)
- 7 days/yr
- Hot days in 30 yrs
- 21 days/yr
Wind risk 1/10 · Minimal
- Chance of severe wind over 30 yrs
- —
Air-quality risk 5/10 · Moderate
- Unhealthy air days now
- 7 days/yr
- Unhealthy air days in 30 yrs
- 8 days/yr
Risk factors via First Street. Map © Google.
Why this score? — see what drove the F grade
The composite is a weighted blend of 9 inputs, each scored 0–100. Each bar is that input's sub-score; the figure is the points it added to the 100-point composite (weight × sub-score).
- Cash flow +12.1/30.0
- Schools +5.3/10.0
- DSCR +3.6/10.0
- Livability +3.4/5.0
- 1% rule +3.3/10.0
- Rent growth +2.8/5.0
- Condition / age +2.5/5.0
- ARV discount +0.0/15.0
- Appreciation +0.0/10.0
$409,000
🖨 Deal sheet (PDF) 📄 Offer letter ✓ Due diligence
Listing remarks MLS
Beautiful move-in-ready home located in the 55+ community of Warm Springs Knolls. Open floorpan boasts 3 bedrooms including master suite with access to back patio. No rear neighbors. With lots of windows, and new flooring throughout the main living areas, this home is light and bright. 2 car attached garage w 433a permanent foundation and drywall (no paneling here folks :) - this home is a find! New water heater. Own your land. Qualifies for conventional, FHA, or VA loans. Low taxes & HOA. The clubhouse has a number of facilities including a pool, spa, kitchen and dining room + organized activities such as lunches, travel outings, physical fitness groups, and more. Golf course nearby. Easy access to shopping, freeways, grocery stores.
Key facts
- Open floor plan
- No rear neighbors
- Natural light
Tags
Property features AI
Finance
- Other: Property located in Warm Springs Knolls park; Directions available from 215 via Murrieta Hot Springs Road
- HOA & community: Part of an association with a $95 monthly fee; Community amenities include a pool; Located in a senior community
Exterior
- Parking: Attached 2-car garage; Two total parking spaces
- Utilities: Public sewer; District/public water
- Home design: Single-story property; Mobile home remains on site
- Construction: Year built (per public records)
- Exterior features: Community/association pool; Close to clubhouse
Interior
- Kitchen: Kitchen island; Refrigerator; Dishwasher
- Bathrooms: Two full bathrooms with bathtub
- Heating & cooling: Central cooling; Central furnace heating
- Interior features: One-level home with front-door entry
- Laundry & utility: Dedicated laundry room; Washer hookup; Electric dryer hookup
Neighborhood map
What this means for you Summary
Snapshot
- This is a 3-bed/2.0-bath manufactured listed at $409k.
Deal economics
- At list price, monthly cash flow is $-88 ($-1k/yr) — negative.
- To cash-flow at today's rent, offer at most $393k (3.8% below list).
- To meet the 1% rule (rent ≥ 1% of price), the offer needs to be $341k (16.5% below list).
- Recommended offer: $341k (16.5% below list) — sets the bar for 1% rule.
- Cap rate 6.0% vs local median 3.0% in Murrieta — top-decile yield for the area; either an underpriced asset or a hidden risk that comps aren't pricing in. Stress-test before assuming the spread holds.
Location & tenants
- Location reads 68/100 on livability (#279 in CA) — a middle-class / working-renter tenant base. Strengths: amenities A+, employment A+, housing A+; Watch: health & safety D+, commute F, cost of living F.
- Murrieta Valley Unified (suburban): math 51% / reading 64% proficiency, ranked #255 of 1,400 in CA (top 18%) — acceptable for families but not a draw, mixed tenant base, ~2y average lease.
- Zoned schools: Monte Vista Elementary (784 students, 53% FRL); Dorothy Mcelhinney Middle (1,396 students, 44% FRL); Vista Murrieta High (3,493 students, 46% FRL) — zoned schools average 48% FRL vs 23% district-wide (25 pts higher); higher-poverty schools than district average — tighter screening recommended.
- Market conditions: Rents rising (+1.0%/yr); 239 active listings in the ZIP; 25 comparable units currently listed for rent nearby; rentals at typical pace (median 26d on market — plan ~3-4 weeks tenant-placement turnaround); high-income renter base; 9,195 units permitted in Riverside County in 2024 (1,512 in 5+ unit buildings).
- This rent runs 33% of the median local income ($125k/yr) — at the standard rent-burdened threshold; future hikes will face affordability resistance.
Forward outlook
- Local home prices are declining (-3.0%/yr); year-one equity from $3k of loan paydown is wiped out by about $12k of value loss. Plan a longer hold.
- Riverside County population projected at +22% by 2050 — long-run rental-demand tailwind backs the buy-and-hold thesis.
Negotiation context
- Only 11 days on market — expect competitive offers; lowballing is unlikely to land.
- 3 sale attempts since 5y ago with the ask held roughly flat each time — persistent listings suggest the price (not the market) is what's stuck; bring a comps-based counter.
Risks & watch-outs
- Climate carrying-cost: major wildfire risk; extreme-heat days projected 7→21/yr by 2055 (HVAC capex compounding) — expect insurance premiums to compound above CPI over the hold.
Questions for the listing agent
- What do current leases actually rent for vs. the listed asking? Can we see a recent rent roll and the last 12 months of T-12 income?
- What does the HOA fee cover, when was the last increase, and are there any pending special assessments or reserve-fund shortfalls?
- Is there a deadline driving the sale (1031 exchange, divorce, estate, relocation)? That informs how much negotiation room exists.
- Schools are B-rated — typically a magnet for longer-tenancy family renters. What's the average tenant stay here, and is there a school-zone premium baked into asking?
- The area grade is low — what's the realistic commute time and amenity access for the typical tenant pool here? Any planned neighborhood developments (good or bad) we should know about?
- What's the average days-on-market for RENTAL listings here right now (not sales)? A rising rental-DOM trend means longer vacancies and softer asking-rent achievability than the comps imply.
- What's the recent tenant-quality profile in this submarket — average credit score on applications, eviction rate, late-payment / NSF rate, and stable-employment percentage? A property-management company in the area should have these aggregated.
- How much new for-sale + rental construction is in the pipeline within 1–3 miles? Heavy new supply typically softens prices + rents 12–24 months out; constrained supply supports both.
Investment metrics
- 1% rule
- 0.83% ✗
- Cap rate
- 6.03%
- Cash-on-cash
- -0.92%
- DSCR
- 0.96
- GRM
- 10.0
CMA / ARV
- ARV (on-the-fly)
- $345,600
- Comps found
- 12
Show comp detail 12 sales within ~0.75 mi
| Address | Dist | Beds/Ba | Sqft | Sold | Price | $/sf | Match |
|---|---|---|---|---|---|---|---|
| 37967 Via La Colina | 0.08mi | 3/2.0 | 1,512 (+5%) | 0mo | $439,250 | $291 | 88 |
| 38212 Via La Colina | 0.22mi | 2/2.0 (-1) | 1,440 (0%) | 1mo | $345,000 | $240 | 84 |
| 38171 Via La Colina | 0.18mi | 2/2.0 (-1) | 1,392 (-3%) | 0mo | $138,000 | $99 | 80 |
| 28925 Calle Alta | 0.35mi | 2/2.0 (-1) | 1,440 (0%) | 2mo | $255,550 | $177 | 77 |
| 38070 Via La Colina | 0.08mi | 3/2.0 | 1,232 (-14%) | 5mo | $379,900 | $308 | 68 |
| 38195 Via Taffia | 0.37mi | 2/2.0 (-1) | 1,368 (-5%) | 2mo | $345,000 | $252 | 67 |
| 28698 Via Princesa | 0.46mi | 3/2.0 | 1,296 (-10%) | 2mo | $278,215 | $215 | 60 |
| 38619 Calle De La Siesta | 0.62mi | 3/2.0 | 1,344 (-7%) | 3mo | $390,000 | $290 | 58 |
| 38069 Calle De Amor | 0.45mi | 2/2.0 (-1) | 1,560 (+8%) | 3mo | $205,000 | $131 | 58 |
| 38038 Calle De Amor | 0.47mi | 2/2.0 (-1) | 1,536 (+7%) | 6mo | $346,000 | $225 | 57 |
| 38190 Camino Cinife | 0.64mi | 2/2.0 (-1) | 1,512 (+5%) | 2mo | $500,000 | $331 | 55 |
| 38240 Calle Arrebol | 0.43mi | 2/2.0 (-1) | 1,632 (+13%) | 4mo | $292,700 | $179 | 49 |
Match score weights: distance 35% · size 25% · config 20% · recency 20%. Top-matched comps best support the ARV.
Projected returns pro-forma
-3.0% appreciation · 1.01% rent growth · sell at horizon
- IRR
- -20.0%
- Equity multiple
- 0.31×
- Total profit
- $-78,562
- Equity at exit
- $60,983
- IRR
- -17.9%
- Equity multiple
- 0.11×
- Total profit
- $-101,957
- Equity at exit
- $35,363
Cash invested: $114,520 (down + closing). Projections, not guarantees.
Landlord ↔ Tenant lean methodology
- Overall (STATE)
- 18 Strongly Tenant-Friendly
- State California
- 18 Strongly Tenant-Friendly · D+13
- County
- — inherits STATE
- City
- — inherits STATE
ZIP-level market 92563
- Home prices YoY
- -17.8%
- Rents YoY
- 1.0%
- Active inventory
- 239
- Price-to-rent
- 10.0×
Monthly cashflow live
- Estimated rent
- $3,414 high interval (Pro) →
- Mortgage (P&I)
- −$2,145
- Tax from tax record
- −$375 /mo · $4,500/yr
- Insurance
- −$170
- HOA
- −$95
- Vacancy / Maint / Mgmt
- −$717
- Net cashflow
- $-88
Break-even live
Sensitivity live
| Price | -10% $143 | -5% $28 | +0% $-88 | +5% $-204 | +10% $-320 |
|---|---|---|---|---|---|
| Rent | -10% $-358 | -5% $-223 | +0% $-88 | +5% $47 | +10% $182 |
| Rate | -1.0pp $118 | -0.5pp $16 | base $-88 | +0.5pp $-194 | +1.0pp $-302 |
UW: 25.0% down · 7.5% · 30yr · 1.5% tax · 5.0% vac · 8.0% maint · 8.0% mgmt
Financing live
Cash to close
- Down payment
- $102,250
- Closing costs
- $12,270
- Reserves months
- —
- Total cash needed
- —
Loan-product check · same deal, 3 products live
Conventional
25% down · 7.5% · 30yr
- Down + closing
- —
- Monthly P&I
- —
- Monthly cashflow
- —
- DSCR
- —
- Eligible?
- —
Personal DTI + credit; lowest rate.
DSCR
20% down · 8.5% · 30yr
- Down + closing
- —
- Monthly P&I
- —
- Monthly cashflow
- —
- DSCR
- —
- Eligible?
- —
No personal income docs; deal must DSCR.
Hard money
10% down · 12.0% · 12mo
- Down + closing
- —
- Monthly P&I
- —
- Monthly cashflow
- —
- DSCR
- —
- Eligible?
- —
Short-term bridge; refi at stabilization.
Rent comps 25 comps
| Address | Beds | Baths | Sqft | Rent | $/sqft | DOM | Units | Dist |
|---|---|---|---|---|---|---|---|---|
| 39484 Via Montalvo Murrieta, CA | 3.0 | 2.5 | 1808 | $6,500 | $3.60 | 45d | 1 | 0.26mi |
| 39656 Columbia Union Dr Unit C Murrieta, CA | 3.0 | 2.0 | 1408 | $2,925 | $2.08 | 26d | 1 | 0.88mi |
| 39930 Whitewood Rd Murrieta, CA | 2.0 | 2.0 | 1015 | $2,410 | $2.37 | 0d | 11 | 0.94mi |
| 39668 Princeton Way Unit C Murrieta, CA | 3.0 | 2.0 | 1408 | $2,900 | $2.06 | 7d | 1 | 0.94mi |
| 25295 Shadescale Dr Murrieta, CA | 3.0 | 2.0 | 1368 | $2,950 | $2.16 | 26d | 1 | 0.96mi |
| 26137 Oakcreek Union Dr Unit C Murrieta, CA | 3.0 | 2.0 | 1408 | $2,950 | $2.10 | 1d | 1 | 0.98mi |
| 26133 Williams Way Murrieta, CA | 3.0 | 2.0 | 1408 | $3,100 | $2.20 | 45d | 1 | 1.00mi |
| 39875 Alpine Union St Unit B Murrieta, CA | 3.0 | 2.5 | 1654 | $2,795 | $1.69 | 45d | 1 | 1.04mi |
| 25268 Shadescale Dr Murrieta, CA | 4.0 | 2.0 | 1493 | $2,940 | $1.97 | 45d | 1 | 1.04mi |
| 39930 Alpine Union St Murrieta, CA | 3.0 | 2.5 | 1654 | $2,795 | $1.69 | 1d | 1 | 1.07mi |
| 28221 Via Princesa Unit 4 Murrieta, CA | 2.0 | 2.0 | 1000 | $1,950 | $1.95 | 45d | 1 | 1.11mi |
| 29677 Woodlands Ave Murrieta, CA | 3.0 | 2.0 | 1143 | $2,700 | $2.36 | 26d | 1 | 1.13mi |
| 29324 Calle Gaviota Murrieta, CA | 3.0 | 3.0 | 1854 | $3,150 | $1.70 | 45d | 1 | 1.23mi |
| 28611 Calle del Lago Murrieta, CA | 2.0 | 2.0 | 900 | $1,975 | $2.19 | 26d | 1 | 1.23mi |
| 28611 Calle Del Lago Unit c Murrieta, CA | 2.0 | 1.5 | 900 | $1,975 | $2.19 | 26d | 1 | 1.23mi |
| 40213 Calle Real Unit 40213 Murrieta, CA | 3.0 | 2.5 | 1427 | $2,795 | $1.96 | 7d | 1 | 1.27mi |
| 26440 Saint Ives Ct Murrieta, CA | 4.0 | 2.0 | 1740 | $3,495 | $2.01 | 6d | 1 | 1.28mi |
| 40120 Calle Yorba Vista Murrieta, CA | 3.0 | 2.5 | 1700 | $3,200 | $1.88 | 45d | 1 | 1.33mi |
| 40319 Calle Real Murrieta, CA | 3.0 | 2.5 | 1427 | $2,900 | $2.03 | 26d | 1 | 1.41mi |
| 39896 Snow Gum Ln Murrieta, CA | 4.0 | 2.0 | 1520 | $3,200 | $2.11 | 45d | 1 | 1.43mi |
| 40324 Calle Real Murrieta, CA | 2.0 | 2.5 | 1336 | $2,495 | $1.87 | 7d | 1 | 1.44mi |
| 24650 Morningstar Dr Murrieta, CA | 3.0 | 2.0 | 1444 | $2,995 | $2.07 | 16d | 1 | 1.44mi |
| 40358 Calle Real Murrieta, CA | 3.0 | 3.0 | 1427 | $2,795 | $1.96 | 45d | 1 | 1.45mi |
| 25100 Vista Murrieta Murrieta, CA | 1.0–3.0 | 1.0–2.0 | 893 | $2,702 | $3.03 | 0d | 51 | 1.47mi |
| 38245 Murrieta Hot Springs Rd Murrieta, CA | 1.0–3.0 | 1.0–2.0 | 1020 | $3,375 | $3.31 | 0d | 24 | 1.49mi |
HOA detail
- Monthly dues
- $95 · $1,140/yr
- Likely covers
- waterpool
Listing history 7 events
-
2026-06-21days on market $409,000 Active 11 DOM
-
2026-06-18days on market $409,000 Active 8 DOM
-
2026-06-17days on market $409,000 Active 7 DOM
-
2026-06-16days on market $409,000 Active 6 DOM
-
2026-06-15days on market $409,000 Active 5 DOM
-
2026-06-13remarks 699-char remark
-
2026-06-13$409,000 Active 3 DOM
ⓘ Source: listings_history table (triggers on properties + properties_extension) + one-shot
backfill from property_details.listing_events for pre-trigger history.
Tax reassessment forecast CA · Resets to sale price
- Current annual tax
- $4,500 · $375/mo
- Projected year-2 tax
- $4,500 · $375/mo
- Expected delta
- $0/yr ($0/mo · 0.0%)
ⓘ Screening estimate from a state-policy table — verify with the county assessor before closing.
Climate risk First Street
- Flood 1/10 Low FEMA zone D · 0% chance over 30 yrs
- Wildfire 6/10 Major
- Heat 7/10 Severe 7 d/yr ≥105°F today · 21 d/yr by 30 yrs out
- Wind 1/10 Low
- Air quality 5/10 Major 7 unhealthy d/yr today · 8 by 30 yrs out
Nearby sold comps map
Loading sold comps map…
Walkable amenities ~0.75 mi
Loading nearby amenities…
Taxation est. · year 1
- Rental income
- $40,969
- − Mortgage interest
- −$22,910
- − Property taxes
- −$4,500
- − Insurance
- −$2,045
- − Repairs & maintenance
- −$3,278
- − Management
- −$3,278
- − HOA
- −$1,140
- − Depreciation
- −$11,898
- Taxable loss
- −$8,079
- Est. tax savings @ 24.0%
- +$1,939
- After-tax cash flow
- $882/yr
For passive investors: Depreciation is non-cash, so a rental often shows a tax loss while cash-flowing — sheltering income. Rental losses are passive: they offset passive income freely, and up to $25,000/yr can offset ordinary (W-2) income if you actively participate and your MAGI is under $100k (phasing out to $0 by $150k); unused losses carry forward. On sale, claimed depreciation is recaptured at up to 25%, and gains may owe capital-gains tax (a 1031 exchange can defer both). Figures are a year-1 estimate at your 24.0% rate — not tax advice; consult a CPA.
Schools (NCES district)
- District
- Murrieta Valley Unified
- NCES district ID
- 0600029
- Math proficiency
- 51% ▲ 3.00%
- Reading proficiency
- 64% ▲ 4.00%
- Median HH income
- $78,615
- Composite
- 53.42/100
- National rank
- #3152
- State rank
- #255 of 1400 in CA
Livability — Murrieta
- Score
- 68/100
- State rank
- #279
- US rank
- #9348
Category grades
Schools grade is shown separately in the Schools card above.
Census & demographics
- Census place
- Murrieta, CA
- County
- Riverside County · 2,287,001 people
- City population
- 145,160
- Metro
- Riverside-San Bernardino-Ontario, CA
- Population (ZIP)
- 80,379
- Household income
- $125,397
- Rent vs Own
- Severe rent burden
- 1075.0
Population outlook (Riverside County) Hauer SSP2
- Today (2025)
- 2,664,475 people
- By 2030
- 2,802,692 · +5.2%
- By 2040
- 3,050,904 · +14.5%
- By 2050
- 3,256,783 · +22.2%
- By 2075
- 3,655,058 · +37.2%
- By 2100
- 3,766,594 · +41.4%
Race, ethnicity, and origin ACS 2023
- Neighborhood character
- Highly diverse neighborhood (Simpson 0.71)
- Race & ethnicity
- White 41% Hispanic / Latino 32% Two or more races 17% Asian 13% Black 6%
- Hispanic origin (detail)
- Mexican 25%
- Common ancestry
- Lithuanian 2% Slovak 2% Italian 2%
- Foreign-born
- 18% · Canada, Vietnam, South Korea
- Languages at home
- 71% English-only · Spanish 17% Tagalog/Filipino 5% Other Indo-European 2%
Political lean MEDSL · Riverside
- 2024 margin
- Toss-up / Even · D 48.0% · R 49.3% · Other 2.6%
- 2008→2024 swing
- -3.6pp toward R · 2008: 2.3pp · 2024: -1.3pp
- All cycles
- 2024: R+1.3 2020: D+8.0 2016: D+4.3 2012: R+0.4 2008: D+2.3
Not yet ingested
- Civics
- —
Market trends
- HPI YoY
- ▼ -73.79%
- Current HPI
- 341.728
- Rent YoY
- ▲ 1.01%
- Metro
- Riverside-San Bernardino-Ontario, CA
- State GDP YoY
- ▲ 3.21%
- F500 in state
- 116
Industry mix (Fortune 500 HQ in CA)
| Industry | F500 HQs | Revenue |
|---|---|---|
| Technology | 27 | $1,492B |
|
||
| Financial Services | 3 | $174B |
|
||
| Retail | 3 | $44B |
|
||
| Insurance | 3 | $26B |
|
||
| Media / Entertainment | 2 | $115B |
|
||
| Pharmaceuticals / Biotech | 2 | $62B |
|
||
Price history
+1414.8% since first listed11 events — show timeline
- 2026-06-10 Listed $409,000 CRMLS
- 2021-05-13 Sold (Public Records) $370,000 Public Records
- 2021-05-13 Sold (MLS) $370,000 CRMLS
- 2021-05-10 Pending — CRMLS
- 2021-04-25 Contingent — CRMLS
- 2021-04-20 Relisted — CRMLS
- 2021-04-20 Listed $359,990 CRMLS
- 2021-04-17 Coming Soon $359,990 CRMLS
- 2004-10-08 Sold (Public Records) $259,000 Public Records
- 1999-05-07 Sold (Public Records) $18,000 Public Records
- 1990-04-27 Sold (Public Records) $27,000 Public Records
Property tax history
+3.9%/yrLatest (2025): $4,500 · +1.9% YoY. Source: county tax records.
Cash-flow waterfall
monthlySold comps — $/sqft
last 12 mo · ≤1 miLoading sold comps…