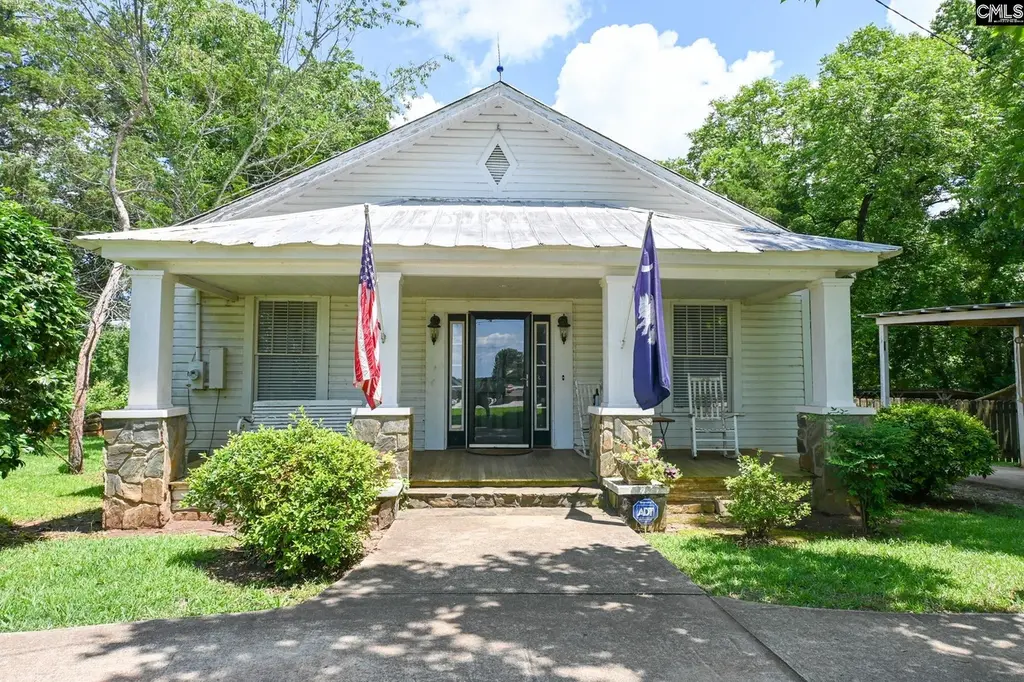
421 Spring Hill Rd · Gilbert, SC
Flood risk No data
- FEMA flood zone
- —
- Chance of flooding over 30 yrs
- —
- Est. flood insurance / yr
- —
Fire risk No data
- Est. fire insurance / yr
- —
Heat risk No data
- Hot days now (above threshold)
- —
- Hot days in 30 yrs
- —
Wind risk No data
- Chance of severe wind over 30 yrs
- —
Air-quality risk No data
- Unhealthy air days now
- —
- Unhealthy air days in 30 yrs
- —
Risk factors via First Street. Map © Google.
Why this score? — see what drove the C- grade
The composite is a weighted blend of 9 inputs, each scored 0–100. Each bar is that input's sub-score; the figure is the points it added to the 100-point composite (weight × sub-score).
- Cash flow +19.3/30.0
- ARV discount +7.5/15.0
- DSCR +6.1/10.0
- 1% rule +4.5/10.0
- Schools +4.2/10.0
- Livability +3.6/5.0
- Rent growth +3.3/5.0
- Condition / age +2.5/5.0
- Appreciation +0.0/10.0
$189,000
🖨 Deal sheet 📄 Offer letter ✓ Due diligence
Listing remarks
RARE FIND! Charming 1920s farmhouse situated on approximately ¾ of an acre, offering the perfect blend of historic character, country charm, and convenient access to Lake Murray, shopping, dining, and Lexington One schools! This inviting 3-bedroom, 2-bath home is filled with the warmth and personality that only a historic farmhouse can provide. Nestled on a spacious lot, you'll have plenty of room to garden, entertain, and even create your very own mini farm with space for chickens, goats, or other small animals. Enjoy peaceful country living while remaining just minutes from everyday conveniences. Whether you're relaxing on the property, growing your own vegetables, or embracing a h
Key facts
- Spacious lot
- Room to garden
- 0.75 acre lot
Tags
Property features AI
Finance
- Other: Property allows horses
Exterior
- Parking: Detached carport
- Utilities: Well water; Septic sewer
- Home design: Single-story home; Home faces west
- Construction: Wood exterior finish; Crawlspace foundation
- Exterior features: Covered front porch; Rear shed; Rear-only fencing
Interior
- Kitchen: Eat-in kitchen with bar and pantry; Formica countertops and painted cabinets; Countertop cooktop and double oven; Dishwasher
- Bedrooms: Master bedroom on main level with private bath, walk-in closet and hardwood floors; Second bedroom on main level with shared bath, tub/shower and hardwood floors; Third bedroom on main level with shared bath, tub/shower and hardwood floors
- Flooring: Hardwood floors in bedrooms and living areas
- Bathrooms: Two full bathrooms
- Heating & cooling: Central cooling; Electric heating
- Interior features: Attic storage with attic access; Wood-burning fireplace (1); High ceilings throughout
- Laundry & utility: Main-level utility room with electric hookup for washer/dryer; Electric water heater
Neighborhood map
What this means for you Summary
Snapshot
- This is a 3-bed/1.5-bath other listed at $189k.
Deal economics
- At list price, monthly cash flow is $209 ($3k/yr) — positive.
- The deal already cash-flows at list — no discount required.
- To meet the 1% rule (rent ≥ 1% of price), the offer needs to be $180k (4.8% below list).
- Recommended offer: $180k (4.8% below list) — sets the bar for 1% rule.
Location & tenants
- Location reads 71/100 on livability (#52 in SC) — a middle-class / working-renter tenant base. Strengths: cost of living A+, housing A+, crime B; Watch: amenities F, commute F, health & safety F.
- Lexington 01 (suburban): math 42% / reading 53% proficiency, ranked #11 of 80 in SC (top 14%) — families likely to look elsewhere, expect single-tenant / working-renter base with shorter leases.
- Zoned schools: Rocky Creek Elementary (math 56% / reading 54%, grade C, #119 of 597 statewide, top 20%, 863 students, 18% FRL); Lexington High (math 69% / reading 92%, grade A, #23 of 196 statewide, top 11%, 2,410 students, 17% FRL).
- Zoned-school proficiency averages 68% at this address vs 48% district-wide (+20 pts) — the actual schools serving this property are materially stronger than the Lexington 01 average implies; a family-tenant draw the district grade alone would hide.
- Market conditions: Rents rising (+3.2%/yr); 694 active listings in the ZIP; solid renter incomes; 1,712 units permitted in Lexington County in 2024 (0 in 5+ unit buildings).
Forward outlook
- Local home prices are declining (-3.0%/yr); year-one equity from $1k of loan paydown is wiped out by about $6k of value loss. Plan a longer hold.
- Lexington County population projected at +26% by 2050 — long-run rental-demand tailwind backs the buy-and-hold thesis.
Negotiation context
- Only 11 days on market — expect competitive offers; lowballing is unlikely to land.
- Current owner paid $145k; 30% above their basis — modest negotiation headroom, anchor on the comps not their cost.
Risks & watch-outs
- Watch-outs: built in 1929 — expect roof / HVAC / electrical / plumbing capex.
Questions for the listing agent
- Built in 1929 — when were the roof, HVAC, electrical panel, plumbing, and water heater last replaced?
- Is there a deadline driving the sale (1031 exchange, divorce, estate, relocation)? That informs how much negotiation room exists.
- Schools are D-rated, which usually means shorter tenancies and higher turnover. Who's the typical renter profile here, and what's been the actual vacancy rate?
- What's the average days-on-market for RENTAL listings here right now (not sales)? A rising rental-DOM trend means longer vacancies and softer asking-rent achievability than the comps imply.
- What's the recent tenant-quality profile in this submarket — average credit score on applications, eviction rate, late-payment / NSF rate, and stable-employment percentage? A property-management company in the area should have these aggregated.
- How much new for-sale + rental construction is in the pipeline within 1–3 miles? Heavy new supply typically softens prices + rents 12–24 months out; constrained supply supports both.
Investment metrics
- 1% rule
- 0.95% ✗
- Cap rate
- 7.62%
- Cash-on-cash
- 4.73%
- DSCR
- 1.21
- GRM
- 8.8
CMA / ARV
No comps found within radius.
Projected returns pro-forma
-3.0% appreciation · 3.23% rent growth · sell at horizon
- IRR
- -8.7%
- Equity multiple
- 0.68×
- Total profit
- $-16,944
- Equity at exit
- $28,181
- IRR
- 1.1%
- Equity multiple
- 1.07×
- Total profit
- $3,961
- Equity at exit
- $16,341
Cash invested: $52,920 (down + closing). Projections, not guarantees.
Landlord ↔ Tenant lean methodology
- Overall (STATE)
- 90 Strongly Landlord-Friendly
- State South Carolina
- 90 Strongly Landlord-Friendly · R+6
- County
- — inherits STATE
- City
- — inherits STATE
ZIP-level market 29072
- Rents YoY
- 3.2%
- Active inventory
- 694
- Price-to-rent
- 8.8×
Monthly cashflow live
- Estimated rent
- $1,798 medium interval (Pro) →
- Mortgage (P&I)
- −$991
- Tax from tax record
- −$142 /mo · $1,705/yr
- Insurance
- −$79
- HOA
- −$0
- Vacancy / Maint / Mgmt
- −$378
- Net cashflow
- $209
Break-even live
UW: 25.0% down · 7.5% · 30yr · 1.5% tax · 5.0% vac · 8.0% maint · 8.0% mgmt
Financing live
Cash to close
- Down payment
- $47,250
- Closing costs
- $5,670
- Reserves months
- —
- Total cash needed
- —
Loan-product check · same deal, 3 products live
Conventional
25% down · 7.5% · 30yr
- Down + closing
- —
- Monthly P&I
- —
- Monthly cashflow
- —
- DSCR
- —
- Eligible?
- —
Personal DTI + credit; lowest rate.
DSCR
20% down · 8.5% · 30yr
- Down + closing
- —
- Monthly P&I
- —
- Monthly cashflow
- —
- DSCR
- —
- Eligible?
- —
No personal income docs; deal must DSCR.
Hard money
10% down · 12.0% · 12mo
- Down + closing
- —
- Monthly P&I
- —
- Monthly cashflow
- —
- DSCR
- —
- Eligible?
- —
Short-term bridge; refi at stabilization.
Listing history 9 events
-
2026-06-18days on market $189,000 Active 11 DOM
-
2026-06-17days on market $189,000 Active 10 DOM
-
2026-06-16days on market $189,000 Active 9 DOM
-
2026-06-15days on market $189,000 Active 8 DOM
-
2026-06-14days on market $189,000 Active 6 DOM
-
2026-06-10days on market $189,000 Active 3 DOM
-
2026-06-09days on market $189,000 Active 2 DOM
-
2026-06-07remarks 692-char remark
-
2026-06-07$189,000 Active 1 DOM
ⓘ Source: listings_history table (triggers on properties + properties_extension) + one-shot
backfill from property_details.listing_events for pre-trigger history.
Tax reassessment forecast SC · Resets to sale price
- Current annual tax
- $1,705 · $142/mo
- Projected year-2 tax
- $1,705 · $142/mo
- Expected delta
- $0/yr ($0/mo · 0.0%)
ⓘ Screening estimate from a state-policy table — verify with the county assessor before closing.
Nearby sold comps map
Loading sold comps map…
Walkable amenities ~0.75 mi
Loading nearby amenities…
Taxation est. · year 1
- Rental income
- $21,581
- − Mortgage interest
- −$10,587
- − Property taxes
- −$1,705
- − Insurance
- −$945
- − Repairs & maintenance
- −$1,726
- − Management
- −$1,726
- − Depreciation
- −$5,498
- Taxable loss
- −$607
- Est. tax savings @ 24.0%
- +$146
- After-tax cash flow
- $2,651/yr
For passive investors: Depreciation is non-cash, so a rental often shows a tax loss while cash-flowing — sheltering income. Rental losses are passive: they offset passive income freely, and up to $25,000/yr can offset ordinary (W-2) income if you actively participate and your MAGI is under $100k (phasing out to $0 by $150k); unused losses carry forward. On sale, claimed depreciation is recaptured at up to 25%, and gains may owe capital-gains tax (a 1031 exchange can defer both). Figures are a year-1 estimate at your 24.0% rate — not tax advice; consult a CPA.
Schools (NCES district)
- District
- Lexington 01
- NCES district ID
- 4502700
- Math proficiency
- 42% ▼ -12.00%
- Reading proficiency
- 53% ▼ -2.00%
- Median HH income
- $61,298
- Composite
- 41.75/100
- National rank
- #3399
- State rank
- #11 of 80 in SC
Livability — Gilbert
- Score
- 71/100
- State rank
- #52
- US rank
- #7008
Category grades
Schools grade is shown separately in the Schools card above.
Census & demographics
- County
- Lexington County · 232,571 people
- Metro
- Columbia, SC
- Population (ZIP)
- 69,407
- Household income
- $106,382
- Rent vs Own
- Severe rent burden
- 858.0
Population outlook (Lexington County) Hauer SSP2
- Today (2025)
- 322,999 people
- By 2030
- 342,356 · +6.0%
- By 2040
- 377,715 · +16.9%
- By 2050
- 406,984 · +26.0%
- By 2075
- 465,447 · +44.1%
- By 2100
- 485,674 · +50.4%
Race, ethnicity, and origin ACS 2023
- Neighborhood character
- Predominantly White (80%)
- Race & ethnicity
- White 80% Black 7% Hispanic / Latino 5% Two or more races 5% Asian 4%
- Hispanic origin (detail)
- Mexican 1%
- Common ancestry
- Italian 4% Serbian 3% Romanian 3%
- Foreign-born
- 7% · Canada, Jamaica, China
- Languages at home
- 91% English-only · Spanish 4% Other Indo-European 1% Other Asian/Pacific 1%
Political lean MEDSL · Lexington
- 2024 margin
- Solid R (+33.5) · D 32.5% · R 66.0% · Other 1.4%
- 2008→2024 swing
- +4.6pp toward D · 2008: -38.0pp · 2024: -33.5pp
- All cycles
- 2024: R+33.5 2020: R+30.1 2016: R+36.7 2012: R+37.8 2008: R+38.0
Not yet ingested
- Civics
- —
Market trends
- HPI YoY
- ▼ -197.53%
- Current HPI
- 212.3235
- Rent YoY
- ▲ 3.23%
- Metro
- Columbia, SC
- State GDP YoY
- ▲ 4.51%
- F500 in state
- 2
Industry mix (Fortune 500 HQ in SC)
| Industry | F500 HQs | Revenue |
|---|---|---|
| Packaging | 1 | $7B |
|
||
Price history
+145.5% since first listed3 events — show timeline
- 2026-06-07 Listed $189,000 Consolidated MLS
- 1999-03-24 Sold (Public Records) $145,000 Public Records
- 1995-11-01 Sold (Public Records) $77,000 Public Records
Property tax history
+2.0%/yrLatest (2024): $1,705 · +0.9% YoY. Source: county tax records.
Cash-flow waterfall
monthlySold comps — $/sqft
last 12 mo · ≤1 miLoading sold comps…