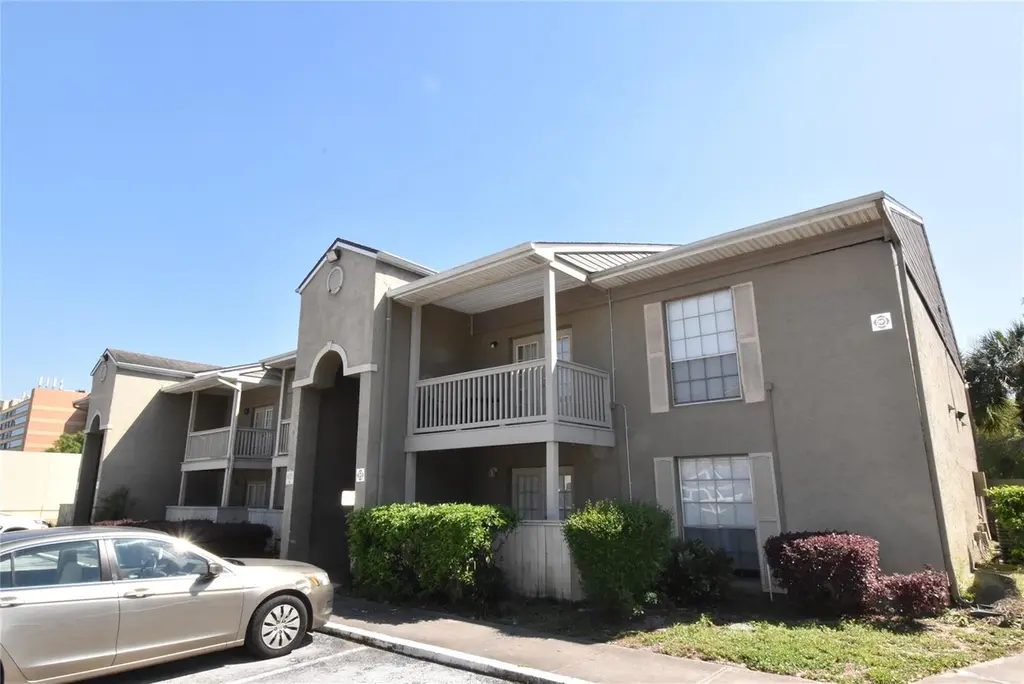
435 Wymore Rd #103 · Altamonte Springs, FL
Flood risk 4/10 · Minor
- FEMA flood zone
- X (unshaded)
- Chance of flooding over 30 yrs
- 0.22%
- Est. flood insurance / yr
- $507 – $1,088
Fire risk 1/10 · Minimal
- Est. fire insurance / yr
- $947 – $1,759
Heat risk 9/10 · Severe
- Hot days now (above 108°F)
- 7 days/yr
- Hot days in 30 yrs
- 23 days/yr
Wind risk 9/10 · Severe
- Chance of severe wind over 30 yrs
- 99.0%
Air-quality risk 2/10 · Minimal
- Unhealthy air days now
- 1 days/yr
- Unhealthy air days in 30 yrs
- 1 days/yr
Risk factors via First Street. Map © Google.
Why this score? — see what drove the C grade
The composite is a weighted blend of 9 inputs, each scored 0–100. Each bar is that input's sub-score; the figure is the points it added to the 100-point composite (weight × sub-score).
- Cash flow +20.1/30.0
- 1% rule +7.5/10.0
- ARV discount +7.5/15.0
- DSCR +6.4/10.0
- Schools +5.1/10.0
- Livability +4.1/5.0
- Condition / age +2.5/5.0
- Rent growth +2.3/5.0
- Appreciation +0.0/10.0
$107,000
🖨 Deal sheet 📄 Offer letter ✓ Due diligence
Listing remarks MLS
7 STUDIO UNITS AVAILABLE GREAT FOR INVESTOR PURCHASE
Key facts
- Clubhouse
- Resort style pool
- Private patio area
Tags
Property features AI
Finance
- Other: Unit is unfurnished; Listed living area ~420 sq ft (public records)
- Financial info: Total annual fees: $2,460; Lease restrictions apply
- HOA & community: HOA managed by Evan Valencia with Folio Mgmt; Monthly condo/HOA fee: $205 (includes pool, structure maintenance, grounds maintenance, management, sewer, trash, water); Association approval required; Community amenities: clubhouse, fitness center, pool, racquetball, sidewalks, tennis courts; Pets allowed with breed and size restrictions
Exterior
- Utilities: Public water; Public sewer; Cable available; Water and sewer available
- Home design: Residential condominium; One story; Faces south; Unit in building #435
- Construction: Stucco construction; Shingle roof; Slab foundation; Built as a single-level unit
- Exterior features: Balcony; Sidewalk; Tennis court(s)
Interior
- Kitchen: Range; Refrigerator
- Bedrooms: 1 bedroom (first floor)
- Bathrooms: 1 full bathroom
- Heating & cooling: Central heating (electric); Central air conditioning
- Interior features: No interior features listed; Elevator not in building
- Laundry & utility: Laundry in a common area
Neighborhood map
What this means for you Summary
Snapshot
- This is a 1-bed/1.0-bath condo listed at $107k.
Deal economics
- At list price, monthly cash flow is $134 ($2k/yr) — positive.
- The deal already cash-flows at list — no discount required.
- Meets the 1% rule at list price ($1k rent vs $107k).
- Recommended offer: $101k (6.0% below list) — sets the bar for market timing.
- Cap rate 7.8% vs local median 3.4% in Altamonte Springs — top-decile yield for the area; either an underpriced asset or a hidden risk that comps aren't pricing in. Stress-test before assuming the spread holds.
Location & tenants
- Location reads 82/100 on livability (#62 in FL, #1,095 nationally) — a professional / high-income tenant draw. Strengths: commute A+, cost of living A+, housing A+; Watch: employment C-, crime D+, amenities D-.
- Seminole (suburban): math 57% / reading 61% proficiency, ranked #13 of 73 in FL (top 18%) — acceptable for families but not a draw, mixed tenant base, ~2y average lease.
- Market conditions: Rents soft (-0.8%/yr); 257 active listings in the ZIP; 1 comparable units currently listed for rent nearby; 1,979 units permitted in Seminole County in 2024 (1,191 in 5+ unit buildings).
Forward outlook
- Local home prices are declining (-3.0%/yr); year-one equity from $740 of loan paydown is wiped out by about $3k of value loss. Plan a longer hold.
- Seminole County population projected at +24% by 2050 — long-run rental-demand tailwind backs the buy-and-hold thesis.
Negotiation context
- It's been on market 85 days — a 6% lower offer ($101k) is reasonable based on typical stale-listing flexibility.
- 3 sale attempts since 13y ago with the ask held roughly flat each time — persistent listings suggest the price (not the market) is what's stuck; bring a comps-based counter.
Risks & watch-outs
- Climate carrying-cost: severe wind risk, 99% chance of damaging wind over 30y; extreme-heat days projected 7→23/yr by 2055 (HVAC capex compounding) — expect insurance premiums to compound above CPI over the hold.
Questions for the listing agent
- It's been on market 85 days. Have you received any prior offers? Is the seller open to a 6% concession, seller financing, or rate buy-down credit?
- Built in 1971 — when were the roof, HVAC, electrical panel, plumbing, and water heater last replaced?
- What does the HOA fee cover, when was the last increase, and are there any pending special assessments or reserve-fund shortfalls?
- Any open or pending special assessments — roof, HVAC, plumbing, elevator, façade? What's the per-unit balance and payoff schedule, and is the seller paying it off at close or rolling it to the buyer?
- Why hasn't it sold? Are there any deal-killer items the seller is aware of (foundation, flood, title, zoning, code violations)?
- Is there a deadline driving the sale (1031 exchange, divorce, estate, relocation)? That informs how much negotiation room exists.
- Crime grade is D in this area — have there been break-ins, vandalism, or insurance claims at this property in the last 3 years? What carrier currently insures it and at what premium?
- What's the average days-on-market for RENTAL listings here right now (not sales)? A rising rental-DOM trend means longer vacancies and softer asking-rent achievability than the comps imply.
- What's the recent tenant-quality profile in this submarket — average credit score on applications, eviction rate, late-payment / NSF rate, and stable-employment percentage? A property-management company in the area should have these aggregated.
- How much new apartment / multifamily construction is in the pipeline within 1–3 miles? Heavy new supply (>2% of stock underway) typically softens rents 12–24 months out; light construction supports rent growth.
Investment metrics
- 1% rule
- 1.25% ✓
- Cap rate
- 7.80%
- Cash-on-cash
- 5.37%
- DSCR
- 1.24
- GRM
- 6.7
CMA / ARV
No comps found within radius.
Projected returns pro-forma
-3.0% appreciation · 0.0% rent growth · sell at horizon
- IRR
- -12.0%
- Equity multiple
- 0.58×
- Total profit
- $-12,578
- Equity at exit
- $15,954
- IRR
- -9.4%
- Equity multiple
- 0.51×
- Total profit
- $-14,536
- Equity at exit
- $9,251
Cash invested: $29,960 (down + closing). Projections, not guarantees.
Landlord ↔ Tenant lean methodology
- Overall (STATE)
- 87 Strongly Landlord-Friendly
- State Florida
- 87 Strongly Landlord-Friendly · R+3
- County
- — inherits STATE
- City
- — inherits STATE
ZIP-level market 32714
- Rents YoY
- -0.8%
- Active inventory
- 257
- Price-to-rent
- 6.7×
Monthly cashflow live
- Estimated rent
- $1,334 medium interval (Pro) →
- Mortgage (P&I)
- −$561
- Tax from tax record
- −$109 /mo · $1,312/yr
- Insurance
- −$45
- HOA
- −$205
- Vacancy / Maint / Mgmt
- −$280
- Net cashflow
- $134
Break-even live
UW: 25.0% down · 7.5% · 30yr · 1.5% tax · 5.0% vac · 8.0% maint · 8.0% mgmt
Financing live
Cash to close
- Down payment
- $26,750
- Closing costs
- $3,210
- Reserves months
- —
- Total cash needed
- —
Loan-product check · same deal, 3 products live
Conventional
25% down · 7.5% · 30yr
- Down + closing
- —
- Monthly P&I
- —
- Monthly cashflow
- —
- DSCR
- —
- Eligible?
- —
Personal DTI + credit; lowest rate.
DSCR
20% down · 8.5% · 30yr
- Down + closing
- —
- Monthly P&I
- —
- Monthly cashflow
- —
- DSCR
- —
- Eligible?
- —
No personal income docs; deal must DSCR.
Hard money
10% down · 12.0% · 12mo
- Down + closing
- —
- Monthly P&I
- —
- Monthly cashflow
- —
- DSCR
- —
- Eligible?
- —
Short-term bridge; refi at stabilization.
Rent comps 1 comps
| Address | Beds | Baths | Sqft | Rent | $/sqft | DOM | Units | Dist |
|---|---|---|---|---|---|---|---|---|
| 302 Northlake Blvd Altamonte Springs, FL | — | 1.0 | 300 | $1,799 | $6.00 | 5d | 1 | 0.24mi |
HOA detail condo
- Monthly dues
- $205 · $2,460/yr
- Assessments
- None detected in remarks — confirm with the listing agent.
Listing history 24 events
-
2026-06-18days on market $107,000 Active 85 DOM
-
2026-06-17days on market $107,000 Active 84 DOM
-
2026-06-16days on market $107,000 Active 83 DOM
-
2026-06-15days on market $107,000 Active 82 DOM
-
2026-06-13days on market $107,000 Active 80 DOM
-
2026-06-09days on market $107,000 Active 76 DOM
-
2026-06-08days on market $107,000 Active 75 DOM
-
2026-06-07days on market $107,000 Active 74 DOM
-
2026-06-04days on market $107,000 Active 71 DOM
-
2026-06-03days on market $107,000 Active 70 DOM
-
2026-06-02days on market $107,000 Active 69 DOM
-
2026-06-01days on market $107,000 Active 68 DOM
-
2026-05-31days on market $107,000 Active 67 DOM
-
2026-05-12price $107,000
-
2026-03-25$110,000 Active
-
2024-12-27soldstatus $110,000
-
2023-12-01historical $1,100
-
2023-10-20$1,100
-
2014-11-26soldstatus $54,900
-
2014-04-30soldstatus $213,900
-
2014-03-21soldstatus $31,500 Sold 52-char remark
Show marketing remark (52 chars)
7 STUDIO UNITS AVAILABLE GREAT FOR INVESTOR PURCHASE
-
2013-11-01$39,500 52-char remark
Show marketing remark (52 chars)
7 STUDIO UNITS AVAILABLE GREAT FOR INVESTOR PURCHASE
-
2007-05-02soldstatus $525,000
-
2007-04-17soldstatus $75,000 889-char remark
Show marketing remark (889 chars)
SerraVella--comfortable, contemporary, convenient--offering a unique blend of diversions suited for every lifestyle. Close to a multitude of destinations--leisurely pursuits, major employment centers and top-rated schools. Lushly landscaped grounds and serene courtyards are the setting for stylish studio, 1, 2 and 3 bedroom homes with private balconies or patios. Aesthetics include crown molding, custom interiors, Frise carpeting, designer kitchens with new appliance packages and updated bathrooms. Amenities feature a refreshing swimming pool framed by intimate picnic areas, executive business center, 2 lighted tennis courts & full basketball court. A resident entertainment complex includes a 24-hour fitness center, indoor racquetball court, aerobic room, private party center and lounge area. Location is everything and peace of mind comes standard. This home is a studio.
ⓘ Source: listings_history table (triggers on properties + properties_extension) + one-shot
backfill from property_details.listing_events for pre-trigger history.
Tax reassessment forecast FL · Resets to sale price
- Current annual tax
- $1,312 · $109/mo
- Projected year-2 tax
- $1,312 · $109/mo
- Expected delta
- $0/yr ($0/mo · 0.0%)
ⓘ Screening estimate from a state-policy table — verify with the county assessor before closing.
Climate risk First Street
- Flood 4/10 Moderate FEMA zone X (unshaded) · 22% chance over 30 yrs
- Wildfire 1/10 Low
- Heat 9/10 Extreme 7 d/yr ≥108°F today · 23 d/yr by 30 yrs out
- Wind 9/10 Extreme 99% chance of damaging wind over 30 yrs
- Air quality 2/10 Low 1 unhealthy d/yr today · 1 by 30 yrs out
Nearby sold comps map
Loading sold comps map…
Walkable amenities ~0.75 mi
Loading nearby amenities…
Taxation est. · year 1
- Rental income
- $16,012
- − Mortgage interest
- −$5,994
- − Property taxes
- −$1,312
- − Insurance
- −$535
- − Repairs & maintenance
- −$1,281
- − Management
- −$1,281
- − HOA
- −$2,460
- − Depreciation
- −$3,113
- Taxable income
- $37
- Est. tax owed @ 24.0%
- −$9
- After-tax cash flow
- $1,600/yr
For passive investors: Depreciation is non-cash, so a rental often shows a tax loss while cash-flowing — sheltering income. Rental losses are passive: they offset passive income freely, and up to $25,000/yr can offset ordinary (W-2) income if you actively participate and your MAGI is under $100k (phasing out to $0 by $150k); unused losses carry forward. On sale, claimed depreciation is recaptured at up to 25%, and gains may owe capital-gains tax (a 1031 exchange can defer both). Figures are a year-1 estimate at your 24.0% rate — not tax advice; consult a CPA.
Schools (NCES district)
- District
- Seminole
- NCES district ID
- 1201710
- Math proficiency
- 57% ▼ -7.00%
- Reading proficiency
- 61% ▼ -1.00%
- Median HH income
- $58,478
- Composite
- 51.05/100
- National rank
- #1769
- State rank
- #13 of 73 in FL
Livability — Altamonte Springs
- Score
- 82/100
- State rank
- #62
- US rank
- #1095
Category grades
Schools grade is shown separately in the Schools card above.
Census & demographics
- County
- Seminole County · 436,154 people
- City population
- 62,497
- Metro
- Orlando-Kissimmee-Sanford, FL
- Population (ZIP)
- 37,905
- Household income
- $70,955
- Rent vs Own
- Severe rent burden
- 1961.0
Population outlook (Seminole County) Hauer SSP2
- Today (2025)
- 515,494 people
- By 2030
- 545,713 · +5.9%
- By 2040
- 598,068 · +16.0%
- By 2050
- 640,663 · +24.3%
- By 2075
- 724,461 · +40.5%
- By 2100
- 755,530 · +46.6%
Race, ethnicity, and origin ACS 2023
- Neighborhood character
- Diverse neighborhood (Simpson 0.69)
- Race & ethnicity
- White 43% Hispanic / Latino 31% Two or more races 17% Black 17% Asian 2%
- Hispanic origin (detail)
- Mexican 3% Puerto Rican 10% Cuban 3% Dominican 2%
- Common ancestry
- Lithuanian 4% Hispanic 3% Scotch-Irish 2%
- Foreign-born
- 18% · Canada, Jamaica, South Korea
- Languages at home
- 71% English-only · Spanish 22% French/Haitian/Cajun 3% Other Indo-European 1%
Political lean MEDSL · Seminole
- 2024 margin
- Toss-up / Even · D 47.6% · R 51.1% · Other 1.3%
- 2008→2024 swing
- -0.8pp no change · 2008: -2.8pp · 2024: -3.5pp
- All cycles
- 2024: R+3.5 2020: D+2.8 2016: R+1.6 2012: R+6.5 2008: R+2.8
Not yet ingested
- Civics
- —
Market trends
- HPI YoY
- ▼ -200.78%
- Current HPI
- 338.6894
- Rent YoY
- ▼ -0.79%
- Metro
- Orlando-Kissimmee-Sanford, FL
- State GDP YoY
- ▲ 3.28%
- F500 in state
- 36
Industry mix (Fortune 500 HQ in FL)
| Industry | F500 HQs | Revenue |
|---|---|---|
| Industrial Technology | 2 | $29B |
|
||
| Insurance | 2 | $17B |
|
||
| Retail | 1 | $60B |
|
||
| Technology Distribution | 1 | $58B |
|
||
| Homebuilding | 1 | $35B |
|
||
| Technology Manufacturing | 1 | $35B |
|
||
Price history
+42.7% since first listed11 events — show timeline
- 2026-05-12 Price Changed $107,000 Stellar MLS as Distributed by MLS Grid
- 2026-03-25 Listed $110,000 Stellar MLS as Distributed by MLS Grid
- 2024-12-27 Sold (Public Records) $110,000 Public Records
- 2023-12-01 Rental Removed $1,100 STELLARMLS
- 2023-10-20 Listed for Rent $1,100 STELLARMLS
- 2014-11-26 Sold (Public Records) $54,900 Public Records
- 2014-04-30 Sold (Public Records) $213,900 Public Records
- 2014-03-21 Sold (MLS) $31,500 Stellar MLS as Distributed by MLS Grid
- 2013-11-01 Listed $39,500 Stellar MLS as Distributed by MLS Grid
- 2007-05-02 Sold (Public Records) $525,000 Public Records
- 2007-04-17 Sold (MLS) $75,000 Stellar MLS as Distributed by MLS Grid
Property tax history
+13.0%/yrLatest (2025): $1,312 · +35.1% YoY. Source: county tax records.
Cash-flow waterfall
monthlySold comps — $/sqft
last 12 mo · ≤1 miLoading sold comps…