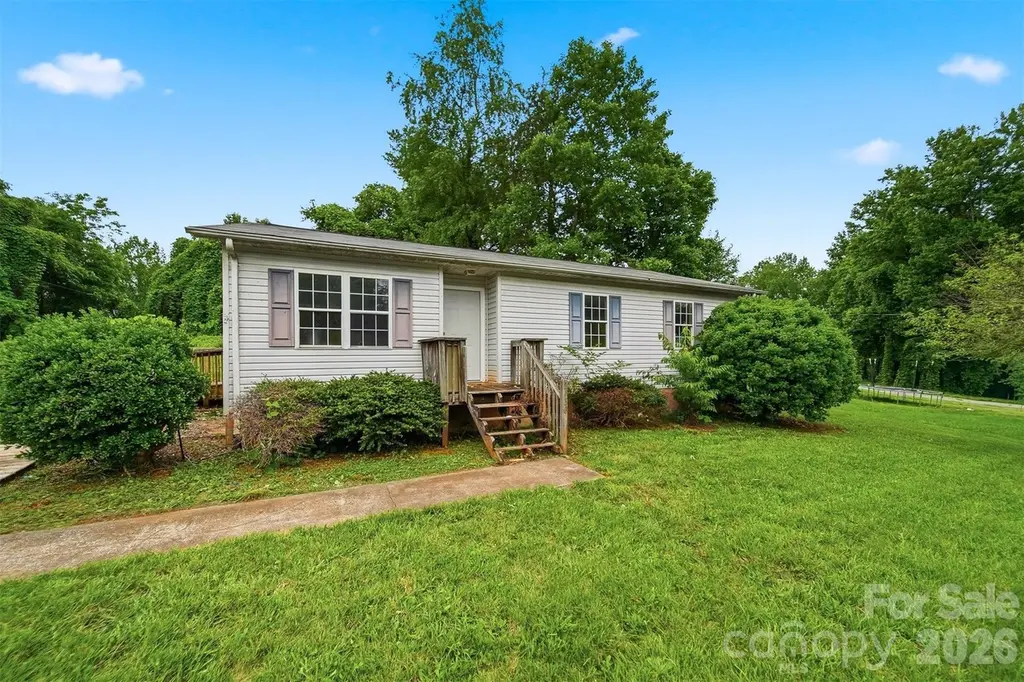
2130 Haven Cir SE · Lenoir, NC
Flood risk 1/10 · Minimal
- FEMA flood zone
- X (unshaded)
- Chance of flooding over 30 yrs
- 0.0%
- Est. flood insurance / yr
- $507 – $1,088
Fire risk 4/10 · Minor
- Est. fire insurance / yr
- $906 – $1,684
Heat risk 5/10 · Moderate
- Hot days now (above 102°F)
- 7 days/yr
- Hot days in 30 yrs
- 18 days/yr
Wind risk 2/10 · Minimal
- Chance of severe wind over 30 yrs
- 1.0%
Air-quality risk 2/10 · Minimal
- Unhealthy air days now
- 0 days/yr
- Unhealthy air days in 30 yrs
- 1 days/yr
Risk factors via First Street. Map © Google.
Why this score? — see what drove the B- grade
The composite is a weighted blend of 9 inputs, each scored 0–100. Each bar is that input's sub-score; the figure is the points it added to the 100-point composite (weight × sub-score).
- Cash flow +24.9/30.0
- ARV discount +15.0/15.0
- DSCR +8.1/10.0
- 1% rule +5.8/10.0
- Schools +3.5/10.0
- Livability +3.5/5.0
- Rent growth +2.5/5.0
- Condition / age +2.5/5.0
- Appreciation +0.0/10.0
$120,000
🖨 Deal sheet 📄 Offer letter ✓ Due diligence
Listing remarks
Investor Special with great potential! This 3-bedroom, 2-bath home offers an excellent opportunity for investors, flippers, or buyers looking to add their personal touch. The home features a functional floor plan with spacious living areas and ample room for renovation and updates. Situated on a generous lot, the property also includes a detached outbuilding behind the home, providing valuable space for storage, a workshop, or additional project potential. Conveniently located with easy access to local amenities, shopping, and schools. Property is being sold as-is. Bring your vision and unlock the possibilities this property has to offer! CAUTIONS!! Be careful walking through home. Floor
Key facts
- Generous lot
- Detached outbuilding
- 0.38 acre lot
Tags
Property features AI
Finance
- HOA & community: No HOA
Exterior
- Parking: Driveway
- Utilities: City water; Public sewer
- Home design: Single-family residential home; Site-built construction; One story; Crawl space foundation
- Construction: Vinyl exterior
- Exterior features: Lot is approximately 0.46 acres; Road surfaces are gravel and paved; Publicly maintained road access
Interior
- Kitchen: No appliances listed
- Bedrooms: 3 bedrooms on the main level
- Bathrooms: 2 full bathrooms on the main level
- Heating & cooling: No heating; No cooling
- Interior features: 5 total rooms; Bonus room with a fireplace
- Laundry & utility: Laundry in a common area
Neighborhood map
What this means for you Summary
Snapshot
- This is a 3-bed/2.0-bath single-family listed at $120k.
Deal economics
- At list price, monthly cash flow is $258 ($3k/yr) — positive.
- The deal already cash-flows at list — no discount required.
- Meets the 1% rule at list price ($1k rent vs $120k).
- Recommended offer: $118k (1.5% below list) — sets the bar for market timing.
- Cap rate 8.9% vs local median 2.7% in Lenoir — top-decile yield for the area; either an underpriced asset or a hidden risk that comps aren't pricing in. Stress-test before assuming the spread holds.
Location & tenants
- Location reads 70/100 on livability (#139 in NC) — a middle-class / working-renter tenant base. Strengths: cost of living A+, housing A+, health & safety A+; Watch: crime D+, amenities D, commute F.
- Caldwell County Schools (suburban): math 38% / reading 46% proficiency, ranked #106 of 178 in NC (top 60%) — families likely to look elsewhere, expect single-tenant / working-renter base with shorter leases.
- Zoned schools: Whitnel Elementary (math 17% / reading 27%, grade F, #1,190 of 1,410 statewide, top 86%, 300 students, 99% FRL); Hibriten High (math 57% / reading 42%, grade D, #311 of 535 statewide, top 60%, 843 students, 62% FRL) — zoned schools average 81% FRL vs 51% district-wide (30 pts higher); higher-poverty schools than district average — tighter screening recommended.
- Market conditions: 465 active listings in the ZIP; 3 comparable units currently listed for rent nearby; rentals at typical pace (median 21d on market — plan ~3-4 weeks tenant-placement turnaround); 217 units permitted in Caldwell County in 2024 (0 in 5+ unit buildings).
Forward outlook
- Local home prices are declining (-3.0%/yr); year-one equity from $830 of loan paydown is wiped out by about $4k of value loss. Plan a longer hold.
- Caldwell County population projected at -23% by 2050 — secular population decline; favor cash flow + early exit over multi-decade hold.
Negotiation context
- It's been on market 16 days — a 2% lower offer ($118k) is reasonable based on typical stale-listing flexibility.
Risks & watch-outs
- Climate carrying-cost: extreme-heat days projected 7→18/yr by 2055 (HVAC capex compounding) — expect insurance premiums to compound above CPI over the hold.
Questions for the listing agent
- Is there a deadline driving the sale (1031 exchange, divorce, estate, relocation)? That informs how much negotiation room exists.
- Schools are F-rated, which usually means shorter tenancies and higher turnover. Who's the typical renter profile here, and what's been the actual vacancy rate?
- Crime grade is D in this area — have there been break-ins, vandalism, or insurance claims at this property in the last 3 years? What carrier currently insures it and at what premium?
- What's the average days-on-market for RENTAL listings here right now (not sales)? A rising rental-DOM trend means longer vacancies and softer asking-rent achievability than the comps imply.
- What's the recent tenant-quality profile in this submarket — average credit score on applications, eviction rate, late-payment / NSF rate, and stable-employment percentage? A property-management company in the area should have these aggregated.
- How much new for-sale + rental construction is in the pipeline within 1–3 miles? Heavy new supply typically softens prices + rents 12–24 months out; constrained supply supports both.
Investment metrics
- 1% rule
- 1.08% ✓
- Cap rate
- 8.87%
- Cash-on-cash
- 9.20%
- DSCR
- 1.41
- GRM
- 7.7
CMA / ARV
- ARV (on-the-fly)
- $215,716
- Comps found
- 10
Show comp detail 10 sales within ~0.75 mi
| Address | Dist | Beds/Ba | Sqft | Sold | Price | $/sf | Match |
|---|---|---|---|---|---|---|---|
| 2143 Haven Cir | 0.11mi | 3/1.0 | 1,107 (+2%) | 1mo | $230,000 | $208 | 87 |
| 713 Wilmont St SW | 0.37mi | 3/1.0 | 1,106 (+2%) | 14mo | $220,000 | $199 | 63 |
| 1809 Waycross Dr SW | 0.54mi | 3/2.0 | 1,066 (-2%) | 18mo | $219,500 | $206 | 57 |
| 519 Ridgeway Pl SW | 0.64mi | 3/2.0 | 1,164 (+7%) | 13mo | $159,000 | $137 | 47 |
| 2404 Lincoln Ln SW | 0.65mi | 3/1.0 | 1,100 (+2%) | 24mo | $255,000 | $232 | 43 |
| 1904 Swan Dr SW | 0.37mi | 4/2.0 (+1) | 1,213 (+12%) | 21mo | $298,655 | $246 | 40 |
| 119 Plymouth Rd | 0.72mi | 3/1.0 | 1,131 (+4%) | 18mo | $200,000 | $177 | 40 |
| 2414 Maywood Dr | 0.71mi | 3/2.0 | 967 (-11%) | 19mo | $190,000 | $196 | 33 |
| 501 Kincaid St | 0.46mi | 2/1.0 (-1) | 1,216 (+12%) | 22mo | $175,000 | $144 | 31 |
| 110 Countryside Dr SE | 0.60mi | 2/1.0 (-1) | 1,185 (+9%) | 21mo | $185,000 | $156 | 30 |
Match score weights: distance 35% · size 25% · config 20% · recency 20%. Top-matched comps best support the ARV.
Projected returns pro-forma
-3.0% appreciation · 3.0% rent growth · sell at horizon
- IRR
- -2.4%
- Equity multiple
- 0.91×
- Total profit
- $-3,054
- Equity at exit
- $17,892
- IRR
- 7.3%
- Equity multiple
- 1.55×
- Total profit
- $18,397
- Equity at exit
- $10,375
Cash invested: $33,600 (down + closing). Projections, not guarantees.
Landlord ↔ Tenant lean methodology
- Overall (STATE)
- 85 Strongly Landlord-Friendly
- State North Carolina
- 85 Strongly Landlord-Friendly · R+3
- County
- — inherits STATE
- City
- — inherits STATE
ZIP-level market 28645
- Home prices YoY
- -17.4%
- Active inventory
- 465
- Price-to-rent
- 7.7×
Monthly cashflow live
- Estimated rent
- $1,298 medium interval (Pro) →
- Mortgage (P&I)
- −$629
- Tax from tax record
- −$88 /mo · $1,060/yr
- Insurance
- −$50
- HOA
- −$0
- Vacancy / Maint / Mgmt
- −$273
- Net cashflow
- $258
Break-even live
UW: 25.0% down · 7.5% · 30yr · 1.5% tax · 5.0% vac · 8.0% maint · 8.0% mgmt
Financing live
Cash to close
- Down payment
- $30,000
- Closing costs
- $3,600
- Reserves months
- —
- Total cash needed
- —
Loan-product check · same deal, 3 products live
Conventional
25% down · 7.5% · 30yr
- Down + closing
- —
- Monthly P&I
- —
- Monthly cashflow
- —
- DSCR
- —
- Eligible?
- —
Personal DTI + credit; lowest rate.
DSCR
20% down · 8.5% · 30yr
- Down + closing
- —
- Monthly P&I
- —
- Monthly cashflow
- —
- DSCR
- —
- Eligible?
- —
No personal income docs; deal must DSCR.
Hard money
10% down · 12.0% · 12mo
- Down + closing
- —
- Monthly P&I
- —
- Monthly cashflow
- —
- DSCR
- —
- Eligible?
- —
Short-term bridge; refi at stabilization.
Rent comps 3 comps
| Address | Beds | Baths | Sqft | Rent | $/sqft | DOM | Units | Dist |
|---|---|---|---|---|---|---|---|---|
| 2311 Central Dr Lenoir, NC | 2.0 | 1.0 | 956 | $1,200 | $1.26 | 21d | 1 | 0.49mi |
| 319 Connelly Springs Rd Unit A Lenoir, NC | 2.0 | 1.0 | 1250 | $1,700 | $1.36 | 21d | 1 | 1.01mi |
| 1406 Cliffside Pl SE Lenoir, NC | 2.0 | 1.0 | 980 | $1,100 | $1.12 | 13d | 1 | 1.06mi |
Listing history 13 events
-
2026-06-19days on market $120,000 Active 16 DOM
-
2026-06-18days on market $120,000 Active 15 DOM
-
2026-06-17days on market $120,000 Active 14 DOM
-
2026-06-16pricedays on market $120,000 Active 13 DOM
-
2026-06-15days on market $125,000 Active 12 DOM
-
2026-06-14days on market $125,000 Active 10 DOM
-
2026-06-13days on market $125,000 Active 9 DOM
-
2026-06-10days on market $125,000 Active 7 DOM
-
2026-06-09days on market $125,000 Active 6 DOM
-
2026-06-08days on market $125,000 Active 5 DOM
-
2026-06-07days on market $125,000 Active 4 DOM
-
2026-06-03remarks 699-char remark
-
2026-06-03$125,000 Active 1 DOM
ⓘ Source: listings_history table (triggers on properties + properties_extension) + one-shot
backfill from property_details.listing_events for pre-trigger history.
Tax reassessment forecast NC · Resets to sale price
- Current annual tax
- $1,060 · $88/mo
- Projected year-2 tax
- $1,060 · $88/mo
- Expected delta
- $0/yr ($0/mo · 0.0%)
ⓘ Screening estimate from a state-policy table — verify with the county assessor before closing.
Climate risk First Street
- Flood 1/10 Low FEMA zone X (unshaded) · 0% chance over 30 yrs
- Wildfire 4/10 Moderate
- Heat 5/10 Major 7 d/yr ≥102°F today · 18 d/yr by 30 yrs out
- Wind 2/10 Low 100% chance of damaging wind over 30 yrs
- Air quality 2/10 Low 0 unhealthy d/yr today · 1 by 30 yrs out
Nearby sold comps map
Loading sold comps map…
Walkable amenities ~0.75 mi
Loading nearby amenities…
Taxation est. · year 1
- Rental income
- $15,574
- − Mortgage interest
- −$6,722
- − Property taxes
- −$1,060
- − Insurance
- −$600
- − Repairs & maintenance
- −$1,246
- − Management
- −$1,246
- − Depreciation
- −$3,491
- Taxable income
- $1,209
- Est. tax owed @ 24.0%
- −$290
- After-tax cash flow
- $2,802/yr
For passive investors: Depreciation is non-cash, so a rental often shows a tax loss while cash-flowing — sheltering income. Rental losses are passive: they offset passive income freely, and up to $25,000/yr can offset ordinary (W-2) income if you actively participate and your MAGI is under $100k (phasing out to $0 by $150k); unused losses carry forward. On sale, claimed depreciation is recaptured at up to 25%, and gains may owe capital-gains tax (a 1031 exchange can defer both). Figures are a year-1 estimate at your 24.0% rate — not tax advice; consult a CPA.
Schools (NCES district)
- District
- Caldwell County Schools
- NCES district ID
- 3700580
- Math proficiency
- 38% ▲ 1.00%
- Reading proficiency
- 46% ▼ -1.00%
- Median HH income
- $37,165
- Composite
- 34.9/100
- National rank
- #5079
- State rank
- #106 of 178 in NC
Livability — Lenoir
- Score
- 70/100
- State rank
- #139
- US rank
- #7940
Category grades
Schools grade is shown separately in the Schools card above.
Census & demographics
- Census place
- Lenoir, NC
- Population (ZIP)
- 46,237
Population outlook (Caldwell County) Hauer SSP2
- Today (2025)
- 77,603 people
- By 2030
- 74,714 · -3.7%
- By 2040
- 67,732 · -12.7%
- By 2050
- 59,938 · -22.8%
- By 2075
- 43,232 · -44.3%
- By 2100
- 28,894 · -62.8%
Race, ethnicity, and origin ACS 2023
- Neighborhood character
- Predominantly White (83%)
- Race & ethnicity
- White 83% Hispanic / Latino 8% Black 6% Two or more races 5%
- Hispanic origin (detail)
- Mexican 3%
- Common ancestry
- Slovak 3% Serbian 2% Italian 2%
- Foreign-born
- 4% · Canada, Vietnam
- Languages at home
- 93% English-only · Spanish 5% Other Asian/Pacific 1%
Political lean MEDSL · Caldwell
- 2024 margin
- Solid R (+52.6) · D 23.4% · R 76.0%
- 2008→2024 swing
- -22.9pp toward R · 2008: -29.7pp · 2024: -52.6pp
- All cycles
- 2024: R+52.6 2020: R+51.1 2016: R+50.6 2012: R+35.7 2008: R+29.7
Not yet ingested
- Civics
- —
Market trends
- HPI YoY
- ▼ -56.03%
- Current HPI
- 265.0987
- Rent YoY
- —
- Metro
- —
- State GDP YoY
- ▲ 3.28%
- F500 in state
- 26
Industry mix (Fortune 500 HQ in NC)
| Industry | F500 HQs | Revenue |
|---|---|---|
| Financial Services | 2 | $213B |
|
||
| Retail | 2 | $95B |
|
||
| Industrial Conglomerate | 1 | $38B |
|
||
| Metals / Steel | 1 | $35B |
|
||
| Utilities | 1 | $30B |
|
||
| Industrial Machinery | 1 | $19B |
|
||
Price history
1 event — show timeline
- 2026-06-03 Listed $125,000 CANOPYMLS as Distributed by MLS Grid
Property tax history
+13.5%/yrLatest (2025): $1,060 · +82.1% YoY. Source: county tax records.
Cash-flow waterfall
monthlySold comps — $/sqft
last 12 mo · ≤1 miLoading sold comps…