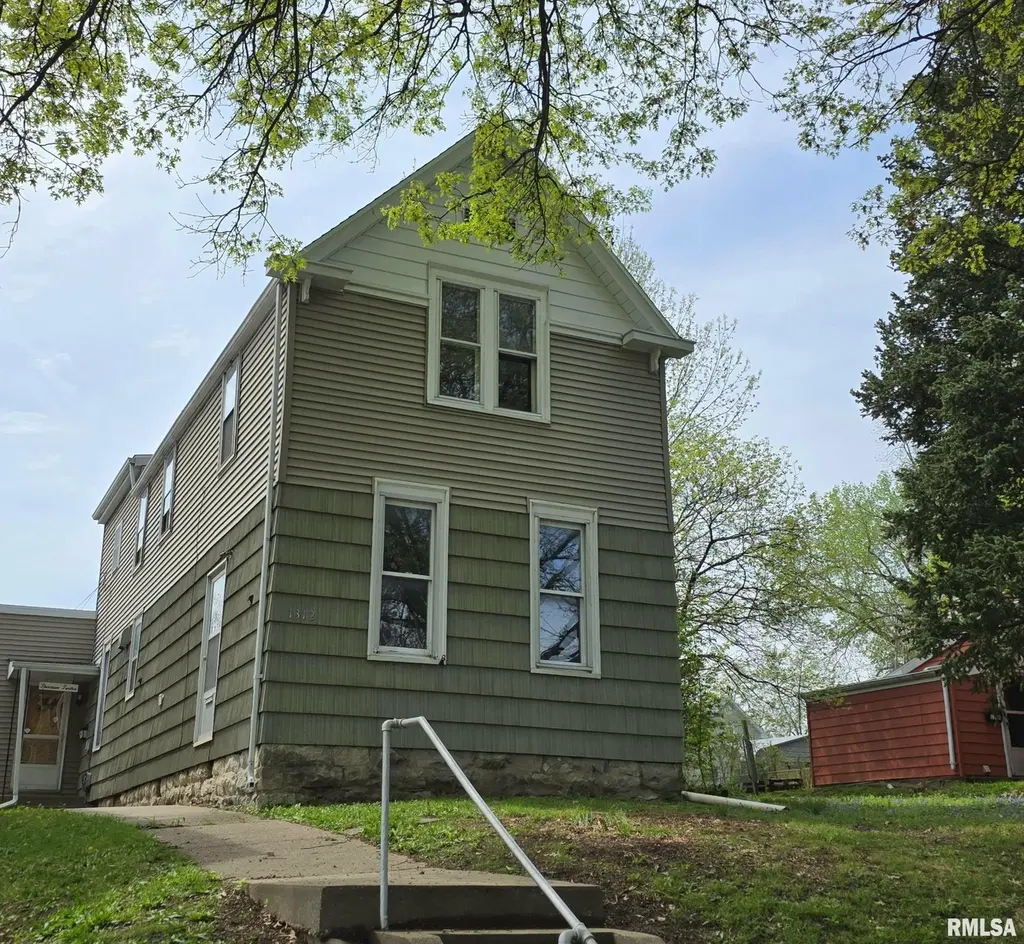
1312 Lind St · Quincy, IL
Flood risk 1/10 · Minimal
- FEMA flood zone
- X (unshaded)
- Chance of flooding over 30 yrs
- 0.0%
- Est. flood insurance / yr
- $473 – $860
Fire risk 1/10 · Minimal
- Est. fire insurance / yr
- $804 – $1,492
Heat risk 3/10 · Minor
- Hot days now (above 106°F)
- 7 days/yr
- Hot days in 30 yrs
- 17 days/yr
Wind risk 2/10 · Minimal
- Chance of severe wind over 30 yrs
- —
Air-quality risk 2/10 · Minimal
- Unhealthy air days now
- 1 days/yr
- Unhealthy air days in 30 yrs
- 1 days/yr
Risk factors via First Street. Map © Google.
Why this score? — see what drove the B+ grade
The composite is a weighted blend of 9 inputs, each scored 0–100. Each bar is that input's sub-score; the figure is the points it added to the 100-point composite (weight × sub-score).
- Cash flow +30.0/30.0
- 1% rule +10.0/10.0
- DSCR +10.0/10.0
- ARV discount +10.0/15.0
- Appreciation +5.0/10.0
- Livability +3.4/5.0
- Rent growth +2.5/5.0
- Condition / age +2.5/5.0
- Schools +2.2/10.0
$127,500
🖨 Deal sheet 📄 Offer letter ✓ Due diligence
Listing remarks MLS
Explore the possibilities this 3-bedroom, 2-bath home has to offer. Inside, you will discover spacious rooms with plenty of natural light, refreshed interior paint, and the main-floor laundry adds everyday convenience. The lot is oversized and features a fully fenced backyard with alley access-perfect for pets, play, or entertaining. The detached 2-car garage offers great storage, plus a large parking pad for extra vehicles. Conveniently located near the hospital, shopping, and restaurants. Recent updates:*Roof (2024) *Kitchen & Dining Flooring (2024) * Interior Paint (2024) *Water Heater (2024) * Refrigerator (2022) Upstairs bedroom with a full bath attached.
Key facts
- Alley access
- Large parking pad
- Oversized lot
Tags
Neighborhood map
What this means for you Summary
Snapshot
- This is a 3-bed/2.0-bath single-family listed at $128k.
Deal economics
- At list price, monthly cash flow is $1k ($17k/yr) — positive.
- The deal already cash-flows at list — no discount required.
- Meets the 1% rule at list price ($3k rent vs $128k).
- Recommended offer: $120k (6.0% below list) — sets the bar for market timing.
- Cap rate 19.4% vs local median 4.3% in Quincy — top-decile yield for the area; either an underpriced asset or a hidden risk that comps aren't pricing in. Stress-test before assuming the spread holds.
Location & tenants
- Location reads 67/100 on livability (#506 in IL) — a middle-class / working-renter tenant base. Strengths: cost of living A+, housing A+; Watch: schools D+, crime D, employment D.
- Quincy SD 172 (town): math 24% / reading 27% proficiency, ranked #328 of 620 in IL (top 53%) — low school quality limits family demand, transient renter base, plan for 1-2y turnover.
- Market conditions: 1 active listings in the ZIP; 2 comparable units currently listed for rent nearby; 68 units permitted in Adams County in 2024 (0 in 5+ unit buildings).
Forward outlook
- In year one you build about $5k of equity ($882 loan paydown + $4k appreciation (3.0% local appreciation)).
- Adams County population projected at -14% by 2050 — secular population decline; favor cash flow + early exit over multi-decade hold.
- At projected returns (3.0% appreciation + 3.0% rent growth), your $36k cash investment doubles in ~2 years — after that, you're playing with house money.
- By year 8, paydown + projected appreciation supports a ~$35k cash-out refi (75% LTV) — recoverable capital for the next deal without selling this one.
Negotiation context
- It's been on market 64 days — a 6% lower offer ($120k) is reasonable based on typical stale-listing flexibility.
- 3 sale attempts since 20y ago with the ask held roughly flat each time — persistent listings suggest the price (not the market) is what's stuck; bring a comps-based counter.
- Current owner paid $70k; list at $128k implies a 82% gain — meaningful room to come down on a strong offer.
Questions for the listing agent
- It's been on market 64 days. Have you received any prior offers? Is the seller open to a 6% concession, seller financing, or rate buy-down credit?
- Why hasn't it sold? Are there any deal-killer items the seller is aware of (foundation, flood, title, zoning, code violations)?
- Is there a deadline driving the sale (1031 exchange, divorce, estate, relocation)? That informs how much negotiation room exists.
- Schools are D-rated, which usually means shorter tenancies and higher turnover. Who's the typical renter profile here, and what's been the actual vacancy rate?
- Crime grade is D in this area — have there been break-ins, vandalism, or insurance claims at this property in the last 3 years? What carrier currently insures it and at what premium?
- What's the average days-on-market for RENTAL listings here right now (not sales)? A rising rental-DOM trend means longer vacancies and softer asking-rent achievability than the comps imply.
- What's the recent tenant-quality profile in this submarket — average credit score on applications, eviction rate, late-payment / NSF rate, and stable-employment percentage? A property-management company in the area should have these aggregated.
- How much new for-sale + rental construction is in the pipeline within 1–3 miles? Heavy new supply typically softens prices + rents 12–24 months out; constrained supply supports both.
Investment metrics
- 1% rule
- 2.26% ✓
- Cap rate
- 19.41%
- Cash-on-cash
- 46.86%
- DSCR
- 3.08
- GRM
- 3.7
CMA / ARV
- ARV (median comp)
- $134,844
- List price
- $127,500
- Delta
- -5.45%
- Verdict
- FAIR
- Comps
- 20 within 1.0 mi
Show comp detail 12 sales within ~0.75 mi
| Address | Dist | Beds/Ba | Sqft | Sold | Price | $/sf | Match |
|---|---|---|---|---|---|---|---|
| 1513 Spruce St | 0.42mi | 3/2.0 | 1,850 (+4%) | 1mo | $62,000 | $34 | 73 |
| 1519 Oak St | 0.28mi | 3/2.0 | 1,634 (-8%) | 7mo | $160,000 | $98 | 67 |
| 1728 Chestnut St | 0.38mi | 2/1.0 (-1) | 1,817 (+2%) | 7mo | $195,000 | $107 | 64 |
| 1026 N 15th St | 0.21mi | 2/2.0 (-1) | 1,992 (+12%) | 7mo | $162,000 | $81 | 60 |
| 1030 N 8th St | 0.49mi | 3/1.0 | 1,695 (-5%) | 8mo | $125,000 | $74 | 58 |
| 1635 Chestnut St | 0.31mi | 3/1.5 | 1,524 (-15%) | 4mo | $188,900 | $124 | 56 |
| 1400 N 12th St | 0.47mi | 4/2.5 (+1) | 1,665 (-7%) | 6mo | $123,711 | $74 | 55 |
| 908 Spruce St | 0.51mi | 3/4.0 | 1,649 (-8%) | 2mo | $60,000 | $36 | 54 |
| 2027 Elm St | 0.60mi | 2/2.0 (-1) | 1,866 (+5%) | 8mo | $165,000 | $88 | 53 |
| 1843 Spring St | 0.59mi | 3/2.0 | 1,992 (+12%) | 1mo | $214,000 | $107 | 52 |
| 1325 Locust St | 0.63mi | 4/2.0 (+1) | 1,705 (-4%) | 8mo | $179,000 | $105 | 52 |
| 1408 Locust St | 0.60mi | 2/1.5 (-1) | 1,575 (-12%) | 2mo | $134,550 | $85 | 44 |
Match score weights: distance 35% · size 25% · config 20% · recency 20%. Top-matched comps best support the ARV.
Projected returns pro-forma
3.0% appreciation · 3.0% rent growth · sell at horizon
- IRR
- 52.1%
- Equity multiple
- 3.92×
- Total profit
- $104,191
- Equity at exit
- $57,330
- IRR
- 51.8%
- Equity multiple
- 7.91×
- Total profit
- $246,565
- Equity at exit
- $88,352
Cash invested: $35,700 (down + closing). Projections, not guarantees.
Landlord ↔ Tenant lean methodology
- Overall (STATE)
- 43 Moderately Tenant-Leaning
- State Illinois
- 43 Moderately Tenant-Leaning · D+7
- County
- — inherits STATE
- City
- — inherits STATE
ZIP-level market 62301-2454
- Active inventory
- 1
- Price-to-rent
- 3.7×
Monthly cashflow live
- Estimated rent
- $2,886 medium interval (Pro) →
- Mortgage (P&I)
- −$669
- Tax from tax record
- −$164 /mo · $1,970/yr
- Insurance
- −$53
- HOA
- −$0
- Vacancy / Maint / Mgmt
- −$606
- Net cashflow
- $1,394
Break-even live
UW: 25.0% down · 7.5% · 30yr · 1.5% tax · 5.0% vac · 8.0% maint · 8.0% mgmt
Financing live
Cash to close
- Down payment
- $31,875
- Closing costs
- $3,825
- Reserves months
- —
- Total cash needed
- —
Loan-product check · same deal, 3 products live
Conventional
25% down · 7.5% · 30yr
- Down + closing
- —
- Monthly P&I
- —
- Monthly cashflow
- —
- DSCR
- —
- Eligible?
- —
Personal DTI + credit; lowest rate.
DSCR
20% down · 8.5% · 30yr
- Down + closing
- —
- Monthly P&I
- —
- Monthly cashflow
- —
- DSCR
- —
- Eligible?
- —
No personal income docs; deal must DSCR.
Hard money
10% down · 12.0% · 12mo
- Down + closing
- —
- Monthly P&I
- —
- Monthly cashflow
- —
- DSCR
- —
- Eligible?
- —
Short-term bridge; refi at stabilization.
Rent comps 2 comps
| Address | Beds | Baths | Sqft | Rent | $/sqft | DOM | Units | Dist |
|---|---|---|---|---|---|---|---|---|
| 201 S 8th St Quincy, IL | 2.0 | 2.5 | 1785 | $1,800 | $1.01 | 43d | 1 | 0.93mi |
| 116 N 3rd St Quincy, IL | 1.0–4.0 | 1.0–2.0 | 1950 | $4,333 | $2.22 | 43d | 12 | 1.13mi |
Listing history 27 events
-
2026-06-19days on market $127,500 Under Contract 64 DOM
-
2026-06-18days on market $127,500 Under Contract 63 DOM
-
2026-06-17days on market $127,500 Under Contract 62 DOM
-
2026-06-16days on market $127,500 Under Contract 61 DOM
-
2026-06-15days on market $127,500 Under Contract 60 DOM
-
2026-06-14days on market $127,500 Under Contract 58 DOM
-
2026-06-12days on market $127,500 Under Contract 57 DOM
-
2026-06-09days on market $127,500 Under Contract 54 DOM
-
2026-06-08days on market $127,500 Under Contract 53 DOM
-
2026-06-07days on market $127,500 Under Contract 52 DOM
-
2026-06-03days on market $127,500 Under Contract 48 DOM
-
2026-06-02days on market $127,500 Under Contract 47 DOM
-
2026-06-01days on market $127,500 Under Contract 46 DOM
-
2026-05-31days on market $127,500 Under Contract 45 DOM
-
2026-05-30days on market $127,500 Under Contract 44 DOM
-
2026-05-15historical Under Contract 672-char remark
Show marketing remark (672 chars)
Explore the possibilities this 3-bedroom, 2-bath home has to offer. Inside, you will discover spacious rooms with plenty of natural light, refreshed interior paint, and the main-floor laundry adds everyday convenience. The lot is oversized and features a fully fenced backyard with alley access-perfect for pets, play, or entertaining. The detached 2-car garage offers great storage, plus a large parking pad for extra vehicles. Conveniently located near the hospital, shopping, and restaurants. Recent updates:*Roof (2024) *Kitchen & Dining Flooring (2024) * Interior Paint (2024) *Water Heater (2024) * Refrigerator (2022) Upstairs bedroom with a full bath attached.
-
2026-04-15$127,500 Active 672-char remark
Show marketing remark (672 chars)
Explore the possibilities this 3-bedroom, 2-bath home has to offer. Inside, you will discover spacious rooms with plenty of natural light, refreshed interior paint, and the main-floor laundry adds everyday convenience. The lot is oversized and features a fully fenced backyard with alley access-perfect for pets, play, or entertaining. The detached 2-car garage offers great storage, plus a large parking pad for extra vehicles. Conveniently located near the hospital, shopping, and restaurants. Recent updates:*Roof (2024) *Kitchen & Dining Flooring (2024) * Interior Paint (2024) *Water Heater (2024) * Refrigerator (2022) Upstairs bedroom with a full bath attached.
-
2026-03-01historical
-
2025-09-20price
-
2025-08-06Active
-
2022-09-27historical
-
2022-09-27historical
-
2012-08-02historical
-
2009-08-04historical
-
2006-10-05soldstatus $69,900
-
2006-10-01soldstatus $69,900
-
2006-06-15$72,000
ⓘ Source: listings_history table (triggers on properties + properties_extension) + one-shot
backfill from property_details.listing_events for pre-trigger history.
Tax reassessment forecast IL · Partial reset (capped growth)
- Current annual tax
- $1,970 · $164/mo
- Projected year-2 tax
- $2,432 · $203/mo
- Expected delta
- +$462/yr (+$39/mo · 23.5%)
ⓘ Screening estimate from a state-policy table — verify with the county assessor before closing.
Climate risk First Street
- Flood 1/10 Low FEMA zone X (unshaded) · 0% chance over 30 yrs
- Wildfire 1/10 Low
- Heat 3/10 Moderate 7 d/yr ≥106°F today · 17 d/yr by 30 yrs out
- Wind 2/10 Low
- Air quality 2/10 Low 1 unhealthy d/yr today · 1 by 30 yrs out
Nearby sold comps map
Loading sold comps map…
Walkable amenities ~0.75 mi
Loading nearby amenities…
Taxation est. · year 1
- Rental income
- $34,631
- − Mortgage interest
- −$7,142
- − Property taxes
- −$1,970
- − Insurance
- −$638
- − Repairs & maintenance
- −$2,771
- − Management
- −$2,771
- − Depreciation
- −$3,709
- Taxable income
- $15,632
- Est. tax owed @ 24.0%
- −$3,752
- After-tax cash flow
- $12,976/yr
For passive investors: Depreciation is non-cash, so a rental often shows a tax loss while cash-flowing — sheltering income. Rental losses are passive: they offset passive income freely, and up to $25,000/yr can offset ordinary (W-2) income if you actively participate and your MAGI is under $100k (phasing out to $0 by $150k); unused losses carry forward. On sale, claimed depreciation is recaptured at up to 25%, and gains may owe capital-gains tax (a 1031 exchange can defer both). Figures are a year-1 estimate at your 24.0% rate — not tax advice; consult a CPA.
Schools (NCES district)
- District
- Quincy SD 172
- NCES district ID
- 1733000
- Math proficiency
- 24% ▬ 0.00%
- Reading proficiency
- 27% ▬ 0.00%
- Median HH income
- $44,132
- Composite
- 21.91/100
- National rank
- #8229
- State rank
- #328 of 620 in IL
Livability — Quincy
- Score
- 67/100
- State rank
- #506
- US rank
- #10458
Category grades
Schools grade is shown separately in the Schools card above.
Census & demographics
- Census place
- Quincy, IL
Population outlook (Adams County) Hauer SSP2
- Today (2025)
- 65,795 people
- By 2030
- 64,436 · -2.1%
- By 2040
- 61,007 · -7.3%
- By 2050
- 56,851 · -13.6%
- By 2075
- 46,424 · -29.4%
- By 2100
- 34,305 · -47.9%
Not yet ingested
- Political lean
- —
- Race & ethnicity
- —
- Common origin
- —
- Civics
- —
Market trends
- HPI YoY
- —
- Current HPI
- —
- Rent YoY
- —
- Metro
- —
- State GDP YoY
- ▲ 1.59%
- F500 in state
- 60
Industry mix (Fortune 500 HQ in IL)
| Industry | F500 HQs | Revenue |
|---|---|---|
| Insurance | 4 | $201B |
|
||
| Consumer Goods | 4 | $87B |
|
||
| Industrial Machinery | 3 | $64B |
|
||
| Healthcare | 2 | $55B |
|
||
| Retail / Pharmacy | 1 | $148B |
|
||
| Agriculture / Food | 1 | $86B |
|
||
Price history
+77.1% since first listed12 events — show timeline
- 2026-05-15 Contingent — RMLSA as Distributed by MLS Grid
- 2026-04-15 Listed $127,500 RMLSA as Distributed by MLS Grid
- 2026-03-01 Listing Removed — RMLSA as Distributed by MLS Grid
- 2025-09-20 Price Changed — RMLSA as Distributed by MLS Grid
- 2025-08-06 Listed — RMLSA as Distributed by MLS Grid
- 2022-09-27 Listing Removed — RMLSA as Distributed by MLS Grid
- 2022-09-27 Listing Removed — RMLSA as Distributed by MLS Grid
- 2012-08-02 Listing Removed — MRED as Distributed by MLS Grid
- 2009-08-04 Listing Removed — MRED as Distributed by MLS Grid
- 2006-10-05 Sold (MLS) $69,900 RMLSA as Distributed by MLS Grid
- 2006-10-01 Sold (Public Records) $69,900 Public Records
- 2006-06-15 Listed $72,000 RMLSA as Distributed by MLS Grid
Property tax history
+1.8%/yrLatest (2023): $1,970 · +5.7% YoY. Source: county tax records.
Cash-flow waterfall
monthlySold comps — $/sqft
last 12 mo · ≤1 miLoading sold comps…