8476 W Stockton Blvd #29 · Sacramento, CA
Flood risk 5/10 · Moderate
- FEMA flood zone
- X (unshaded)
- Chance of flooding over 30 yrs
- 0.27%
- Est. flood insurance / yr
- $507 – $1,088
Fire risk 1/10 · Minimal
- Est. fire insurance / yr
- $659 – $1,223
Heat risk 7/10 · Major
- Hot days now (above 102°F)
- 7 days/yr
- Hot days in 30 yrs
- 14 days/yr
Wind risk 1/10 · Minimal
- Chance of severe wind over 30 yrs
- —
Air-quality risk 10/10 · Severe
- Unhealthy air days now
- 25 days/yr
- Unhealthy air days in 30 yrs
- 27 days/yr
Risk factors via First Street. Map © Google.
Why this score? — see what drove the D+ grade
The composite is a weighted blend of 9 inputs, each scored 0–100. Each bar is that input's sub-score; the figure is the points it added to the 100-point composite (weight × sub-score).
- Cash flow +15.0/30.0
- ARV discount +7.5/15.0
- 1% rule +5.0/10.0
- DSCR +5.0/10.0
- Schools +4.1/10.0
- Livability +3.6/5.0
- Rent growth +2.9/5.0
- Condition / age +2.5/5.0
- Appreciation +0.0/10.0
$35,000
🖨 Deal sheet 📄 Offer letter ✓ Due diligence
Listing remarks
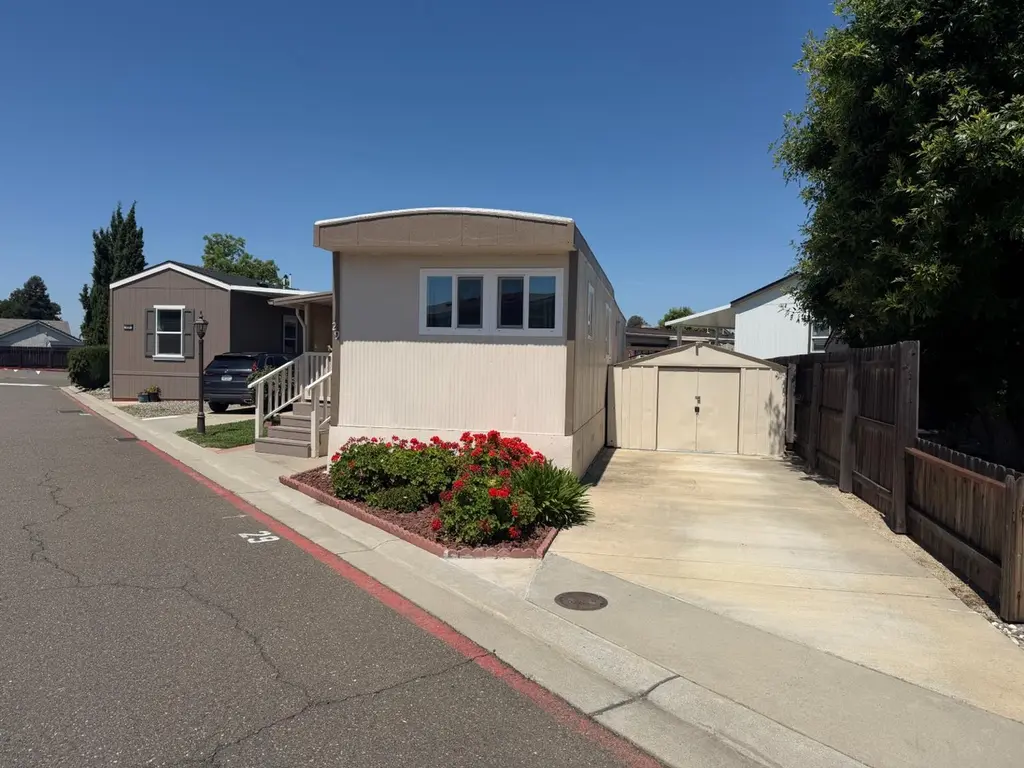
Welcome to 8476 W Stockton Blvd, Space 29 in Elk Grove. This charming 1 bedroom, 1 bathroom mobile home offers approximately 500 sq ft of comfortable living space in an all-age community. The home features a functional kitchen with gas range and refrigerator, a light-filled living area, indoor laundry/storage potential, and a covered entry porch that adds useful outdoor living space. Outside, enjoy a fenced yard with lawn, mature plants, flowers, and room to garden, relax, or entertain. A great opportunity for affordable living in a convenient Elk Grove location close to shopping, dining, commute routes, and local amenities. Buyer to verify park approval, space rent, rules, and all property
Key facts
- Functional kitchen
- Fenced yard
- Covered entry porch
Tags
Property features AI
Finance
- Other: Located in a non-senior community
- Financial info: Land lease: No (listed land lease amount present separately)
- HOA & community: No association
Exterior
- Parking: Off-street parking
- Utilities: Gas plumbed; Individual electric meter; Individual gas meter; Public water; Public sewer
- Home design: Manufactured in park; Single wide; Built in 1965
- Construction: Metal skirting; Skyline manufactured home
- Exterior features: Storage area; Garden; Shed(s)
Interior
- Kitchen: Laminate counter
- Bedrooms: 1 bedroom
- Flooring: Carpet; Linoleum
- Bathrooms: 1 full bathroom; Shower stall(s)
- Heating & cooling: Wall furnace; Wall and window cooling units
- Interior features: Hood over range; Porch; Great room
- Laundry & utility: No laundry hookups inside
Neighborhood map
What this means for you Summary
Snapshot
- This is a 1-bed/1.0-bath manufactured listed at $35k.
Deal economics
- At list price, monthly cash flow is $1k ($16k/yr) — positive.
- The deal already cash-flows at list — no discount required.
- Meets the 1% rule at list price ($2k rent vs $35k).
- Recommended offer: $34k (3.0% below list) — sets the bar for market timing.
- Cap rate 52.7% vs local median 3.0% in Sacramento — top-decile yield for the area; either an underpriced asset or a hidden risk that comps aren't pricing in. Stress-test before assuming the spread holds.
Location & tenants
- Location reads 71/100 on livability (#218 in CA) — a middle-class / working-renter tenant base. Strengths: amenities A+, commute A+, housing A; Watch: schools D+, crime F, cost of living F.
- Elk Grove Unified (suburban): math 40% / reading 51% proficiency, ranked #165 of 517 in CA (top 32%) — families likely to look elsewhere, expect single-tenant / working-renter base with shorter leases.
- Market conditions: Rents rising (+1.6%/yr); 180 active listings in the ZIP; 3 comparable units currently listed for rent nearby; rentals leasing fast (median 3d on market — plan ~1-2 weeks tenant-placement turnaround); high-income renter base; 6,825 units permitted in Sacramento County in 2024 (1,752 in 5+ unit buildings).
Forward outlook
- Local home prices are declining (-3.0%/yr); year-one equity from $242 of loan paydown is wiped out by about $1k of value loss. Plan a longer hold.
- Sacramento County population projected at +17% by 2050 — long-run rental-demand tailwind backs the buy-and-hold thesis.
- At projected returns (-3.0% appreciation + 1.6% rent growth), your $10k cash investment doubles in ~1 year — after that, you're playing with house money.
Negotiation context
- It's been on market 35 days — a 3% lower offer ($34k) is reasonable based on typical stale-listing flexibility.
Risks & watch-outs
- Climate carrying-cost: moderate flood risk; extreme-heat days projected 7→14/yr by 2055 (HVAC capex compounding) — expect insurance premiums to compound above CPI over the hold.
Questions for the listing agent
- It's been on market 35 days. Have you received any prior offers? Is the seller open to a 3% concession, seller financing, or rate buy-down credit?
- Built in 1965 — when were the roof, HVAC, electrical panel, plumbing, and water heater last replaced?
- Is there a deadline driving the sale (1031 exchange, divorce, estate, relocation)? That informs how much negotiation room exists.
- Schools are D-rated, which usually means shorter tenancies and higher turnover. Who's the typical renter profile here, and what's been the actual vacancy rate?
- Crime grade is F in this area — have there been break-ins, vandalism, or insurance claims at this property in the last 3 years? What carrier currently insures it and at what premium?
- The area grade is low — what's the realistic commute time and amenity access for the typical tenant pool here? Any planned neighborhood developments (good or bad) we should know about?
- What's the average days-on-market for RENTAL listings here right now (not sales)? A rising rental-DOM trend means longer vacancies and softer asking-rent achievability than the comps imply.
- What's the recent tenant-quality profile in this submarket — average credit score on applications, eviction rate, late-payment / NSF rate, and stable-employment percentage? A property-management company in the area should have these aggregated.
- How much new for-sale + rental construction is in the pipeline within 1–3 miles? Heavy new supply typically softens prices + rents 12–24 months out; constrained supply supports both.
Investment metrics
- 1% rule
- 5.77% ✓
- Cap rate
- 52.69%
- Cash-on-cash
- 165.69%
- DSCR
- 8.37
- GRM
- 1.4
CMA / ARV
- ARV (on-the-fly)
- $104,000
- Comps found
- 1
Show comp detail 1 sale within ~0.75 mi
| Address | Dist | Beds/Ba | Sqft | Sold | Price | $/sf | Match |
|---|---|---|---|---|---|---|---|
| 8476 W Stockton Blvd #37 | 0.03mi | 1/1.0 | 480 (-4%) | 13mo | $99,900 | $208 | 81 |
Match score weights: distance 35% · size 25% · config 20% · recency 20%. Top-matched comps best support the ARV.
Projected returns pro-forma
-3.0% appreciation · 1.59% rent growth · sell at horizon
- IRR
- —
- Equity multiple
- 8.93×
- Total profit
- $77,718
- Equity at exit
- $5,219
- IRR
- —
- Equity multiple
- 18.09×
- Total profit
- $167,508
- Equity at exit
- $3,026
Cash invested: $9,800 (down + closing). Projections, not guarantees.
Landlord ↔ Tenant lean methodology
- Overall (STATE)
- 18 Strongly Tenant-Friendly
- State California
- 18 Strongly Tenant-Friendly · D+13
- County
- — inherits STATE
- City
- — inherits STATE
ZIP-level market 95758
- Home prices YoY
- -23.5%
- Rents YoY
- 1.6%
- Active inventory
- 180
- Price-to-rent
- 1.4×
Monthly cashflow live
- Estimated rent
- $2,019 medium interval (Pro) →
- Mortgage (P&I)
- −$184
- Tax est. 1.5%
- −$44 /mo · $525/yr
- Insurance
- −$15
- HOA
- −$0
- Vacancy / Maint / Mgmt
- −$424
- Net cashflow
- $1,353
Break-even live
UW: 25.0% down · 7.5% · 30yr · 1.5% tax · 5.0% vac · 8.0% maint · 8.0% mgmt
Financing live
Cash to close
- Down payment
- $8,750
- Closing costs
- $1,050
- Reserves months
- —
- Total cash needed
- —
Loan-product check · same deal, 3 products live
Conventional
25% down · 7.5% · 30yr
- Down + closing
- —
- Monthly P&I
- —
- Monthly cashflow
- —
- DSCR
- —
- Eligible?
- —
Personal DTI + credit; lowest rate.
DSCR
20% down · 8.5% · 30yr
- Down + closing
- —
- Monthly P&I
- —
- Monthly cashflow
- —
- DSCR
- —
- Eligible?
- —
No personal income docs; deal must DSCR.
Hard money
10% down · 12.0% · 12mo
- Down + closing
- —
- Monthly P&I
- —
- Monthly cashflow
- —
- DSCR
- —
- Eligible?
- —
Short-term bridge; refi at stabilization.
Rent comps 3 comps
| Address | Beds | Baths | Sqft | Rent | $/sqft | DOM | Units | Dist |
|---|---|---|---|---|---|---|---|---|
| 8282 Calvine Rd Sacramento, CA | 1.0–3.0 | 1.0–2.0 | 1056 | $1,925 | $1.82 | 2d | 17 | 0.54mi |
| 8117 Sheldon Rd Elk Grove, CA | 1.0–3.0 | 1.0–2.0 | 1011 | $2,128 | $2.10 | 2d | 18 | 0.59mi |
| 8231 Hardester Dr Sacramento, CA | 2.0 | 2.0 | 750 | $1,900 | $2.53 | 24d | 1 | 1.49mi |
Listing history 14 events
-
2026-06-18days on market $35,000 Active 35 DOM
-
2026-06-17days on market $35,000 Active 34 DOM
-
2026-06-16days on market $35,000 Active 33 DOM
-
2026-06-15days on market $35,000 Active 32 DOM
-
2026-06-13days on market $35,000 Active 30 DOM
-
2026-06-13days on market $35,000 Active 29 DOM
-
2026-06-09days on market $35,000 Active 26 DOM
-
2026-06-08days on market $35,000 Active 25 DOM
-
2026-06-07days on market $35,000 Active 24 DOM
-
2026-06-05days on market $35,000 Active 21 DOM
-
2026-06-03pricedays on market $35,000 Active 20 DOM
-
2026-06-02days on market $40,000 Active 19 DOM
-
2026-06-01days on market $40,000 Active 18 DOM
-
2026-05-31days on market $40,000 Active 17 DOM
ⓘ Source: listings_history table (triggers on properties + properties_extension) + one-shot
backfill from property_details.listing_events for pre-trigger history.
Climate risk First Street
- Flood 5/10 Major FEMA zone X (unshaded) · 27% chance over 30 yrs
- Wildfire 1/10 Low
- Heat 7/10 Severe 7 d/yr ≥102°F today · 14 d/yr by 30 yrs out
- Wind 1/10 Low
- Air quality 10/10 Extreme 25 unhealthy d/yr today · 27 by 30 yrs out
Nearby sold comps map
Loading sold comps map…
Walkable amenities ~0.75 mi
Loading nearby amenities…
Taxation est. · year 1
- Rental income
- $24,229
- − Mortgage interest
- −$1,961
- − Property taxes
- −$525
- − Insurance
- −$175
- − Repairs & maintenance
- −$1,938
- − Management
- −$1,938
- − Depreciation
- −$1,018
- Taxable income
- $16,673
- Est. tax owed @ 24.0%
- −$4,002
- After-tax cash flow
- $12,236/yr
For passive investors: Depreciation is non-cash, so a rental often shows a tax loss while cash-flowing — sheltering income. Rental losses are passive: they offset passive income freely, and up to $25,000/yr can offset ordinary (W-2) income if you actively participate and your MAGI is under $100k (phasing out to $0 by $150k); unused losses carry forward. On sale, claimed depreciation is recaptured at up to 25%, and gains may owe capital-gains tax (a 1031 exchange can defer both). Figures are a year-1 estimate at your 24.0% rate — not tax advice; consult a CPA.
Schools (NCES district)
- District
- Elk Grove Unified
- NCES district ID
- 0612330
- Math proficiency
- 40% ▼ -5.00%
- Reading proficiency
- 51% ▼ -5.00%
- Median HH income
- $67,860
- Composite
- 40.72/100
- National rank
- #3658
- State rank
- #165 of 517 in CA
Livability — Sacramento
- Score
- 71/100
- State rank
- #218
- US rank
- #6957
Category grades
Schools grade is shown separately in the Schools card above.
Census & demographics
- Census place
- Sacramento, CA
- County
- Sacramento County · 1,539,646 people
- City population
- 761,410
- Metro
- Sacramento-Roseville-Folsom, CA
- Population (ZIP)
- 65,725
- Household income
- $117,017
- Rent vs Own
- Severe rent burden
- 1653.0
Population outlook (Sacramento County) Hauer SSP2
- Today (2025)
- 1,660,763 people
- By 2030
- 1,732,990 · +4.3%
- By 2040
- 1,855,755 · +11.7%
- By 2050
- 1,941,335 · +16.9%
- By 2075
- 2,046,162 · +23.2%
- By 2100
- 1,961,444 · +18.1%
Race, ethnicity, and origin ACS 2023
- Neighborhood character
- Highly diverse neighborhood (Simpson 0.77)
- Race & ethnicity
- White 32% Asian 27% Hispanic / Latino 19% Two or more races 14% Black 12% Pacific Islander 2%
- Hispanic origin (detail)
- Mexican 15%
- Common ancestry
- Russian 2% Romanian 1% Italian 1%
- Foreign-born
- 25% · Canada, China, Vietnam
- Languages at home
- 64% English-only · Spanish 10% Chinese 6% Other Indo-European 6%
Political lean MEDSL · Sacramento
- 2024 margin
- D (+19.7) · D 58.1% · R 38.4% · Other 3.5%
- 2008→2024 swing
- +0.7pp no change · 2008: 19.0pp · 2024: 19.7pp
- All cycles
- 2024: D+19.7 2020: D+25.3 2016: D+23.7 2012: D+16.3 2008: D+19.0
Not yet ingested
- Civics
- —
Market trends
- HPI YoY
- ▼ -95.00%
- Current HPI
- 309.0545
- Rent YoY
- ▲ 1.59%
- Metro
- Sacramento-Roseville-Folsom, CA
- State GDP YoY
- ▲ 3.21%
- F500 in state
- 116
Industry mix (Fortune 500 HQ in CA)
| Industry | F500 HQs | Revenue |
|---|---|---|
| Technology | 27 | $1,492B |
|
||
| Financial Services | 3 | $174B |
|
||
| Retail | 3 | $44B |
|
||
| Insurance | 3 | $26B |
|
||
| Media / Entertainment | 2 | $115B |
|
||
| Pharmaceuticals / Biotech | 2 | $62B |
|
||
Cash-flow waterfall
monthlySold comps — $/sqft
last 12 mo · ≤1 miLoading sold comps…