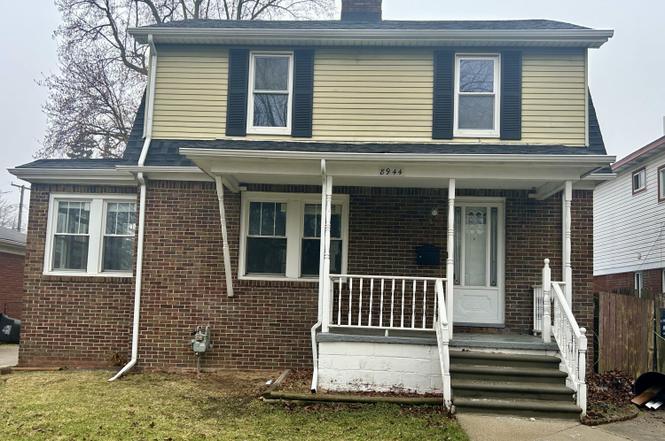
8944 William St · Taylor, MI
Flood risk 1/10 · Minimal
- FEMA flood zone
- X (unshaded)
- Chance of flooding over 30 yrs
- 0.0%
- Est. flood insurance / yr
- $473 – $860
Fire risk 1/10 · Minimal
- Est. fire insurance / yr
- $784 – $1,456
Heat risk 3/10 · Minor
- Hot days now (above 97°F)
- 7 days/yr
- Hot days in 30 yrs
- 15 days/yr
Wind risk 2/10 · Minimal
- Chance of severe wind over 30 yrs
- —
Air-quality risk 3/10 · Minor
- Unhealthy air days now
- 3 days/yr
- Unhealthy air days in 30 yrs
- 5 days/yr
Risk factors via First Street. Map © Google.
Why this score? — see what drove the C grade
The composite is a weighted blend of 9 inputs, each scored 0–100. Each bar is that input's sub-score; the figure is the points it added to the 100-point composite (weight × sub-score).
- Cash flow +19.8/30.0
- ARV discount +15.0/15.0
- 1% rule +7.1/10.0
- DSCR +6.3/10.0
- Livability +3.8/5.0
- Rent growth +3.7/5.0
- Condition / age +2.5/5.0
- Schools +1.8/10.0
- Appreciation +0.0/10.0
$150,300
🖨 Deal sheet (PDF) 📄 Offer letter ✓ Due diligence
Listing remarks MLS
Charming 3-bedroom, 1.5-bath colonial featuring a classic brick exterior and covered front porch. This home offers a spacious layout with great potential. Convenient location near local amenities. A great opportunity! Property is owned by the US Dept. of HUD - FHA Case #264-367046. Lead based paint notices. FHA insurability is IE (insured with escrow), subject to appraisal. HUD homes are sold as-is. Seller makes no representations or warranties as to property condition. Seller may contribute up to 3% for buyer's closing costs upon buyer request. Equal Housing Opportunity. Buyer and Buyer Agent to verify all information.
Key facts
- Covered front porch
- Brick exterior
- Convenient location
Tags
Neighborhood map
What this means for you Summary
Snapshot
- This is a 3-bed/1.0-bath single-family listed at $150k.
Deal economics
- At list price, monthly cash flow is $179 ($2k/yr) — positive.
- The deal already cash-flows at list — no discount required.
- Meets the 1% rule at list price ($2k rent vs $150k).
- Recommended offer: $146k (3.0% below list) — sets the bar for market timing.
- Cap rate 7.7% vs local median 5.4% in Taylor — top-decile yield for the area; either an underpriced asset or a hidden risk that comps aren't pricing in. Stress-test before assuming the spread holds.
Location & tenants
- Location reads 76/100 on livability (#144 in MI, #3,684 nationally) — a middle-class / working-renter tenant base. Strengths: commute A+, cost of living A+, housing A+; Watch: employment D+, schools F, crime F.
- Taylor School District (urban): math 14% / reading 27% proficiency, ranked #462 of 540 in MI (top 86%) — low school quality limits family demand, transient renter base, plan for 1-2y turnover; 68% free/reduced lunch — lower-income household profile, screen leases tightly.
- Market conditions: Rents rising fast (+4.9%/yr); 290 active listings in the ZIP; 6 comparable units currently listed for rent nearby; rentals leasing fast (median 4d on market — plan ~1-2 weeks tenant-placement turnaround); 2,639 units permitted in Wayne County in 2024 (1,216 in 5+ unit buildings).
- This rent runs 36% of the median local income ($61k/yr) — at the standard rent-burdened threshold; future hikes will face affordability resistance.
Forward outlook
- Local home prices are declining (-3.0%/yr); year-one equity from $1k of loan paydown is wiped out by about $5k of value loss. Plan a longer hold.
- Wayne County population projected at -17% by 2050 — secular population decline; favor cash flow + early exit over multi-decade hold.
Negotiation context
- It's been on market 48 days — a 3% lower offer ($146k) is reasonable based on typical stale-listing flexibility.
- 33 sale attempts since 30y ago; this cycle's ask has dropped $17k (10%) from the opening price — seller is motivated, your offer sets the floor, not the list.
Risks & watch-outs
- Watch-outs: property tax is 3.3% of price; built in 1927 — expect roof / HVAC / electrical / plumbing capex.
Questions for the listing agent
- It's been on market 48 days. Have you received any prior offers? Is the seller open to a 3% concession, seller financing, or rate buy-down credit?
- Built in 1927 — when were the roof, HVAC, electrical panel, plumbing, and water heater last replaced?
- Property tax is high relative to price — has the assessment been appealed recently, and will the sale trigger a re-assessment?
- Is there a deadline driving the sale (1031 exchange, divorce, estate, relocation)? That informs how much negotiation room exists.
- Schools are F-rated, which usually means shorter tenancies and higher turnover. Who's the typical renter profile here, and what's been the actual vacancy rate?
- Crime grade is F in this area — have there been break-ins, vandalism, or insurance claims at this property in the last 3 years? What carrier currently insures it and at what premium?
- What's the average days-on-market for RENTAL listings here right now (not sales)? A rising rental-DOM trend means longer vacancies and softer asking-rent achievability than the comps imply.
- What's the recent tenant-quality profile in this submarket — average credit score on applications, eviction rate, late-payment / NSF rate, and stable-employment percentage? A property-management company in the area should have these aggregated.
- How much new for-sale + rental construction is in the pipeline within 1–3 miles? Heavy new supply typically softens prices + rents 12–24 months out; constrained supply supports both.
Investment metrics
- 1% rule
- 1.21% ✓
- Cap rate
- 7.72%
- Cash-on-cash
- 5.10%
- DSCR
- 1.23
- GRM
- 6.9
CMA / ARV
- ARV (on-the-fly)
- $193,776
- Comps found
- 12
Show comp detail 12 sales within ~0.75 mi
| Address | Dist | Beds/Ba | Sqft | Sold | Price | $/sf | Match |
|---|---|---|---|---|---|---|---|
| 8944 William St | 0.00mi | 3/1.5 | 1,468 (0%) | 1mo | $150,300 | $102 | 97 |
| 8435 Clippert St | 0.22mi | 3/1.0 | 1,455 (-1%) | 1mo | $180,000 | $124 | 88 |
| 8411 Monroe Blvd | 0.30mi | 3/1.0 | 1,424 (-3%) | 3mo | $200,000 | $140 | 78 |
| 8018 Monroe Blvd | 0.49mi | 3/1.0 | 1,457 (-1%) | 2mo | $165,000 | $113 | 74 |
| 20945 Millard St | 0.30mi | 3/1.0 | 1,323 (-10%) | 5mo | $175,000 | $132 | 65 |
| 8818 Clippert St | 0.09mi | 4/1.0 (+1) | 1,249 (-15%) | 2mo | $190,000 | $152 | 64 |
| 20323 Champaign St | 0.69mi | 3/1.0 | 1,414 (-4%) | 1mo | $162,000 | $115 | 61 |
| 9228 Mueller St | 0.67mi | 3/2.0 | 1,495 (+2%) | 1mo | $225,000 | $151 | 60 |
| 22150 Haig St | 0.53mi | 3/1.5 | 1,569 (+7%) | 4mo | $144,500 | $92 | 58 |
| 8129 Clippert St | 0.38mi | 4/1.5 (+1) | 1,317 (-10%) | 2mo | $205,000 | $156 | 57 |
| 9444 Polk St | 0.50mi | 3/1.0 | 1,269 (-14%) | 1mo | $140,000 | $110 | 54 |
| 9749 Sylvester St | 0.74mi | 3/2.0 | 1,687 (+15%) | 0mo | $249,900 | $148 | 36 |
Match score weights: distance 35% · size 25% · config 20% · recency 20%. Top-matched comps best support the ARV.
Projected returns pro-forma
-3.0% appreciation · 4.9% rent growth · sell at horizon
- IRR
- -5.8%
- Equity multiple
- 0.78×
- Total profit
- $-9,256
- Equity at exit
- $22,410
- IRR
- 6.5%
- Equity multiple
- 1.53×
- Total profit
- $22,416
- Equity at exit
- $12,995
Cash invested: $42,084 (down + closing). Projections, not guarantees.
Landlord ↔ Tenant lean methodology
- Overall (STATE)
- 62 Landlord-Friendly
- State Michigan
- 62 Landlord-Friendly · EVEN
- County
- — inherits STATE
- City
- — inherits STATE
ZIP-level market 48180
- Rents YoY
- 4.9%
- Active inventory
- 290
- Price-to-rent
- 6.9×
Monthly cashflow live
- Estimated rent
- $1,823 high interval (Pro) →
- Mortgage (P&I)
- −$788
- Tax from tax record
- −$411 /mo · $4,929/yr
- Insurance
- −$63
- HOA
- −$0
- Vacancy / Maint / Mgmt
- −$383
- Net cashflow
- $179
Break-even live
Sensitivity live
| Price | -10% $264 | -5% $221 | +0% $179 | +5% $136 | +10% $94 |
|---|---|---|---|---|---|
| Rent | -10% $35 | -5% $107 | +0% $179 | +5% $251 | +10% $323 |
| Rate | -1.0pp $254 | -0.5pp $217 | base $179 | +0.5pp $140 | +1.0pp $100 |
UW: 25.0% down · 7.5% · 30yr · 1.5% tax · 5.0% vac · 8.0% maint · 8.0% mgmt
Financing live
Cash to close
- Down payment
- $37,575
- Closing costs
- $4,509
- Reserves months
- —
- Total cash needed
- —
Loan-product check · same deal, 3 products live
Conventional
25% down · 7.5% · 30yr
- Down + closing
- —
- Monthly P&I
- —
- Monthly cashflow
- —
- DSCR
- —
- Eligible?
- —
Personal DTI + credit; lowest rate.
DSCR
20% down · 8.5% · 30yr
- Down + closing
- —
- Monthly P&I
- —
- Monthly cashflow
- —
- DSCR
- —
- Eligible?
- —
No personal income docs; deal must DSCR.
Hard money
10% down · 12.0% · 12mo
- Down + closing
- —
- Monthly P&I
- —
- Monthly cashflow
- —
- DSCR
- —
- Eligible?
- —
Short-term bridge; refi at stabilization.
Rent comps 6 comps
| Address | Beds | Baths | Sqft | Rent | $/sqft | DOM | Units | Dist |
|---|---|---|---|---|---|---|---|---|
| 9651 Blaty St Taylor, MI | 3.0 | 2.0 | 1695 | $2,500 | $1.47 | 18d | 1 | 0.72mi |
| 9918 Allen Pointe Dr Allen Park, MI | 1.0–2.0 | 1.0–2.0 | 678 | $1,125 | $1.66 | 14d | 1 | 1.00mi |
| 23060 Bernard St Unit Upper Unit Taylor, MI | 2.0 | 1.0 | 922 | $1,400 | $1.52 | 0d | 1 | 1.21mi |
| 23060 Bernard St Taylor, MI | 3.0 | 1.0 | 1086 | $1,600 | $1.47 | 0d | 1 | 1.21mi |
| 24268 Haskell St Taylor, MI | 1.0–2.0 | 1.0 | 880 | $1,570 | $1.78 | 0d | 7 | 1.39mi |
| 9725 Ruth Allen Park, MI | 3.0 | 1.5 | 1110 | $1,800 | $1.62 | 4d | 1 | 1.41mi |
Listing history 50 events
-
2026-04-09status Pending 627-char remark
Show marketing remark (627 chars)
Charming 3-bedroom, 1.5-bath colonial featuring a classic brick exterior and covered front porch. This home offers a spacious layout with great potential. Convenient location near local amenities. A great opportunity! Property is owned by the US Dept. of HUD - FHA Case #264-367046. Lead based paint notices. FHA insurability is IE (insured with escrow), subject to appraisal. HUD homes are sold as-is. Seller makes no representations or warranties as to property condition. Seller may contribute up to 3% for buyer's closing costs upon buyer request. Equal Housing Opportunity. Buyer and Buyer Agent to verify all information.
-
2026-04-09status Pending
Show marketing remark (627 chars)
Charming 3-bedroom, 1.5-bath colonial featuring a classic brick exterior and covered front porch. This home offers a spacious layout with great potential. Convenient location near local amenities. A great opportunity! Property is owned by the US Dept. of HUD - FHA Case #264-367046. Lead based paint notices. FHA insurability is IE (insured with escrow), subject to appraisal. HUD homes are sold as-is. Seller makes no representations or warranties as to property condition. Seller may contribute up to 3% for buyer's closing costs upon buyer request. Equal Housing Opportunity. Buyer and Buyer Agent to verify all information.
-
2026-04-08price $150,300 627-char remark
Show marketing remark (627 chars)
Charming 3-bedroom, 1.5-bath colonial featuring a classic brick exterior and covered front porch. This home offers a spacious layout with great potential. Convenient location near local amenities. A great opportunity! Property is owned by the US Dept. of HUD - FHA Case #264-367046. Lead based paint notices. FHA insurability is IE (insured with escrow), subject to appraisal. HUD homes are sold as-is. Seller makes no representations or warranties as to property condition. Seller may contribute up to 3% for buyer's closing costs upon buyer request. Equal Housing Opportunity. Buyer and Buyer Agent to verify all information.
-
2026-04-07price $150,300 627-char remark
Show marketing remark (627 chars)
Charming 3-bedroom, 1.5-bath colonial featuring a classic brick exterior and covered front porch. This home offers a spacious layout with great potential. Convenient location near local amenities. A great opportunity! Property is owned by the US Dept. of HUD - FHA Case #264-367046. Lead based paint notices. FHA insurability is IE (insured with escrow), subject to appraisal. HUD homes are sold as-is. Seller makes no representations or warranties as to property condition. Seller may contribute up to 3% for buyer's closing costs upon buyer request. Equal Housing Opportunity. Buyer and Buyer Agent to verify all information.
-
2026-04-07price $150,300
Show marketing remark (627 chars)
Charming 3-bedroom, 1.5-bath colonial featuring a classic brick exterior and covered front porch. This home offers a spacious layout with great potential. Convenient location near local amenities. A great opportunity! Property is owned by the US Dept. of HUD - FHA Case #264-367046. Lead based paint notices. FHA insurability is IE (insured with escrow), subject to appraisal. HUD homes are sold as-is. Seller makes no representations or warranties as to property condition. Seller may contribute up to 3% for buyer's closing costs upon buyer request. Equal Housing Opportunity. Buyer and Buyer Agent to verify all information.
-
2026-02-20$167,000 Active 627-char remark
Show marketing remark (627 chars)
Charming 3-bedroom, 1.5-bath colonial featuring a classic brick exterior and covered front porch. This home offers a spacious layout with great potential. Convenient location near local amenities. A great opportunity! Property is owned by the US Dept. of HUD - FHA Case #264-367046. Lead based paint notices. FHA insurability is IE (insured with escrow), subject to appraisal. HUD homes are sold as-is. Seller makes no representations or warranties as to property condition. Seller may contribute up to 3% for buyer's closing costs upon buyer request. Equal Housing Opportunity. Buyer and Buyer Agent to verify all information.
-
2026-02-20$167,000 Active
Show marketing remark (627 chars)
Charming 3-bedroom, 1.5-bath colonial featuring a classic brick exterior and covered front porch. This home offers a spacious layout with great potential. Convenient location near local amenities. A great opportunity! Property is owned by the US Dept. of HUD - FHA Case #264-367046. Lead based paint notices. FHA insurability is IE (insured with escrow), subject to appraisal. HUD homes are sold as-is. Seller makes no representations or warranties as to property condition. Seller may contribute up to 3% for buyer's closing costs upon buyer request. Equal Housing Opportunity. Buyer and Buyer Agent to verify all information.
-
2025-01-01historical
-
2025-01-01historical
-
2024-09-24$170,000 Active
-
2024-09-24$170,000 Active
-
2021-12-13soldstatus $158,000 Sold
-
2021-12-13soldstatus $158,000
-
2021-12-13soldstatus $158,000 Closed
-
2021-11-07status Pending
-
2021-11-07status Pending
-
2021-11-02price $160,000
-
2021-11-02price $160,000
-
2021-10-22$165,000 Active
-
2021-10-22$165,000 Active
-
2021-10-20historical $165,000
-
2021-10-20historical $165,000
-
2021-10-20$160,000
-
2012-10-19soldstatus $25,000
-
2012-10-19soldstatus $25,000
-
2012-09-05historical
-
2012-09-05historical
-
2012-06-25$29,700
-
2012-06-25$29,700
-
2011-06-03historical
-
2011-06-03historical
-
2011-03-21$39,520
-
2011-03-21$39,520
-
2008-05-03historical
-
2008-04-07soldstatus $88,500
-
2008-03-21soldstatus $88,500
-
2008-03-21soldstatus $88,500
-
2008-03-21soldstatus $88,500
-
2008-02-12historical
-
2007-11-26$79,900
-
2007-11-26$79,900
-
2007-11-10historical
-
2007-11-03$89,900
-
2007-11-03$89,900
-
2007-10-21historical
-
2007-10-21historical
-
2007-10-21historical
-
2007-10-21historical
ⓘ Source: listings_history table (triggers on properties + properties_extension) + one-shot
backfill from property_details.listing_events for pre-trigger history.
Tax reassessment forecast MI · Partial reset (capped growth)
- Current annual tax
- $4,929 · $411/mo
- Projected year-2 tax
- $4,929 · $411/mo
- Expected delta
- $0/yr ($0/mo · 0.0%)
ⓘ Screening estimate from a state-policy table — verify with the county assessor before closing.
Climate risk First Street
- Flood 1/10 Low FEMA zone X (unshaded) · 0% chance over 30 yrs
- Wildfire 1/10 Low
- Heat 3/10 Moderate 7 d/yr ≥97°F today · 15 d/yr by 30 yrs out
- Wind 2/10 Low
- Air quality 3/10 Moderate 3 unhealthy d/yr today · 5 by 30 yrs out
Nearby sold comps map
Loading sold comps map…
Walkable amenities ~0.75 mi
Loading nearby amenities…
Taxation est. · year 1
- Rental income
- $21,878
- − Mortgage interest
- −$8,419
- − Property taxes
- −$4,929
- − Insurance
- −$752
- − Repairs & maintenance
- −$1,750
- − Management
- −$1,750
- − Depreciation
- −$4,372
- Taxable loss
- −$95
- Est. tax savings @ 24.0%
- +$23
- After-tax cash flow
- $2,167/yr
For passive investors: Depreciation is non-cash, so a rental often shows a tax loss while cash-flowing — sheltering income. Rental losses are passive: they offset passive income freely, and up to $25,000/yr can offset ordinary (W-2) income if you actively participate and your MAGI is under $100k (phasing out to $0 by $150k); unused losses carry forward. On sale, claimed depreciation is recaptured at up to 25%, and gains may owe capital-gains tax (a 1031 exchange can defer both). Figures are a year-1 estimate at your 24.0% rate — not tax advice; consult a CPA.
Schools (NCES district)
- District
- Taylor School District
- NCES district ID
- 2633540
- Math proficiency
- 14% ▼ -7.00%
- Reading proficiency
- 27% ▼ -4.00%
- Median HH income
- $43,062
- Composite
- 17.62/100
- National rank
- #9034
- State rank
- #462 of 540 in MI
Livability — Taylor
- Score
- 76/100
- State rank
- #144
- US rank
- #3684
Category grades
Schools grade is shown separately in the Schools card above.
Census & demographics
- Census place
- Taylor, MI
- County
- Wayne County · 1,562,939 people
- City population
- 62,081
- Metro
- Detroit-Warren-Dearborn, MI
- Population (ZIP)
- 62,081
- Household income
- $61,081
- Rent vs Own
- Severe rent burden
- 1957.0
Population outlook (Wayne County) Hauer SSP2
- Today (2025)
- 1,675,273 people
- By 2030
- 1,620,300 · -3.3%
- By 2040
- 1,502,341 · -10.3%
- By 2050
- 1,384,039 · -17.4%
- By 2075
- 1,124,592 · -32.9%
- By 2100
- 881,193 · -47.4%
Race, ethnicity, and origin ACS 2023
- Neighborhood character
- Majority White (65%)
- Race & ethnicity
- White 65% Black 19% Two or more races 9% Hispanic / Latino 9% Asian 2%
- Hispanic origin (detail)
- Mexican 6% Puerto Rican 2%
- Common ancestry
- Romanian 8% Lithuanian 3% Slovak 2%
- Foreign-born
- 7% · Canada
- Languages at home
- 89% English-only · Spanish 4% Arabic 3% Other Indo-European 3%
Political lean MEDSL · Wayne
- 2024 margin
- Strong D (+29.0) · D 62.7% · R 33.7% · Other 3.6%
- 2008→2024 swing
- -20.5pp toward R · 2008: 49.5pp · 2024: 29.0pp
- All cycles
- 2024: D+29.0 2020: D+38.1 2016: D+37.3 2012: D+46.9 2008: D+49.5
Not yet ingested
- Civics
- —
Market trends
- HPI YoY
- ▼ -212.33%
- Current HPI
- 228.921
- Rent YoY
- ▲ 4.90%
- Metro
- Detroit-Warren-Dearborn, MI
- State GDP YoY
- ▲ 1.37%
- F500 in state
- 28
Industry mix (Fortune 500 HQ in MI)
| Industry | F500 HQs | Revenue |
|---|---|---|
| Automotive Parts | 3 | $48B |
|
||
| Automotive | 2 | $372B |
|
||
| Chemicals | 1 | $45B |
|
||
| Automotive Retail | 1 | $29B |
|
||
| Healthcare / Medical Devices | 1 | $23B |
|
||
| Automotive Technology | 1 | $20B |
|
||
Price history
+54.2% since first listed75 events — show timeline
- 2026-04-09 Pending — MiRealSource-MiMLS
- 2026-04-09 Pending — REALCOMP
- 2026-04-09 Pending — SW Michigan MLS
- 2026-04-08 Price Changed $150,300 MiRealSource-MiMLS
- 2026-04-07 Price Changed $150,300 REALCOMP
- 2026-04-07 Price Changed $150,300 SW Michigan MLS
- 2026-02-20 Listed $167,000 REALCOMP
- 2026-02-20 Listed $167,000 SW Michigan MLS
- 2026-02-20 Listed $167,000 MiRealSource-MiMLS
- 2025-01-01 Listing Removed — MiRealSource-MiMLS
- 2025-01-01 Listing Removed — REALCOMP
- 2024-09-24 Listed $170,000 REALCOMP
- 2024-09-24 Listed $170,000 MiRealSource-MiMLS
- 2021-12-13 Sold (MLS) $158,000 MiRealSource-MiMLS
- 2021-12-13 Sold (MLS) $158,000 MiRealSource-MiMLS
- 2021-12-13 Sold (MLS) $158,000 REALCOMP
- 2021-11-07 Pending — MiRealSource-MiMLS
- 2021-11-07 Pending — REALCOMP
- 2021-11-02 Price Changed $160,000 MiRealSource-MiMLS
- 2021-11-02 Price Changed $160,000 REALCOMP
- 2021-10-22 Listed $165,000 MiRealSource-MiMLS
- 2021-10-22 Listed $165,000 REALCOMP
- 2021-10-20 Coming Soon $165,000 MiRealSource-MiMLS
- 2021-10-20 Coming Soon $165,000 REALCOMP
- 2021-10-20 Listed $160,000 MiRealSource-MiMLS
- 2012-10-19 Sold (MLS) $25,000 REALCOMP
- 2012-10-19 Sold (MLS) $25,000 MiRealSource-MiMLS
- 2012-09-05 Listing Removed — REALCOMP
- 2012-09-05 Listing Removed — MiRealSource-MiMLS
- 2012-06-25 Listed $29,700 REALCOMP
- 2012-06-25 Listed $29,700 MiRealSource-MiMLS
- 2011-06-03 Listing Removed — MiRealSource-MiMLS
- 2011-06-03 Listing Removed — REALCOMP
- 2011-03-21 Listed $39,520 MiRealSource-MiMLS
- 2011-03-21 Listed $39,520 REALCOMP
- 2008-05-03 Listing Removed — MiRealSource-MiMLS
- 2008-04-07 Sold (Public Records) $88,500 Public Records
- 2008-03-21 Sold (MLS) $88,500 REALCOMP
- 2008-03-21 Sold (MLS) $88,500 MiRealSource-MiMLS
- 2008-03-21 Sold (MLS) $88,500 REALCOMP
- 2008-02-12 Listing Removed — MiRealSource-MiMLS
- 2007-11-26 Listed $79,900 MiRealSource-MiMLS
- 2007-11-26 Listed $79,900 REALCOMP
- 2007-11-10 Listing Removed — MiRealSource-MiMLS
- 2007-11-03 Listed $89,900 REALCOMP
- 2007-11-03 Listed $89,900 MiRealSource-MiMLS
- 2007-10-21 Listing Removed — MiRealSource-MiMLS
- 2007-10-21 Listing Removed — MiRealSource-MiMLS
- 2007-10-21 Listing Removed — MiRealSource-MiMLS
- 2007-10-21 Listing Removed — MiRealSource-MiMLS
- 2007-09-06 Listed $89,900 REALCOMP
- 2007-09-06 Listed $89,900 MiRealSource-MiMLS
- 2007-08-21 Listed $99,900 REALCOMP
- 2007-08-21 Listed $99,900 MiRealSource-MiMLS
- 2007-07-17 Listed $104,900 REALCOMP
- 2007-07-17 Listed $104,900 MiRealSource-MiMLS
- 2007-06-16 Listed $104,900 REALCOMP
- 2007-06-16 Listing Removed — REALCOMP
- 2007-06-16 Listed $104,900 MiRealSource-MiMLS
- 2007-06-16 Listed $79,900 REALCOMP
- 2007-04-23 Listed $109,900 REALCOMP
- 2007-04-23 Listed $109,900 MiRealSource-MiMLS
- 2000-06-23 Sold (Public Records) $95,000 Public Records
- 2000-04-24 Sold (MLS) $95,000 REALCOMP
- 2000-04-24 Sold (MLS) $95,000 MiRealSource-MiMLS
- 2000-04-18 Sold (MLS) $95,000 REALCOMP
- 1999-10-05 Listed $99,900 REALCOMP
- 1999-10-05 Listed $99,900 REALCOMP
- 1999-10-05 Listed $99,900 MiRealSource-MiMLS
- 1998-07-14 Listing Removed — REALCOMP
- 1998-07-10 Listed $96,900 REALCOMP
- 1998-03-22 Listing Removed — REALCOMP
- 1997-09-22 Listed $95,500 REALCOMP
- 1997-02-22 Listing Removed — REALCOMP
- 1996-08-22 Listed $97,500 REALCOMP
Property tax history
+6.3%/yrLatest (2025): $4,929 · +4.9% YoY. Source: county tax records.
Cash-flow waterfall
monthlySold comps — $/sqft
last 12 mo · ≤1 miLoading sold comps…