 Multi-family
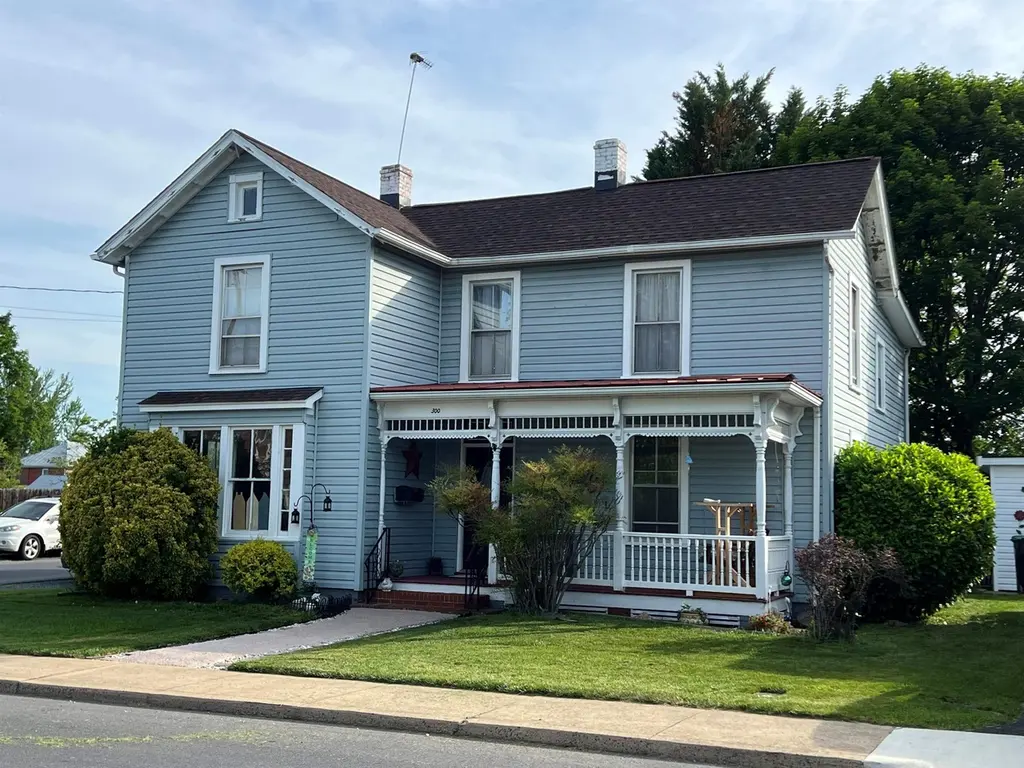
300 Broad St · Bridgewater, VA
Flood risk 4/10 · Minor
- FEMA flood zone
- X
- Chance of flooding over 30 yrs
- 0.21%
- Est. flood insurance / yr
- $507 – $1,088
Fire risk 2/10 · Minimal
- Est. fire insurance / yr
- $666 – $1,236
Heat risk 5/10 · Moderate
- Hot days now (above 101°F)
- 7 days/yr
- Hot days in 30 yrs
- 18 days/yr
Wind risk 2/10 · Minimal
- Chance of severe wind over 30 yrs
- 0.0%
Air-quality risk 1/10 · Minimal
- Unhealthy air days now
- 0 days/yr
- Unhealthy air days in 30 yrs
- 0 days/yr
Risk factors via First Street. Map © Google.
Why this score? — see what drove the C+ grade
The composite is a weighted blend of 9 inputs, each scored 0–100. Each bar is that input's sub-score; the figure is the points it added to the 100-point composite (weight × sub-score).
- Cash flow +26.8/30.0
- DSCR +9.2/10.0
- ARV discount +7.5/15.0
- 1% rule +6.1/10.0
- Schools +4.8/10.0
- Livability +3.6/5.0
- Rent growth +2.5/5.0
- Condition / age +2.5/5.0
- Appreciation +0.0/10.0
$359,900
🖨 Deal sheet 📄 Offer letter ✓ Due diligence
Multi-family units
County records classify this as Multi-Family (2-4 Unit). Listing-text estimate: 1 unit. estimate disagrees with records
Listing remarks
Step into the charm of small-town living with this spacious home in the heart of Bridgewater. Situated on a prominent corner lot just blocks from parks, dining, schools, and Bridgewater College, this property offers a rare combination of character, space, and convenience. With over 2,100 square feet of living space, the home features generously sized rooms, multiple living areas, and a flexible floor plan that can adapt to a variety of lifestyles. Whether you're looking for space to entertain, work from home, pursue hobbies, or accommodate a growing household, this property offers endless possibilities. Outside, the corner lot provides loads of yard space for gardening, recreation, or simpl
Key facts
- 0.24 acre lot
- Built 1900
- Listed 8 days
Property features AI
Exterior
- Utilities: Fiber optic available; Public sewer; Public water
- Home design: Detached duplex; Two stories; Below-grade unfinished area present
- Construction: Stick-built construction with vinyl siding; Poured foundation; Built as a duplex
- Exterior features: Fiber optic available; Public sewer; Public water
Interior
- Bathrooms: 1 full bathroom; 1 half bathroom (2 total bathrooms)
- Heating & cooling: Heat pump and natural gas heating; Central air and heat pump cooling
- Interior features: Interior entry basement
Neighborhood map
What this means for you Summary
Snapshot
- This is a 3-bed/1.5-bath multifamily listed at $360k.
Deal economics
- At list price, monthly cash flow is $988 ($12k/yr) — positive.
- The deal already cash-flows at list — no discount required.
- Meets the 1% rule at list price ($4k rent vs $360k).
- Cap rate 9.6% vs local median 3.6% in Bridgewater — top-decile yield for the area; either an underpriced asset or a hidden risk that comps aren't pricing in. Stress-test before assuming the spread holds.
Location & tenants
- Location reads 72/100 on livability (#190 in VA) — a middle-class / working-renter tenant base. Strengths: crime A+, housing A+, cost of living B; Watch: amenities F, commute F, health & safety D-.
- Rockingham County Public School District (rural): math 47% / reading 64% proficiency, ranked #77 of 131 in VA (top 59%) — acceptable for families but not a draw, mixed tenant base, ~2y average lease.
- Zoned schools: John W. Wayland Elementary (math 53% / reading 63%, grade C+, #583 of 1,108 statewide, top 53%, 516 students, 38% FRL); Wilbur S. Pence Middle (math 46% / reading 64%, grade B-, #189 of 342 statewide, top 56%, 668 students, 39% FRL); Turner Ashby High (math 78% / reading 82%, grade A, #60 of 319 statewide, top 19%, 994 students, 35% FRL).
- Market conditions: 35 active listings in the ZIP; 2 comparable units currently listed for rent nearby; 683 units permitted in Rockingham County in 2024 (0 in 5+ unit buildings).
Forward outlook
- Local home prices are declining (-3.0%/yr); year-one equity from $2k of loan paydown is wiped out by about $11k of value loss. Plan a longer hold.
- Rockingham County population projected at +6% by 2050 — modest demand growth; plan on rents tracking national, not racing it.
- At projected returns (-3.0% appreciation + 3.0% rent growth), your $101k cash investment doubles in ~10 years — after that, you're playing with house money.
Negotiation context
- Only 8 days on market — expect competitive offers; lowballing is unlikely to land.
- Current owner paid $112k; list at $360k implies a 223% gain — meaningful room to come down on a strong offer.
Risks & watch-outs
- Watch-outs: built in 1900 — expect roof / HVAC / electrical / plumbing capex.
- Climate carrying-cost: extreme-heat days projected 7→18/yr by 2055 (HVAC capex compounding) — expect insurance premiums to compound above CPI over the hold.
Questions for the listing agent
- Built in 1900 — when were the roof, HVAC, electrical panel, plumbing, and water heater last replaced?
- Is there a deadline driving the sale (1031 exchange, divorce, estate, relocation)? That informs how much negotiation room exists.
- Schools are A-rated — typically a magnet for longer-tenancy family renters. What's the average tenant stay here, and is there a school-zone premium baked into asking?
- What's the average days-on-market for RENTAL listings here right now (not sales)? A rising rental-DOM trend means longer vacancies and softer asking-rent achievability than the comps imply.
- What's the recent tenant-quality profile in this submarket — average credit score on applications, eviction rate, late-payment / NSF rate, and stable-employment percentage? A property-management company in the area should have these aggregated.
- How much new apartment / multifamily construction is in the pipeline within 1–3 miles? Heavy new supply (>2% of stock underway) typically softens rents 12–24 months out; light construction supports rent growth.
Investment metrics
- 1% rule
- 1.11% ✓
- Cap rate
- 9.59%
- Cash-on-cash
- 11.77%
- DSCR
- 1.52
- GRM
- 7.5
CMA / ARV
No comps found within radius.
Projected returns pro-forma
-3.0% appreciation · 3.0% rent growth · sell at horizon
- IRR
- 1.2%
- Equity multiple
- 1.04×
- Total profit
- $4,477
- Equity at exit
- $53,662
- IRR
- 10.8%
- Equity multiple
- 1.84×
- Total profit
- $84,388
- Equity at exit
- $31,118
Cash invested: $100,772 (down + closing). Projections, not guarantees.
Landlord ↔ Tenant lean methodology
- Overall (STATE)
- 55 Moderately Landlord-Leaning
- State Virginia
- 55 Moderately Landlord-Leaning · D+2
- County
- — inherits STATE
- City
- — inherits STATE
ZIP-level market 22812
- Active inventory
- 35
- Price-to-rent
- 15.0×
Monthly cashflow live
- Estimated rent
- $4,000 medium interval (Pro) →
- Mortgage (P&I)
- −$1,887
- Tax from tax record
- −$135 /mo · $1,616/yr
- Insurance
- −$150
- HOA
- −$0
- Vacancy / Maint / Mgmt
- −$840
- Net cashflow
- $988
Break-even live
2-unit breakdown (identical units grouped — click to expand)
| Units | Beds | Baths | Est. rent |
|---|---|---|---|
| 2× units | 3 | 1.5 | $4,000 |
| #1 | 3 | 1.5 | $2,000 |
| #2 | 3 | 1.5 | $2,000 |
| Total (2 units) | $4,000 | ||
UW: 25.0% down · 7.5% · 30yr · 1.5% tax · 5.0% vac · 8.0% maint · 8.0% mgmt
Financing live
Cash to close
- Down payment
- $89,975
- Closing costs
- $10,797
- Reserves months
- —
- Total cash needed
- —
Loan-product check · same deal, 3 products live
Conventional
25% down · 7.5% · 30yr
- Down + closing
- —
- Monthly P&I
- —
- Monthly cashflow
- —
- DSCR
- —
- Eligible?
- —
Personal DTI + credit; lowest rate.
DSCR
20% down · 8.5% · 30yr
- Down + closing
- —
- Monthly P&I
- —
- Monthly cashflow
- —
- DSCR
- —
- Eligible?
- —
No personal income docs; deal must DSCR.
Hard money
10% down · 12.0% · 12mo
- Down + closing
- —
- Monthly P&I
- —
- Monthly cashflow
- —
- DSCR
- —
- Eligible?
- —
Short-term bridge; refi at stabilization.
Rent comps 2 comps
| Address | Beds | Baths | Sqft | Rent | $/sqft | DOM | Units | Dist |
|---|---|---|---|---|---|---|---|---|
| 125 Joyce Dr Bridgewater, VA | 3.0 | 2.5 | 1444 | $2,000 | $1.39 | 43d | 1 | 1.04mi |
| 208 Scarlet Maple Ln Bridgewater, VA | 4.0 | 3.5 | 1827 | $2,200 | $1.20 | 43d | 1 | 1.33mi |
Listing history 12 events
-
2026-06-19days on market $359,900 Active 8 DOM
-
2026-06-18days on market $359,900 Active 7 DOM
-
2026-06-17days on market $359,900 Active 6 DOM
-
2026-06-16days on market $359,900 Active 5 DOM
-
2026-06-15days on market $359,900 Active 4 DOM
-
2026-06-14days on market $359,900 Active 2 DOM
-
2026-06-13statusdays on market $359,900 Active 1 DOM
-
2026-06-10days on market $359,900 Coming Soon 5 DOM
-
2026-06-09days on market $359,900 Coming Soon 4 DOM
-
2026-06-08days on market $359,900 Coming Soon 3 DOM
-
2026-06-07remarks 699-char remark
-
2026-06-07$359,900 Coming Soon 2 DOM
ⓘ Source: listings_history table (triggers on properties + properties_extension) + one-shot
backfill from property_details.listing_events for pre-trigger history.
Tax reassessment forecast VA · Resets to sale price
- Current annual tax
- $1,616 · $135/mo
- Projected year-2 tax
- $2,951 · $246/mo
- Expected delta
- +$1,336/yr (+$111/mo · 82.7%)
ⓘ Screening estimate from a state-policy table — verify with the county assessor before closing.
Climate risk First Street
- Flood 4/10 Moderate FEMA zone X · 21% chance over 30 yrs
- Wildfire 2/10 Low
- Heat 5/10 Major 7 d/yr ≥101°F today · 18 d/yr by 30 yrs out
- Wind 2/10 Low 0% chance of damaging wind over 30 yrs
- Air quality 1/10 Low 0 unhealthy d/yr today · 0 by 30 yrs out
Nearby sold comps map
Loading sold comps map…
Walkable amenities ~0.75 mi
Loading nearby amenities…
Taxation est. · year 1
- Rental income
- $48,000
- − Mortgage interest
- −$20,160
- − Property taxes
- −$1,616
- − Insurance
- −$1,800
- − Repairs & maintenance
- −$3,840
- − Management
- −$3,840
- − Depreciation
- −$10,470
- Taxable income
- $6,275
- Est. tax owed @ 24.0%
- −$1,506
- After-tax cash flow
- $10,351/yr
For passive investors: Depreciation is non-cash, so a rental often shows a tax loss while cash-flowing — sheltering income. Rental losses are passive: they offset passive income freely, and up to $25,000/yr can offset ordinary (W-2) income if you actively participate and your MAGI is under $100k (phasing out to $0 by $150k); unused losses carry forward. On sale, claimed depreciation is recaptured at up to 25%, and gains may owe capital-gains tax (a 1031 exchange can defer both). Figures are a year-1 estimate at your 24.0% rate — not tax advice; consult a CPA.
Schools (NCES district)
- District
- Rockingham County Public School District
- NCES district ID
- 5103390
- Math proficiency
- 47% ▼ -36.00%
- Reading proficiency
- 64% ▼ -12.00%
- Median HH income
- $53,178
- Composite
- 47.58/100
- National rank
- #2264
- State rank
- #77 of 131 in VA
Livability — Bridgewater
- Score
- 72/100
- State rank
- #190
- US rank
- #5925
Category grades
Schools grade is shown separately in the Schools card above.
Census & demographics
- Census place
- Bridgewater, VA
- Population (ZIP)
- 10,121
Population outlook (Rockingham County) Hauer SSP2
- Today (2025)
- 83,435 people
- By 2030
- 85,223 · +2.1%
- By 2040
- 87,667 · +5.1%
- By 2050
- 88,550 · +6.1%
- By 2075
- 90,331 · +8.3%
- By 2100
- 85,122 · +2.0%
Race, ethnicity, and origin ACS 2023
- Neighborhood character
- Predominantly White (87%)
- Race & ethnicity
- White 87% Hispanic / Latino 5% Black 4% Two or more races 4%
- Hispanic origin (detail)
- Mexican 3%
- Common ancestry
- Serbian 4% Scotch-Irish 3% Romanian 2%
- Foreign-born
- 7% · Canada
- Languages at home
- 88% English-only · Spanish 4% Russian/Polish/Slavic 4% Other Indo-European 2%
Political lean MEDSL · Rockingham
- 2024 margin
- Solid R (+37.0) · D 30.9% · R 68.0% · Other 1.1%
- 2008→2024 swing
- -1.0pp toward R · 2008: -36.0pp · 2024: -37.0pp
- All cycles
- 2024: R+37.0 2020: R+40.4 2016: R+43.5 2012: R+40.6 2008: R+36.0
Not yet ingested
- Civics
- —
Market trends
- HPI YoY
- ▼ -142.26%
- Current HPI
- 173.9769
- Rent YoY
- —
- Metro
- —
- State GDP YoY
- ▲ 2.40%
- F500 in state
- 50
Industry mix (Fortune 500 HQ in VA)
| Industry | F500 HQs | Revenue |
|---|---|---|
| Aerospace / Defense | 4 | $236B |
|
||
| Technology / Defense | 3 | $32B |
|
||
| Financial Services | 2 | $176B |
|
||
| Utilities | 2 | $27B |
|
||
| Insurance | 2 | $25B |
|
||
| Technology | 2 | $15B |
|
||
Price history
+222.8% since first listed2 events — show timeline
- 2026-06-06 Coming Soon $359,900 HRAR
- 1995-09-20 Sold (Public Records) $111,500 Public Records
Property tax history
+3.4%/yrLatest (2025): $1,616 · +0.0% YoY. Source: county tax records.
Cash-flow waterfall
monthlySold comps — $/sqft
last 12 mo · ≤1 miLoading sold comps…