 Triplex
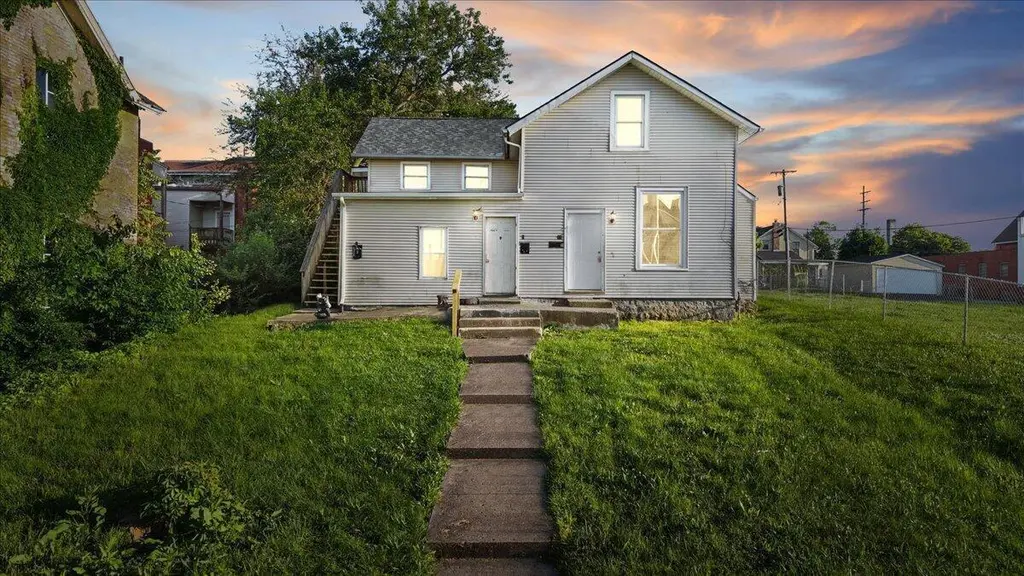
7 W Mulberry St · Springfield, OH
Flood risk 1/10 · Minimal
- FEMA flood zone
- X (unshaded)
- Chance of flooding over 30 yrs
- 0.0%
- Est. flood insurance / yr
- $473 – $860
Fire risk 1/10 · Minimal
- Est. fire insurance / yr
- $713 – $1,323
Heat risk 3/10 · Minor
- Hot days now (above 100°F)
- 7 days/yr
- Hot days in 30 yrs
- 18 days/yr
Wind risk 2/10 · Minimal
- Chance of severe wind over 30 yrs
- —
Air-quality risk 3/10 · Minor
- Unhealthy air days now
- 2 days/yr
- Unhealthy air days in 30 yrs
- 3 days/yr
Risk factors via First Street. Map © Google.
Why this score? — see what drove the C+ grade
The composite is a weighted blend of 9 inputs, each scored 0–100. Each bar is that input's sub-score; the figure is the points it added to the 100-point composite (weight × sub-score).
- Cash flow +30.0/30.0
- 1% rule +10.0/10.0
- DSCR +10.0/10.0
- ARV discount +4.7/15.0
- Livability +2.8/5.0
- Rent growth +2.5/5.0
- Condition / age +2.5/5.0
- Schools +1.9/10.0
- Appreciation +0.0/10.0
$129,900
🖨 Deal sheet 📄 Offer letter ✓ Due diligence
Multi-family units
County records classify this as Multi-Family (2-4 Unit). Listing-text estimate: 3 units. confirmed
Listing remarks MLS
Investment opportunity in Springfield! This triplex at 7-11 W. Mulberry St. offers a great addition to any investor's portfolio. The property features three units, including two 1-bedroom units and one studio apartment. Recent improvements include fresh paint, new LVP flooring, updates to a bathroom and kitchen, and several newer windows. Unit 7 has recently been painted, and Unit 11 has received new flooring and interior updates. The currently occupied unit is expected to be vacant in early June, providing flexibility for an owner-occupant or investor. Whether you're looking to expand your rental portfolio or explore the opportunity to occupy one unit while generating income from the others, this property offers excellent potential. Conveniently located near downtown Springfield, shopping, dining, and major roadways. Property information and room counts are believed to be accurate but should be independently verified by buyers
Key facts
- Updates to kitchen
- Fresh paint
- Updates to bathroom
Tags
Property features AI
Finance
- Financial info: Annual property tax listed: $819 (2025)
Exterior
- Home design: Mixed Use property; Built in 1861; Located on W Mulberry St near Fountain
- Construction: Historic construction (original build 1861)
- Exterior features: Lot approximately 0.14 acres
Interior
- Interior features: Mixed-use interior configuration; Three units in the building
Neighborhood map
What this means for you Summary
Snapshot
- This is a 3 × 1-bed/?-bath units multifamily listed at $130k.
Deal economics
- At list price, monthly cash flow is $1k ($16k/yr) — positive. Per door: $453/mo.
- The deal already cash-flows at list — no discount required.
- Meets the 1% rule at list price ($3k rent vs $130k).
- Recommended offer: $128k (1.5% below list) — sets the bar for market timing.
- Cap rate 18.8% vs local median 4.8% in Springfield — top-decile yield for the area; either an underpriced asset or a hidden risk that comps aren't pricing in. Stress-test before assuming the spread holds.
Location & tenants
- Location reads 56/100 on livability (#1,108 in OH) — a working-class tenant base; expect higher turnover. Strengths: cost of living A+, housing A+; Watch: crime F, amenities F, commute F.
- Springfield City School District (urban): math 20% / reading 27% proficiency, ranked #616 of 656 in OH (top 94%) — low school quality limits family demand, transient renter base, plan for 1-2y turnover; 75% free/reduced lunch — lower-income household profile, screen leases tightly.
- Market conditions: 45 active listings in the ZIP; 12 comparable units currently listed for rent nearby; rentals at typical pace (median 15d on market — plan ~3-4 weeks tenant-placement turnaround); lower-income renter base — watch delinquency; 232 units permitted in Clark County in 2024 (116 in 5+ unit buildings).
- At $2,736/mo this rent would consume 78% of the median local household income ($42k/yr) (locally 684% of renters already pay >50% of income on rent) — very limited rent-growth headroom before tenants either downsize or default.
Forward outlook
- Local home prices are declining (-3.0%/yr); year-one equity from $898 of loan paydown is wiped out by about $4k of value loss. Plan a longer hold.
- Clark County population projected at -16% by 2050 — secular population decline; favor cash flow + early exit over multi-decade hold.
- At projected returns (-3.0% appreciation + 3.0% rent growth), your $36k cash investment doubles in ~3 years — after that, you're playing with house money.
Negotiation context
- It's been on market 21 days — a 2% lower offer ($128k) is reasonable based on typical stale-listing flexibility.
- 3 sale attempts; this cycle's ask has dropped $20k (13%) from the opening price — seller is motivated, your offer sets the floor, not the list.
Risks & watch-outs
- Watch-outs: built in 1861 — expect roof / HVAC / electrical / plumbing capex.
Questions for the listing agent
- Can we see the unit-by-unit rent roll, current vacancy, and any below-market leases? What's the average tenancy length?
- What capital expenditures (roof, boiler, parking lot, exteriors) have been made in the last 5 years, and what's planned in the next 2?
- Built in 1861 — when were the roof, HVAC, electrical panel, plumbing, and water heater last replaced?
- Is there a deadline driving the sale (1031 exchange, divorce, estate, relocation)? That informs how much negotiation room exists.
- Crime grade is F in this area — have there been break-ins, vandalism, or insurance claims at this property in the last 3 years? What carrier currently insures it and at what premium?
- What's the average days-on-market for RENTAL listings here right now (not sales)? A rising rental-DOM trend means longer vacancies and softer asking-rent achievability than the comps imply.
- What's the recent tenant-quality profile in this submarket — average credit score on applications, eviction rate, late-payment / NSF rate, and stable-employment percentage? A property-management company in the area should have these aggregated.
- How much new apartment / multifamily construction is in the pipeline within 1–3 miles? Heavy new supply (>2% of stock underway) typically softens rents 12–24 months out; light construction supports rent growth.
Investment metrics
- 1% rule
- 2.11% ✓
- Cap rate
- 18.84%
- Cash-on-cash
- 44.80%
- DSCR
- 2.99
- GRM
- 4.0
CMA / ARV
- ARV (on-the-fly)
- $122,360
- Comps found
- 7
Show comp detail 7 sales within ~0.75 mi
| Address | Dist | Beds/Ba | Sqft | Sold | Price | $/sf | Match |
|---|---|---|---|---|---|---|---|
| 1202 Clifton Ave | 0.66mi | 4/2.0 | 2,180 (-0%) | 4mo | $124,900 | $57 | 61 |
| 1202-1204 Clifton Ave | 0.67mi | 4/2.0 | 2,180 (-0%) | 4mo | $124,900 | $57 | 61 |
| 910 S Fountain Ave | 0.42mi | 4/— | 2,462 (+13%) | 11mo | $135,000 | $55 | 50 |
| 712 W Jefferson St | 0.68mi | 4/2.0 | 2,288 (+5%) | 12mo | $127,000 | $56 | 47 |
| 714 W Jefferson St | 0.68mi | 4/2.0 | 2,288 (+5%) | 12mo | $127,000 | $56 | 47 |
| 910-910.5 S Fountain Ave | 0.42mi | 4/2.0 | 2,462 (+13%) | 11mo | $135,000 | $55 | 46 |
| 18-20 W Perrin Ave | 0.71mi | 4/2.0 | 2,064 (-6%) | 13mo | $194,000 | $94 | 43 |
Match score weights: distance 35% · size 25% · config 20% · recency 20%. Top-matched comps best support the ARV.
Projected returns pro-forma
-3.0% appreciation · 3.0% rent growth · sell at horizon
- IRR
- 41.8%
- Equity multiple
- 2.80×
- Total profit
- $65,415
- Equity at exit
- $19,369
- IRR
- 48.0%
- Equity multiple
- 5.63×
- Total profit
- $168,253
- Equity at exit
- $11,231
Cash invested: $36,372 (down + closing). Projections, not guarantees.
Landlord ↔ Tenant lean methodology
- Overall (STATE)
- 73 Landlord-Friendly
- State Ohio
- 73 Landlord-Friendly · R+6
- County
- — inherits STATE
- City
- — inherits STATE
ZIP-level market 45506
- Home prices YoY
- -14.1%
- Active inventory
- 45
- Price-to-rent
- 11.9×
Monthly cashflow live
- Estimated rent
- $2,736 medium interval (Pro) →
- Mortgage (P&I)
- −$681
- Tax from tax record
- −$68 /mo · $819/yr
- Insurance
- −$54
- HOA
- −$0
- Vacancy / Maint / Mgmt
- −$575
- Net cashflow
- $1,358
Break-even live
3-unit breakdown (identical units grouped — click to expand)
| Units | Beds | Baths | Est. rent |
|---|---|---|---|
| 3× units | 1 | — | $2,736 |
| #1 | 1 | — | $912 |
| #2 | 1 | — | $912 |
| #3 | 1 | — | $912 |
| Total (3 units) | $2,736 | ||
UW: 25.0% down · 7.5% · 30yr · 1.5% tax · 5.0% vac · 8.0% maint · 8.0% mgmt
Financing live
Cash to close
- Down payment
- $32,475
- Closing costs
- $3,897
- Reserves months
- —
- Total cash needed
- —
Loan-product check · same deal, 3 products live
Conventional
25% down · 7.5% · 30yr
- Down + closing
- —
- Monthly P&I
- —
- Monthly cashflow
- —
- DSCR
- —
- Eligible?
- —
Personal DTI + credit; lowest rate.
DSCR
20% down · 8.5% · 30yr
- Down + closing
- —
- Monthly P&I
- —
- Monthly cashflow
- —
- DSCR
- —
- Eligible?
- —
No personal income docs; deal must DSCR.
Hard money
10% down · 12.0% · 12mo
- Down + closing
- —
- Monthly P&I
- —
- Monthly cashflow
- —
- DSCR
- —
- Eligible?
- —
Short-term bridge; refi at stabilization.
Rent comps 12 comps
| Address | Beds | Baths | Sqft | Rent | $/sqft | DOM | Units | Dist |
|---|---|---|---|---|---|---|---|---|
| 401 Section St Springfield, OH | 4.0 | 2.0 | 1612 | $1,850 | $1.15 | 11d | 1 | 0.46mi |
| 220 S Yellow Springs St Springfield, OH | 4.0 | 2.0 | 1456 | $1,645 | $1.13 | 23d | 1 | 0.50mi |
| 523 W Mulberry St Springfield, OH | 4.0 | 2.0 | 1456 | $1,825 | $1.25 | 11d | 1 | 0.50mi |
| 302 S Yellow Springs St Springfield, OH | 4.0 | 2.0 | 1456 | $1,845 | $1.27 | 11d | 1 | 0.50mi |
| 524 W Pleasant St Springfield, OH | 4.0 | 2.0 | 1456 | $1,645 | $1.13 | 11d | 1 | 0.51mi |
| 356 S Yellow Springs St Springfield, OH | 4.0 | 2.0 | 1606 | $1,825 | $1.14 | 11d | 1 | 0.52mi |
| 534 Homeview Ave Springfield, OH | 3.0 | 1.0 | 2660 | $1,200 | $0.45 | 44d | 1 | 0.53mi |
| 18 E Grand Ave Springfield, OH | 4.0 | 2.0 | 1452 | $1,575 | $1.08 | 19d | 1 | 0.54mi |
| 1306 S Limestone St Springfield, OH | 4.0 | 2.0 | 1452 | $1,695 | $1.17 | 21d | 1 | 0.73mi |
| 545 W Grand Ave Springfield, OH | 4.0 | 2.0 | 1456 | $1,595 | $1.10 | 3d | 1 | 0.80mi |
| 421 Catherine St Springfield, OH | 3.0 | 2.0 | 1498 | $1,500 | $1.00 | 44d | 1 | 0.95mi |
| 830 Oak St Unit 830 Springfield, OH | 4.0 | 1.5 | 1400 | $1,250 | $0.89 | 14d | 1 | 1.11mi |
Listing history 21 events
-
2026-06-19days on market $129,900 Active 21 DOM
-
2026-06-18days on market $129,900 Active 20 DOM
-
2026-06-17days on market $129,900 Active 19 DOM
-
2026-06-16days on market $129,900 Active 18 DOM
-
2026-06-15days on market $129,900 Active 17 DOM
-
2026-06-14days on market $129,900 Active 15 DOM
-
2026-06-12pricedays on market $129,900 Active 14 DOM
-
2026-06-09days on market $149,900 Active 11 DOM
-
2026-06-08days on market $149,900 Active 10 DOM
-
2026-06-07days on market $149,900 Active 9 DOM
-
2026-06-05days on market $149,900 Active 6 DOM
-
2026-06-02days on market $149,900 Active 4 DOM
-
2026-06-01days on market $149,900 Active 3 DOM
-
2026-05-31days on market $149,900 Active 2 DOM
-
2026-05-29$149,900 Active
Show marketing remark (941 chars)
Investment opportunity in Springfield! This triplex at 7-11 W. Mulberry St. offers a great addition to any investor's portfolio. The property features three units, including two 1-bedroom units and one studio apartment. Recent improvements include fresh paint, new LVP flooring, updates to a bathroom and kitchen, and several newer windows. Unit 7 has recently been painted, and Unit 11 has received new flooring and interior updates. The currently occupied unit is expected to be vacant in early June, providing flexibility for an owner-occupant or investor. Whether you're looking to expand your rental portfolio or explore the opportunity to occupy one unit while generating income from the others, this property offers excellent potential. Conveniently located near downtown Springfield, shopping, dining, and major roadways. Property information and room counts are believed to be accurate but should be independently verified by buyers
-
2026-05-29$149,900 Active 944-char remark
Show marketing remark (941 chars)
Investment opportunity in Springfield! This triplex at 7-11 W. Mulberry St. offers a great addition to any investor's portfolio. The property features three units, including two 1-bedroom units and one studio apartment. Recent improvements include fresh paint, new LVP flooring, updates to a bathroom and kitchen, and several newer windows. Unit 7 has recently been painted, and Unit 11 has received new flooring and interior updates. The currently occupied unit is expected to be vacant in early June, providing flexibility for an owner-occupant or investor. Whether you're looking to expand your rental portfolio or explore the opportunity to occupy one unit while generating income from the others, this property offers excellent potential. Conveniently located near downtown Springfield, shopping, dining, and major roadways. Property information and room counts are believed to be accurate but should be independently verified by buyers
-
2026-05-29$149,900 Active 941-char remark
Show marketing remark (941 chars)
Investment opportunity in Springfield! This triplex at 7-11 W. Mulberry St. offers a great addition to any investor's portfolio. The property features three units, including two 1-bedroom units and one studio apartment. Recent improvements include fresh paint, new LVP flooring, updates to a bathroom and kitchen, and several newer windows. Unit 7 has recently been painted, and Unit 11 has received new flooring and interior updates. The currently occupied unit is expected to be vacant in early June, providing flexibility for an owner-occupant or investor. Whether you're looking to expand your rental portfolio or explore the opportunity to occupy one unit while generating income from the others, this property offers excellent potential. Conveniently located near downtown Springfield, shopping, dining, and major roadways. Property information and room counts are believed to be accurate but should be independently verified by buyers
-
2025-08-14soldstatus $230,500
-
2013-09-19soldstatus $62,000
-
2001-07-27soldstatus $58,700
-
1992-03-25soldstatus $25,000
ⓘ Source: listings_history table (triggers on properties + properties_extension) + one-shot
backfill from property_details.listing_events for pre-trigger history.
Tax reassessment forecast OH · Partial reset (capped growth)
- Current annual tax
- $819 · $68/mo
- Projected year-2 tax
- $1,423 · $119/mo
- Expected delta
- +$604/yr (+$50/mo · 73.7%)
ⓘ Screening estimate from a state-policy table — verify with the county assessor before closing.
Climate risk First Street
- Flood 1/10 Low FEMA zone X (unshaded) · 0% chance over 30 yrs
- Wildfire 1/10 Low
- Heat 3/10 Moderate 7 d/yr ≥100°F today · 18 d/yr by 30 yrs out
- Wind 2/10 Low
- Air quality 3/10 Moderate 2 unhealthy d/yr today · 3 by 30 yrs out
Nearby sold comps map
Loading sold comps map…
Walkable amenities ~0.75 mi
Loading nearby amenities…
Taxation est. · year 1
- Rental income
- $32,832
- − Mortgage interest
- −$7,276
- − Property taxes
- −$819
- − Insurance
- −$650
- − Repairs & maintenance
- −$2,627
- − Management
- −$2,627
- − Depreciation
- −$3,779
- Taxable income
- $15,055
- Est. tax owed @ 24.0%
- −$3,613
- After-tax cash flow
- $12,681/yr
For passive investors: Depreciation is non-cash, so a rental often shows a tax loss while cash-flowing — sheltering income. Rental losses are passive: they offset passive income freely, and up to $25,000/yr can offset ordinary (W-2) income if you actively participate and your MAGI is under $100k (phasing out to $0 by $150k); unused losses carry forward. On sale, claimed depreciation is recaptured at up to 25%, and gains may owe capital-gains tax (a 1031 exchange can defer both). Figures are a year-1 estimate at your 24.0% rate — not tax advice; consult a CPA.
Schools (NCES district)
- District
- Springfield City School District
- NCES district ID
- 3904481
- Math proficiency
- 20% ▼ -16.00%
- Reading proficiency
- 27% ▼ -12.00%
- Median HH income
- $32,541
- Composite
- 19.12/100
- National rank
- #8834
- State rank
- #616 of 656 in OH
Livability — Springfield
- Score
- 56/100
- State rank
- #1108
- US rank
- #22551
Category grades
Schools grade is shown separately in the Schools card above.
Census & demographics
- Census place
- Springfield, OH
- County
- Clark County · 33,261 people
- City population
- 33,261
- Metro
- Springfield, OH
- Population (ZIP)
- 13,435
- Household income
- $42,104
- Rent vs Own
- Severe rent burden
- 684.0
Population outlook (Clark County) Hauer SSP2
- Today (2025)
- 130,703 people
- By 2030
- 126,952 · -2.9%
- By 2040
- 118,344 · -9.5%
- By 2050
- 109,590 · -16.2%
- By 2075
- 89,464 · -31.6%
- By 2100
- 68,810 · -47.4%
Race, ethnicity, and origin ACS 2023
- Neighborhood character
- Diverse neighborhood (Simpson 0.62)
- Race & ethnicity
- White 53% Black 30% Two or more races 10% Hispanic / Latino 8%
- Hispanic origin (detail)
- Mexican 4% Puerto Rican 1%
- Common ancestry
- Serbian 2% Romanian 1% Iranian 1%
- Foreign-born
- 4% · Canada
- Languages at home
- 95% English-only · Spanish 4% Other Asian/Pacific 1%
Political lean MEDSL · Clark
- 2024 margin
- Strong R (+29.5) · D 34.8% · R 64.3%
- 2008→2024 swing
- -27.0pp toward R · 2008: -2.5pp · 2024: -29.5pp
- All cycles
- 2024: R+29.5 2020: R+23.3 2016: R+19.5 2012: R+1.8 2008: R+2.5
Not yet ingested
- Civics
- —
Market trends
- HPI YoY
- ▼ -46.97%
- Current HPI
- 286.2883
- Rent YoY
- —
- Metro
- Springfield, OH
- State GDP YoY
- ▲ 1.98%
- F500 in state
- 48
Industry mix (Fortune 500 HQ in OH)
| Industry | F500 HQs | Revenue |
|---|---|---|
| Insurance | 3 | $145B |
|
||
| Industrial Machinery | 3 | $49B |
|
||
| Financial Services | 3 | $24B |
|
||
| Consumer Goods | 2 | $93B |
|
||
| Aerospace / Defense | 2 | $47B |
|
||
| Utilities | 2 | $33B |
|
||
Price history
+499.6% since first listed7 events — show timeline
- 2026-05-29 Listed $149,900 Dayton MLS
- 2026-05-29 Listed $149,900 WRIST
- 2026-05-29 Listed $149,900 CBRMLS
- 2025-08-14 Sold (Public Records) $230,500 Public Records
- 2013-09-19 Sold (Public Records) $62,000 Public Records
- 2001-07-27 Sold (Public Records) $58,700 Public Records
- 1992-03-25 Sold (Public Records) $25,000 Public Records
Property tax history
+0.5%/yrLatest (2025): $819 · -9.5% YoY. Source: county tax records.
Cash-flow waterfall
monthlySold comps — $/sqft
last 12 mo · ≤1 miLoading sold comps…