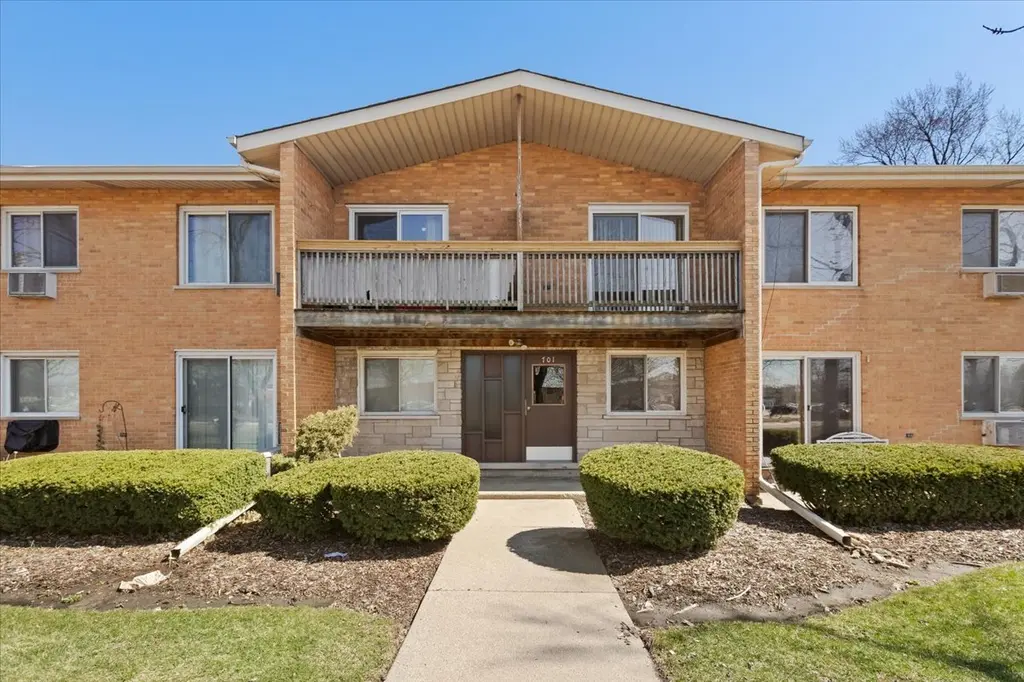
701 S Elmhurst Rd Unit H · Des Plaines, IL
Flood risk 4/10 · Minor
- FEMA flood zone
- X (unshaded)
- Chance of flooding over 30 yrs
- 0.2%
- Est. flood insurance / yr
- $507 – $1,088
Fire risk 1/10 · Minimal
- Est. fire insurance / yr
- $804 – $1,492
Heat risk 3/10 · Minor
- Hot days now (above 100°F)
- 7 days/yr
- Hot days in 30 yrs
- 14 days/yr
Wind risk 2/10 · Minimal
- Chance of severe wind over 30 yrs
- 0.0%
Air-quality risk 4/10 · Minor
- Unhealthy air days now
- 5 days/yr
- Unhealthy air days in 30 yrs
- 7 days/yr
Risk factors via First Street. Map © Google.
Why this score? — see what drove the D grade
The composite is a weighted blend of 9 inputs, each scored 0–100. Each bar is that input's sub-score; the figure is the points it added to the 100-point composite (weight × sub-score).
- Cash flow +10.2/30.0
- ARV discount +8.7/15.0
- 1% rule +4.3/10.0
- Livability +4.2/5.0
- Schools +3.9/10.0
- Rent growth +3.7/5.0
- DSCR +2.9/10.0
- Condition / age +2.5/5.0
- Appreciation +0.0/10.0
$195,000
🖨 Deal sheet 📄 Offer letter ✓ Due diligence
Listing remarks
Bright and inviting 2-bedroom second floor unit with a west-facing private balcony and modern updates throughout. This move-in ready home features freshly painted walls in neutral tones, creating a warm and welcoming feel from the moment you walk in. The spacious living room flows seamlessly into a large kitchen with room for an eat-in table, complete with brand-new stainless-steel appliances and direct access to the balcony-perfect for enjoying natural breezes and evening sunsets. A long hallway provides added privacy and leads to two generously sized bedrooms. New windows enhance natural light throughout the unit. Two dedicated parking spaces are included for added convenience. No rentals
Key facts
- $329 HOA
- 2 parking spots
- Built 1973
Neighborhood map
What this means for you Summary
Snapshot
- This is a 2-bed/1.0-bath condo listed at $195k.
Deal economics
- At list price, monthly cash flow is $-112 ($-1k/yr) — negative.
- To cash-flow at today's rent, offer at most $175k (10.1% below list).
- To meet the 1% rule (rent ≥ 1% of price), the offer needs to be $181k (7.0% below list).
- Recommended offer: $175k (10.1% below list) — sets the bar for cash-flow.
- Cap rate 5.6% vs local median 3.6% in Des Plaines — top-decile yield for the area; either an underpriced asset or a hidden risk that comps aren't pricing in. Stress-test before assuming the spread holds.
Location & tenants
- Location reads 83/100 on livability (#58 in IL, #1,038 nationally) — a professional / high-income tenant draw. Strengths: commute A+, employment A+, housing A+.
- Township Hsd 214 (suburban): math 42% / reading 45% proficiency, ranked #103 of 620 in IL (top 17%) — families likely to look elsewhere, expect single-tenant / working-renter base with shorter leases.
- Market conditions: Rents rising fast (+4.7%/yr); 126 active listings in the ZIP; 21 comparable units currently listed for rent nearby; rentals leasing fast (median 1d on market — plan ~1-2 weeks tenant-placement turnaround); solid renter incomes; 6,272 units permitted in Cook County in 2024 (4,658 in 5+ unit buildings).
Forward outlook
- Local home prices are declining (-3.0%/yr); year-one equity from $1k of loan paydown is wiped out by about $6k of value loss. Plan a longer hold.
Negotiation context
- It's been on market 85 days — a 6% lower offer ($183k) is reasonable based on typical stale-listing flexibility.
- Current owner paid $88k; list at $195k implies a 122% gain — meaningful room to come down on a strong offer.
Questions for the listing agent
- What do current leases actually rent for vs. the listed asking? Can we see a recent rent roll and the last 12 months of T-12 income?
- It's been on market 85 days. Have you received any prior offers? Is the seller open to a 10% concession, seller financing, or rate buy-down credit?
- Built in 1973 — when were the roof, HVAC, electrical panel, plumbing, and water heater last replaced?
- What does the HOA fee cover, when was the last increase, and are there any pending special assessments or reserve-fund shortfalls?
- Any open or pending special assessments — roof, HVAC, plumbing, elevator, façade? What's the per-unit balance and payoff schedule, and is the seller paying it off at close or rolling it to the buyer?
- Why hasn't it sold? Are there any deal-killer items the seller is aware of (foundation, flood, title, zoning, code violations)?
- Is there a deadline driving the sale (1031 exchange, divorce, estate, relocation)? That informs how much negotiation room exists.
- Schools are B-rated — typically a magnet for longer-tenancy family renters. What's the average tenant stay here, and is there a school-zone premium baked into asking?
- The area grade is low — what's the realistic commute time and amenity access for the typical tenant pool here? Any planned neighborhood developments (good or bad) we should know about?
- What's the average days-on-market for RENTAL listings here right now (not sales)? A rising rental-DOM trend means longer vacancies and softer asking-rent achievability than the comps imply.
- What's the recent tenant-quality profile in this submarket — average credit score on applications, eviction rate, late-payment / NSF rate, and stable-employment percentage? A property-management company in the area should have these aggregated.
- How much new apartment / multifamily construction is in the pipeline within 1–3 miles? Heavy new supply (>2% of stock underway) typically softens rents 12–24 months out; light construction supports rent growth.
Investment metrics
- 1% rule
- 0.93% ✗
- Cap rate
- 5.61%
- Cash-on-cash
- -2.46%
- DSCR
- 0.89
- GRM
- 9.0
CMA / ARV
- ARV (median comp)
- $200,446
- List price
- $195,000
- Delta
- -2.72%
- Verdict
- FAIR
- Comps
- 20 within 1.0 mi
Projected returns pro-forma
-3.0% appreciation · 4.74% rent growth · sell at horizon
- IRR
- -18.1%
- Equity multiple
- 0.35×
- Total profit
- $-35,336
- Equity at exit
- $29,075
- IRR
- -6.7%
- Equity multiple
- 0.53×
- Total profit
- $-25,599
- Equity at exit
- $16,860
Cash invested: $54,600 (down + closing). Projections, not guarantees.
Landlord ↔ Tenant lean methodology
- Overall (STATE)
- 43 Moderately Tenant-Leaning
- State Illinois
- 43 Moderately Tenant-Leaning · D+7
- County
- — inherits STATE
- City
- — inherits STATE
ZIP-level market 60016
- Rents YoY
- 4.7%
- Active inventory
- 126
- Price-to-rent
- 9.0×
Monthly cashflow live
- Estimated rent
- $1,813 high interval (Pro) →
- Mortgage (P&I)
- −$1,023
- Tax from tax record
- −$111 /mo · $1,336/yr
- Insurance
- −$81
- HOA
- −$329
- Vacancy / Maint / Mgmt
- −$381
- Net cashflow
- $-112
Break-even live
UW: 25.0% down · 7.5% · 30yr · 1.5% tax · 5.0% vac · 8.0% maint · 8.0% mgmt
Financing live
Cash to close
- Down payment
- $48,750
- Closing costs
- $5,850
- Reserves months
- —
- Total cash needed
- —
Loan-product check · same deal, 3 products live
Conventional
25% down · 7.5% · 30yr
- Down + closing
- —
- Monthly P&I
- —
- Monthly cashflow
- —
- DSCR
- —
- Eligible?
- —
Personal DTI + credit; lowest rate.
DSCR
20% down · 8.5% · 30yr
- Down + closing
- —
- Monthly P&I
- —
- Monthly cashflow
- —
- DSCR
- —
- Eligible?
- —
No personal income docs; deal must DSCR.
Hard money
10% down · 12.0% · 12mo
- Down + closing
- —
- Monthly P&I
- —
- Monthly cashflow
- —
- DSCR
- —
- Eligible?
- —
Short-term bridge; refi at stabilization.
Rent comps 21 comps
| Address | Beds | Baths | Sqft | Rent | $/sqft | DOM | Units | Dist |
|---|---|---|---|---|---|---|---|---|
| 1300 S Elmhurst Rd Mount Prospect, IL | 1.0–3.0 | 1.0–2.0 | 950 | $1,950 | $2.05 | 1d | 1 | 0.24mi |
| 601 W Huntington Commons Rd Mount Prospect, IL | 2.0 | 1.5 | 1100 | $2,300 | $2.09 | 1d | 1 | 0.29mi |
| 710 W Huntington Commons Rd Unit 2B Mt Prospect, IL | 2.0 | 1.0 | 900 | $1,699 | $1.89 | 10d | 1 | 0.41mi |
| 710 W Huntington Commons Rd Unit 3A Mt Prospect, IL | 1.0 | 1.0 | 750 | $1,450 | $1.93 | 13d | 1 | 0.41mi |
| 710 W Huntington Commons Rd Unit 1A Mt Prospect, IL | 1.0 | 1.0 | 700 | $1,350 | $1.93 | 16d | 1 | 0.41mi |
| 1105 Holiday Ln #7 Des Plaines, IL | 1.0 | 1.0 | 750 | $1,500 | $2.00 | 20d | 1 | 0.45mi |
| 1308 S Sir Galahad Ln Mount Prospect, IL | 2.0 | 1.0 | 850 | $1,660 | $1.95 | 1d | 2 | 0.45mi |
| 1107 Holiday Ln Des Plaines, IL | 1.0 | 1.0 | 700 | $1,400 | $2.00 | 1d | 1 | 0.46mi |
| 730 W Algonquin Rd Des Plaines, IL | 2.0 | 1.0–2.0 | 750 | $2,149 | $2.87 | 1d | 28 | 0.55mi |
| 726 Dempster St #5 Mt Prospect, IL | 2.0 | 1.0 | 1100 | $1,850 | $1.68 | 1d | 1 | 0.71mi |
| 1550 Dempster St Mt Prospect, IL | 1.0–3.0 | 1.0–2.0 | 1225 | $1,964 | $1.60 | 1d | 49 | 0.99mi |
| 1840 W Hatherleigh Ct Unit 2D Mount Prospect, IL | 1.0 | 1.0 | 750 | $1,500 | $2.00 | 1d | 1 | 1.12mi |
| 1900 W Knightsbridge Dr Unit 2A Mt Prospect, IL | 1.0 | 1.0 | 750 | $1,450 | $1.93 | 1d | 1 | 1.14mi |
| 1910 W Hatherleigh Ct Mount Prospect, IL | 1.0–2.0 | 1.0 | 900 | $1,650 | $1.83 | 21d | 2 | 1.15mi |
| 1910 W Hatherleigh Ct Unit 2E Mount Prospect, IL | 2.0 | 1.0 | 1100 | $1,650 | $1.50 | 10d | 1 | 1.16mi |
| 1703 W Mansard Ln Unit 103 Mt Prospect, IL | 2.0 | 1.0 | 800 | $1,650 | $2.06 | 1d | 1 | 1.19mi |
| 1706 Forest Cove Dr Mount Prospect, IL | 2.0 | 1.0 | 836 | $1,814 | $2.17 | 13d | 1 | 1.21mi |
| 1703 W Dennis Dr Unit 2 B Mt Prospect, IL | 2.0 | 1.0 | 900 | $1,675 | $1.86 | 1d | 1 | 1.23mi |
| 1958 W Algonquin Rd Mount Prospect, IL | 1.0–2.0 | 1.0–1.5 | 987 | $2,089 | $2.12 | 1d | 18 | 1.27mi |
| 165 Dover Dr #2 Des Plaines, IL | 1.0 | 1.0 | 550 | $1,400 | $2.55 | 1d | 1 | 1.31mi |
| 1119 E Algonquin Rd #2 Arlington Heights, IL | 2.0 | 1.0 | 1100 | $1,745 | $1.59 | 10d | 1 | 1.44mi |
HOA detail condo
- Monthly dues
- $329 · $3,948/yr
- Assessments
- None detected in remarks — confirm with the listing agent.
Listing history 18 events
-
2026-06-18days on market $195,000 Active 85 DOM
-
2026-06-17days on market $195,000 Active 84 DOM
-
2026-06-16days on market $195,000 Active 83 DOM
-
2026-06-15days on market $195,000 Active 82 DOM
-
2026-06-13days on market $195,000 Active 80 DOM
-
2026-06-10days on market $195,000 Active 77 DOM
-
2026-06-09days on market $195,000 Active 76 DOM
-
2026-06-08pricedays on market $195,000 Active 75 DOM
-
2026-06-07days on market $199,500 Active 74 DOM
-
2026-06-04days on market $199,500 Active 71 DOM
-
2026-06-03days on market $199,500 Active 70 DOM
-
2026-06-02days on market $199,500 Active 69 DOM
-
2026-06-01days on market $199,500 Active 68 DOM
-
2026-05-31days on market $199,500 Active 67 DOM
-
2024-12-11soldstatus $88,000
-
1993-01-22soldstatus $55,000
-
1990-08-28soldstatus $48,000
-
1980-04-23soldstatus $40,000
ⓘ Source: listings_history table (triggers on properties + properties_extension) + one-shot
backfill from property_details.listing_events for pre-trigger history.
Tax reassessment forecast IL · Partial reset (capped growth)
- Current annual tax
- $1,336 · $111/mo
- Projected year-2 tax
- $2,881 · $240/mo
- Expected delta
- +$1,545/yr (+$129/mo · 115.7%)
ⓘ Screening estimate from a state-policy table — verify with the county assessor before closing.
Climate risk First Street
- Flood 4/10 Moderate FEMA zone X (unshaded) · 20% chance over 30 yrs
- Wildfire 1/10 Low
- Heat 3/10 Moderate 7 d/yr ≥100°F today · 14 d/yr by 30 yrs out
- Wind 2/10 Low 0% chance of damaging wind over 30 yrs
- Air quality 4/10 Moderate 5 unhealthy d/yr today · 7 by 30 yrs out
Nearby sold comps map
Loading sold comps map…
Walkable amenities ~0.75 mi
Loading nearby amenities…
Taxation est. · year 1
- Rental income
- $21,759
- − Mortgage interest
- −$10,923
- − Property taxes
- −$1,336
- − Insurance
- −$975
- − Repairs & maintenance
- −$1,741
- − Management
- −$1,741
- − HOA
- −$3,948
- − Depreciation
- −$5,673
- Taxable loss
- −$4,577
- Est. tax savings @ 24.0%
- +$1,099
- After-tax cash flow
- $-242/yr
For passive investors: Depreciation is non-cash, so a rental often shows a tax loss while cash-flowing — sheltering income. Rental losses are passive: they offset passive income freely, and up to $25,000/yr can offset ordinary (W-2) income if you actively participate and your MAGI is under $100k (phasing out to $0 by $150k); unused losses carry forward. On sale, claimed depreciation is recaptured at up to 25%, and gains may owe capital-gains tax (a 1031 exchange can defer both). Figures are a year-1 estimate at your 24.0% rate — not tax advice; consult a CPA.
Schools (NCES district)
- District
- Township Hsd 214
- NCES district ID
- 1704170
- Math proficiency
- 42% ▼ -10.00%
- Reading proficiency
- 45% ▼ -4.00%
- Median HH income
- $68,267
- Composite
- 39.13/100
- National rank
- #4035
- State rank
- #103 of 620 in IL
Livability — Des Plaines
- Score
- 83/100
- State rank
- #58
- US rank
- #1038
Category grades
Schools grade is shown separately in the Schools card above.
Census & demographics
- Census place
- Des Plaines, IL
- County
- Cook County · 4,486,803 people
- City population
- 60,898
- Metro
- Chicago-Naperville-Elgin, IL-IN-WI
- Population (ZIP)
- 60,898
- Household income
- $86,571
- Rent vs Own
- Severe rent burden
- 1719.0
Population outlook (Cook County) Hauer SSP2
- Today (2025)
- 5,347,519 people
- By 2030
- 5,357,703 · +0.2%
- By 2040
- 5,324,924 · -0.4%
- By 2050
- 5,230,762 · -2.2%
- By 2075
- 4,785,735 · -10.5%
- By 2100
- 4,188,836 · -21.7%
Race, ethnicity, and origin ACS 2023
- Neighborhood character
- Diverse neighborhood (Simpson 0.65)
- Race & ethnicity
- White 52% Asian 22% Hispanic / Latino 17% Two or more races 10% Black 5%
- Hispanic origin (detail)
- Mexican 12% Puerto Rican 2%
- Common ancestry
- Romanian 13% Subsaharan African 2% Scotch-Irish 2%
- Foreign-born
- 38% · Canada, South Korea, China
- Languages at home
- 49% English-only · Russian/Polish/Slavic 13% Other Indo-European 12% Spanish 11%
Political lean MEDSL · Cook
- 2024 margin
- Solid D (+42.0) · D 70.4% · R 28.4% · Other 1.2%
- 2008→2024 swing
- -11.4pp toward R · 2008: 53.4pp · 2024: 42.0pp
- All cycles
- 2024: D+42.0 2020: D+50.3 2016: D+53.0 2012: D+49.4 2008: D+53.4
Not yet ingested
- Civics
- —
Market trends
- HPI YoY
- ▼ -238.52%
- Current HPI
- 223.0247
- Rent YoY
- ▲ 4.74%
- Metro
- Chicago-Naperville-Elgin, IL-IN-WI
- State GDP YoY
- ▲ 1.59%
- F500 in state
- 60
Industry mix (Fortune 500 HQ in IL)
| Industry | F500 HQs | Revenue |
|---|---|---|
| Insurance | 4 | $201B |
|
||
| Consumer Goods | 4 | $87B |
|
||
| Industrial Machinery | 3 | $64B |
|
||
| Healthcare | 2 | $55B |
|
||
| Retail / Pharmacy | 1 | $148B |
|
||
| Agriculture / Food | 1 | $86B |
|
||
Price history
+120.0% since first listed4 events — show timeline
- 2024-12-11 Sold (Public Records) $88,000 Public Records
- 1993-01-22 Sold (Public Records) $55,000 Public Records
- 1990-08-28 Sold (Public Records) $48,000 Public Records
- 1980-04-23 Sold (Public Records) $40,000 Public Records
Property tax history
+3.1%/yrLatest (2023): $1,336 · +8.5% YoY. Source: county tax records.
Cash-flow waterfall
monthlySold comps — $/sqft
last 12 mo · ≤1 miLoading sold comps…