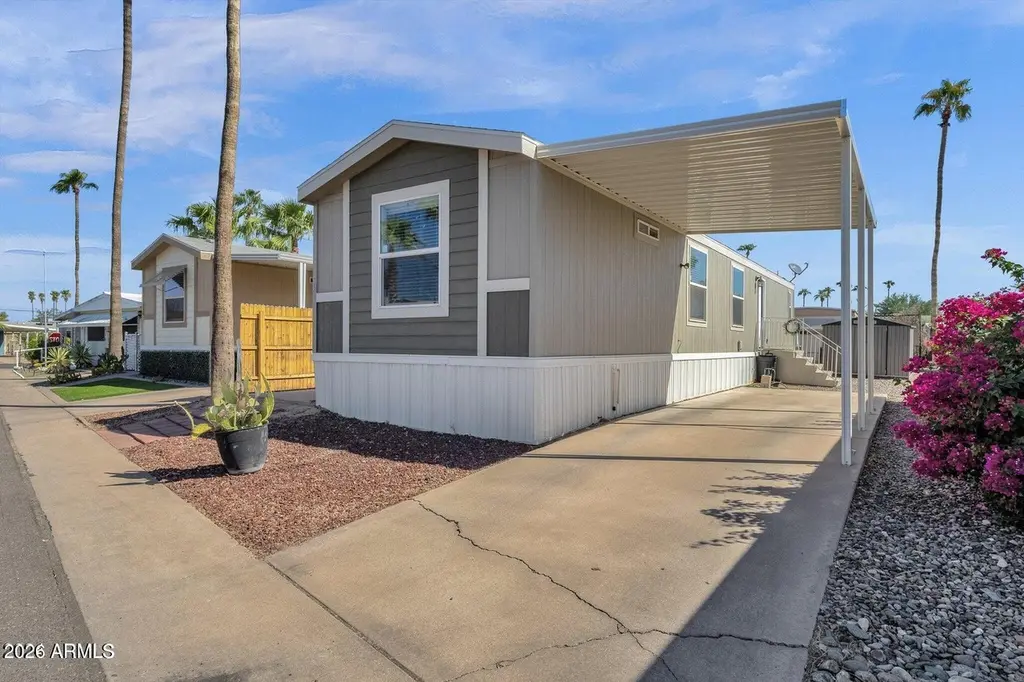
16225 N Cave Creek Rd #31 · Phoenix, AZ
Flood risk 1/10 · Minimal
- FEMA flood zone
- X (shaded)
- Chance of flooding over 30 yrs
- 0.0%
- Est. flood insurance / yr
- $507 – $1,088
Fire risk 1/10 · Minimal
- Est. fire insurance / yr
- $610 – $1,132
Heat risk 8/10 · Major
- Hot days now (above 110°F)
- 6 days/yr
- Hot days in 30 yrs
- 15 days/yr
Wind risk 1/10 · Minimal
- Chance of severe wind over 30 yrs
- —
Air-quality risk 3/10 · Minor
- Unhealthy air days now
- 2 days/yr
- Unhealthy air days in 30 yrs
- 3 days/yr
Risk factors via First Street. Map © Google.
Why this score? — see what drove the B grade
The composite is a weighted blend of 9 inputs, each scored 0–100. Each bar is that input's sub-score; the figure is the points it added to the 100-point composite (weight × sub-score).
- Cash flow +30.0/30.0
- 1% rule +10.0/10.0
- DSCR +10.0/10.0
- ARV discount +7.5/15.0
- Condition / age +4.0/5.0
- Schools +3.8/10.0
- Livability +3.8/5.0
- Rent growth +2.1/5.0
- Appreciation +0.0/10.0
$67,000
🖨 Deal sheet (PDF) 📄 Offer letter ✓ Due diligence
Listing remarks MLS
ON LEASED LAND - 55+ GATED COMMUNITY Beautiful 2 bed, 2 bath manufactured home, built in 2020, with all appliances including washer and dryer and a covered carport. Enjoy resort-style amenities: heated pool & spa, clubhouse with kitchen, billiards, shuffleboard, library, fitness center, and active social events. Low-maintenance landscaping. Easy access to shopping, restaurants, and transit. Buyer must be approved by park management. Motivated seller - don't miss this opportunity! Buyer to verify all facts and figures.
Key facts
- Gated community
- Fitness center
- Heated pool
Tags
Neighborhood map
What this means for you Summary
Snapshot
- This is a 2-bed/2.0-bath manufactured listed at $67k. Condition is rated good.
Deal economics
- At list price, monthly cash flow is $484 ($6k/yr) — positive.
- The deal already cash-flows at list — no discount required.
- Meets the 1% rule at list price ($1k rent vs $67k).
- Recommended offer: $61k (9.0% below list) — sets the bar for market timing.
- Cap rate 15.0% vs local median 3.3% in Phoenix — top-decile yield for the area; either an underpriced asset or a hidden risk that comps aren't pricing in. Stress-test before assuming the spread holds.
Location & tenants
- Location reads 75/100 on livability (#16 in AZ, #3,924 nationally) — a middle-class / working-renter tenant base. Strengths: amenities A+, commute A+, housing A+; Watch: health & safety C-, crime F.
- Paradise Valley Unified District (4241) (urban): math 39% / reading 46% proficiency, ranked #56 of 249 in AZ (top 22%) — families likely to look elsewhere, expect single-tenant / working-renter base with shorter leases.
- Market conditions: Rents soft (-1.5%/yr); 341 active listings in the ZIP; 40 comparable units currently listed for rent nearby; rentals at typical pace (median 26d on market — plan ~3-4 weeks tenant-placement turnaround); solid renter incomes; 36,011 units permitted in Maricopa County in 2024 (12,801 in 5+ unit buildings).
Forward outlook
- Local home prices are declining (-3.0%/yr); year-one equity from $463 of loan paydown is wiped out by about $2k of value loss. Plan a longer hold.
- Maricopa County population projected at +38% by 2050 — long-run rental-demand tailwind backs the buy-and-hold thesis.
- At projected returns (-3.0% appreciation + 0.0% rent growth), your $19k cash investment doubles in ~5 years — after that, you're playing with house money.
Negotiation context
- It's been on market 92 days — a 9% lower offer ($61k) is reasonable based on typical stale-listing flexibility.
- 4 sale attempts since 2y ago; this cycle's ask has dropped $6k (8%) from the opening price — seller is motivated, your offer sets the floor, not the list.
Risks & watch-outs
- Climate carrying-cost: extreme-heat days projected 6→15/yr by 2055 (HVAC capex compounding) — expect insurance premiums to compound above CPI over the hold.
Questions for the listing agent
- It's been on market 92 days. Have you received any prior offers? Is the seller open to a 9% concession, seller financing, or rate buy-down credit?
- Why hasn't it sold? Are there any deal-killer items the seller is aware of (foundation, flood, title, zoning, code violations)?
- Is there a deadline driving the sale (1031 exchange, divorce, estate, relocation)? That informs how much negotiation room exists.
- Crime grade is F in this area — have there been break-ins, vandalism, or insurance claims at this property in the last 3 years? What carrier currently insures it and at what premium?
- What's the average days-on-market for RENTAL listings here right now (not sales)? A rising rental-DOM trend means longer vacancies and softer asking-rent achievability than the comps imply.
- What's the recent tenant-quality profile in this submarket — average credit score on applications, eviction rate, late-payment / NSF rate, and stable-employment percentage? A property-management company in the area should have these aggregated.
- How much new for-sale + rental construction is in the pipeline within 1–3 miles? Heavy new supply typically softens prices + rents 12–24 months out; constrained supply supports both.
Investment metrics
- 1% rule
- 1.79% ✓
- Cap rate
- 14.97%
- Cash-on-cash
- 30.99%
- DSCR
- 2.38
- GRM
- 4.7
CMA / ARV
- ARV (median comp)
- $43,648
- List price
- $67,000
- Delta
- 53.50%
- Verdict
- OVERPRICED
- Comps
- 3 within 1.0 mi
Show comp detail 5 sales within ~0.75 mi
| Address | Dist | Beds/Ba | Sqft | Sold | Price | $/sf | Match |
|---|---|---|---|---|---|---|---|
| 16225 N Cave Creek Rd #32 | 0.00mi | 2/2.0 | 840 (0%) | 22mo | $79,900 | $95 | 82 |
| 16225 N Cave Creek Rd #106 | 0.00mi | 2/1.0 | 720 (-14%) | 12mo | $25,000 | $35 | 62 |
| 2618 E Sandra Ter | 0.24mi | 3/1.5 (+1) | 820 (-2%) | 21mo | $170,000 | $207 | 61 |
| 16225 N Cave Creek Rd #9 | 0.00mi | 2/1.0 | 720 (-14%) | 19mo | $9,000 | $13 | 56 |
| 2644 E Kelton Ln | 0.40mi | 2/1.8 | 932 (+11%) | 14mo | $225,900 | $242 | 50 |
Match score weights: distance 35% · size 25% · config 20% · recency 20%. Top-matched comps best support the ARV.
Projected returns pro-forma
-3.0% appreciation · 0.0% rent growth · sell at horizon
- IRR
- 22.3%
- Equity multiple
- 1.88×
- Total profit
- $16,500
- Equity at exit
- $9,990
- IRR
- 28.3%
- Equity multiple
- 3.16×
- Total profit
- $40,587
- Equity at exit
- $5,793
Cash invested: $18,760 (down + closing). Projections, not guarantees.
Landlord ↔ Tenant lean methodology
- Overall (STATE)
- 87 Strongly Landlord-Friendly
- State Arizona
- 87 Strongly Landlord-Friendly · R+3
- County
- — inherits STATE
- City
- — inherits STATE
ZIP-level market 85032
- Rents YoY
- -1.5%
- Active inventory
- 341
- Price-to-rent
- 4.7×
Monthly cashflow live
- Estimated rent
- $1,199 high interval (Pro) →
- Mortgage (P&I)
- −$351
- Tax est. 1.5%
- −$84 /mo · $1,005/yr
- Insurance
- −$28
- HOA
- −$0
- Vacancy / Maint / Mgmt
- −$252
- Net cashflow
- $484
Break-even live
Sensitivity live
| Price | -10% $531 | -5% $508 | +0% $484 | +5% $461 | +10% $438 |
|---|---|---|---|---|---|
| Rent | -10% $390 | -5% $437 | +0% $484 | +5% $532 | +10% $579 |
| Rate | -1.0pp $518 | -0.5pp $501 | base $484 | +0.5pp $467 | +1.0pp $449 |
UW: 25.0% down · 7.5% · 30yr · 1.5% tax · 5.0% vac · 8.0% maint · 8.0% mgmt
Financing live
Cash to close
- Down payment
- $16,750
- Closing costs
- $2,010
- Reserves months
- —
- Total cash needed
- —
Loan-product check · same deal, 3 products live
Conventional
25% down · 7.5% · 30yr
- Down + closing
- —
- Monthly P&I
- —
- Monthly cashflow
- —
- DSCR
- —
- Eligible?
- —
Personal DTI + credit; lowest rate.
DSCR
20% down · 8.5% · 30yr
- Down + closing
- —
- Monthly P&I
- —
- Monthly cashflow
- —
- DSCR
- —
- Eligible?
- —
No personal income docs; deal must DSCR.
Hard money
10% down · 12.0% · 12mo
- Down + closing
- —
- Monthly P&I
- —
- Monthly cashflow
- —
- DSCR
- —
- Eligible?
- —
Short-term bridge; refi at stabilization.
Rent comps 40 comps
| Address | Beds | Baths | Sqft | Rent | $/sqft | DOM | Units | Dist |
|---|---|---|---|---|---|---|---|---|
| 2424 E Grandview Rd Apt 310 Phoenix, AZ | 2.0 | 1.0 | 700 | $942 | $1.35 | 25d | 1 | 0.11mi |
| 2424 E Grandview Rd Unit 112 Phoenix, AZ | 1.0 | 1.0 | 550 | $856 | $1.56 | 25d | 1 | 0.11mi |
| 2424 E Grandview Rd Unit 107 Phoenix, AZ | 2.0 | 1.0 | 700 | $829 | $1.18 | 25d | 1 | 0.11mi |
| 2424 E Grandview Rd Unit 312 Phoenix, AZ | 1.0 | 1.0 | 550 | $856 | $1.56 | 23d | 1 | 0.11mi |
| 2424 E Grandview Rd Phoenix, AZ | 2.0 | 1.0 | 700 | $942 | $1.35 | 23d | 1 | 0.11mi |
| 2424 E Grandview Rd Phoenix, AZ | 2.0 | 1.0 | 700 | $1,159 | $1.66 | 25d | 1 | 0.11mi |
| 2424 E Grandview Rd Phoenix, AZ | 2.0 | 1.0 | 575 | $942 | $1.64 | 5d | 6 | 0.11mi |
| 16033 N 25th St Unit 102 Phoenix, AZ | 3.0 | 2.0 | 1050 | $1,350 | $1.29 | 8d | 1 | 0.19mi |
| 16621 N 25th St Phoenix, AZ | 1.0 | 1.0 | 570 | $899 | $1.58 | 8d | 1 | 0.28mi |
| 2616 E Monte Cristo Ave Unit 2624-2 Phoenix, AZ | 2.0 | 1.0 | 825 | $1,095 | $1.33 | 25d | 1 | 0.28mi |
| 2616 E Monte Cristo Ave Unit 2624-4 Phoenix, AZ | 2.0 | 1.0 | 825 | $999 | $1.21 | 6d | 1 | 0.28mi |
| 2432 E Tracy Ln Phoenix, AZ | 2.0 | 1.5 | 1000 | $1,375 | $1.38 | 19d | 1 | 0.30mi |
| 16627 N 25th St Unit 23 Phoenix, AZ | 2.0 | 1.0 | 765 | $1,145 | $1.50 | 25d | 1 | 0.34mi |
| 16437 N 31st St Phoenix, AZ | 1.0–2.0 | 1.0 | 687 | $1,049 | $1.53 | 3d | 4 | 0.36mi |
| 16801 N 26th St Apt 17 Phoenix, AZ | 2.0 | 1.0 | 800 | $1,195 | $1.49 | 25d | 1 | 0.40mi |
| 2201 E Kathleen Rd Phoenix, AZ | 3.0 | 2.0 | 1068 | $2,405 | $2.25 | 25d | 1 | 0.48mi |
| 2802 E Monte Cristo Ave Unit 102 Phoenix, AZ | 1.0 | 1.0 | 929 | $950 | $1.02 | 25d | 1 | 0.48mi |
| 2807 E Paradise Ln Unit 103 Phoenix, AZ | 3.0 | 3.0 | 1124 | $1,475 | $1.31 | 25d | 1 | 0.48mi |
| 15425 N 25th St Phoenix, AZ | 1.0–2.0 | 1.0 | 677 | $1,149 | $1.70 | 8d | 5 | 0.49mi |
| 2807 E Monte Cristo Ave Unit 102 Phoenix, AZ | 2.0 | 2.0 | 900 | $865 | $0.96 | 25d | 1 | 0.50mi |
| 15651 N 27th St Phoenix, AZ | 1.0–2.0 | 1.0–2.0 | 878 | $1,300 | $1.48 | 25d | 1 | 0.51mi |
| 15601 N 27th St Phoenix, AZ | 2.0 | 2.0–2.5 | 894 | $1,422 | $1.59 | 6d | 2 | 0.51mi |
| 2826 E Le Marche Ave Unit 102 Phoenix, AZ | 1.0 | 1.0 | 725 | $1,000 | $1.38 | 6d | 1 | 0.52mi |
| 2819 E Marconi Ave Unit 201 Phoenix, AZ | 2.0 | 2.0 | 900 | $950 | $1.06 | 25d | 1 | 0.53mi |
| 2814 E Kathleen Rd #102 Phoenix, AZ | 1.0 | 1.0 | 700 | $950 | $1.36 | 25d | 1 | 0.53mi |
| 2826 E Monte Cristo Ave Unit 203 Phoenix, AZ | 2.0 | 2.0 | 929 | $1,295 | $1.39 | 17d | 1 | 0.53mi |
| 2826 E Monte Cristo Ave Phoenix, AZ | 2.0 | 2.0 | 929 | $1,295 | $1.39 | 16d | 1 | 0.54mi |
| 15601 N 27th St #18 Phoenix, AZ | 2.0 | 2.0 | 888 | $1,495 | $1.68 | 15d | 1 | 0.56mi |
| 2718 E Beck Ln Unit 2 Phoenix, AZ | 2.0 | 2.0 | 950 | $1,295 | $1.36 | 25d | 1 | 0.56mi |
| 2838 E Monte Cristo Ave Unit 102 Phoenix, AZ | 1.0 | 1.0 | 780 | $1,200 | $1.54 | 8d | 1 | 0.56mi |
| 2821 E Kathleen Rd Phoenix, AZ | 2.0 | 2.0 | 1106 | $900 | $0.81 | 25d | 1 | 0.57mi |
| 2821 E Kathleen Rd Unit 101 Phoenix, AZ | 2.0 | 1.5 | 1106 | $900 | $0.81 | 25d | 1 | 0.57mi |
| 2822 E Kathleen Rd Unit 203 Phoenix, AZ | 2.0 | 2.0 | 850 | $1,100 | $1.29 | 6d | 1 | 0.57mi |
| 2726 E Beck Ln Unit 03 Phoenix, AZ | 2.0 | 2.0 | 916 | $1,295 | $1.41 | 25d | 1 | 0.57mi |
| 2844 E Marconi Ave Unit 101 Phoenix, AZ | 3.0 | 3.0 | 1123 | $1,550 | $1.38 | 23d | 1 | 0.58mi |
| 2837 E Marconi Ave Unit 102 Phoenix, AZ | 1.0 | 1.0 | 700 | $950 | $1.36 | 25d | 1 | 0.58mi |
| 2837 E Marconi Ave Unit 203 Phoenix, AZ | 2.0 | 1.0 | 900 | $975 | $1.08 | 25d | 1 | 0.58mi |
| 2725 E Beck Ln Phoenix, AZ | 2.0 | 2.0 | 916 | $1,395 | $1.52 | 15d | 1 | 0.60mi |
| 2615 E Greenway Rd Phoenix, AZ | 1.0–2.0 | 1.0 | 692 | $1,250 | $1.81 | 17d | 4 | 0.60mi |
| 2615 E Greenway Rd Apt 20 Phoenix, AZ | 1.0 | 1.0 | 650 | $1,200 | $1.85 | 25d | 1 | 0.60mi |
Listing history 25 events
-
2026-06-21days on market $67,000 Active 92 DOM
-
2026-06-18days on market $67,000 Active 89 DOM
-
2026-06-17days on market $67,000 Active 88 DOM
-
2026-06-16days on market $67,000 Active 87 DOM
-
2026-06-15days on market $67,000 Active 86 DOM
-
2026-06-13days on market $67,000 Active 84 DOM
-
2026-06-13days on market $67,000 Active 83 DOM
-
2026-06-09days on market $67,000 Active 80 DOM
-
2026-06-08days on market $67,000 Active 79 DOM
-
2026-06-07days on market $67,000 Active 78 DOM
-
2026-06-04days on market $67,000 Active 75 DOM
-
2026-06-03days on market $67,000 Active 74 DOM
-
2026-06-02days on market $67,000 Active 73 DOM
-
2026-06-01days on market $67,000 Active 72 DOM
-
2026-05-31days on market $67,000 Active 71 DOM
-
2026-04-23price $67,000 528-char remark
Show marketing remark (528 chars)
ON LEASED LAND - 55+ GATED COMMUNITY Beautiful 2 bed, 2 bath manufactured home, built in 2020, with all appliances including washer and dryer and a covered carport. Enjoy resort-style amenities: heated pool & spa, clubhouse with kitchen, billiards, shuffleboard, library, fitness center, and active social events. Low-maintenance landscaping. Easy access to shopping, restaurants, and transit. Buyer must be approved by park management. Motivated seller - don't miss this opportunity! Buyer to verify all facts and figures.
-
2026-03-21$72,500 Active 528-char remark
Show marketing remark (528 chars)
ON LEASED LAND - 55+ GATED COMMUNITY Beautiful 2 bed, 2 bath manufactured home, built in 2020, with all appliances including washer and dryer and a covered carport. Enjoy resort-style amenities: heated pool & spa, clubhouse with kitchen, billiards, shuffleboard, library, fitness center, and active social events. Low-maintenance landscaping. Easy access to shopping, restaurants, and transit. Buyer must be approved by park management. Motivated seller - don't miss this opportunity! Buyer to verify all facts and figures.
-
2025-11-24historical
-
2025-11-07price $74,500
-
2025-01-25price $79,850
-
2024-10-10$83,950 Active
-
2024-05-17historical
-
2024-05-04$85,000 Active
-
2024-03-31historical
-
2024-03-07$95,000 Active
ⓘ Source: listings_history table (triggers on properties + properties_extension) + one-shot
backfill from property_details.listing_events for pre-trigger history.
Climate risk First Street
- Flood 1/10 Low FEMA zone X (shaded) · 0% chance over 30 yrs
- Wildfire 1/10 Low
- Heat 8/10 Severe 6 d/yr ≥110°F today · 15 d/yr by 30 yrs out
- Wind 1/10 Low
- Air quality 3/10 Moderate 2 unhealthy d/yr today · 3 by 30 yrs out
Nearby sold comps map
Loading sold comps map…
Walkable amenities ~0.75 mi
Loading nearby amenities…
Taxation est. · year 1
- Rental income
- $14,392
- − Mortgage interest
- −$3,753
- − Property taxes
- −$1,005
- − Insurance
- −$335
- − Repairs & maintenance
- −$1,151
- − Management
- −$1,151
- − Depreciation
- −$1,949
- Taxable income
- $5,047
- Est. tax owed @ 24.0%
- −$1,211
- After-tax cash flow
- $4,602/yr
For passive investors: Depreciation is non-cash, so a rental often shows a tax loss while cash-flowing — sheltering income. Rental losses are passive: they offset passive income freely, and up to $25,000/yr can offset ordinary (W-2) income if you actively participate and your MAGI is under $100k (phasing out to $0 by $150k); unused losses carry forward. On sale, claimed depreciation is recaptured at up to 25%, and gains may owe capital-gains tax (a 1031 exchange can defer both). Figures are a year-1 estimate at your 24.0% rate — not tax advice; consult a CPA.
Condition & rehab AI · 12 photos
This 2020 manufactured home is in good condition with minimal repairs needed. It offers a good return on investment with updates that can significantly increase its value.
Value-add opportunities
- Both Paint exterior siding — Enhances curb appeal and value
- Both Replace carpet with tile or hardwood flooring — Improves durability and aesthetic
- Both Install new kitchen backsplash — Enhances kitchen aesthetics and value
- Both Upgrade lighting fixtures — Improves ambiance and energy efficiency
Renovation cost estimate screening
Value-add ROI direction
- Both Paint exterior siding — Enhances curb appeal and value ↑
- Both Replace carpet with tile or hardwood flooring — Improves durability and aesthetic ↑
- Both Install new kitchen backsplash — Enhances kitchen aesthetics and value ↑
- Both Upgrade lighting fixtures — Improves ambiance and energy efficiency ↑
ⓘ Cost ranges are severity-bucket heuristics (US national rule-of-thumb). Get contractor quotes + a written scope before underwriting a rehab budget.
Schools (NCES district)
- District
- Paradise Valley Unified District (4241)
- NCES district ID
- 0405930
- Math proficiency
- 39% ▼ -11.00%
- Reading proficiency
- 46% ▼ -7.00%
- Median HH income
- $64,106
- Composite
- 37.89/100
- National rank
- #4316
- State rank
- #56 of 249 in AZ
Livability — Phoenix
- Score
- 75/100
- State rank
- #16
- US rank
- #3924
Category grades
Schools grade is shown separately in the Schools card above.
Census & demographics
- Census place
- Phoenix, AZ
- County
- Maricopa County · 4,537,380 people
- City population
- 1,500,198
- Metro
- Phoenix-Mesa-Chandler, AZ
- Population (ZIP)
- 70,839
- Household income
- $78,643
- Rent vs Own
- Severe rent burden
- 2887.0
Population outlook (Maricopa County) Hauer SSP2
- Today (2025)
- 4,979,203 people
- By 2030
- 5,378,229 · +8.0%
- By 2040
- 6,156,598 · +23.6%
- By 2050
- 6,872,376 · +38.0%
- By 2075
- 8,401,270 · +68.7%
- By 2100
- 9,247,439 · +85.7%
Race, ethnicity, and origin ACS 2023
- Neighborhood character
- Diverse neighborhood (Simpson 0.57)
- Race & ethnicity
- White 59% Hispanic / Latino 29% Two or more races 17% Asian 4% Black 3% Native American 2%
- Hispanic origin (detail)
- Mexican 25%
- Common ancestry
- Romanian 2% Slovak 2% Portuguese 2%
- Foreign-born
- 18% · Canada, China
- Languages at home
- 71% English-only · Spanish 21% Russian/Polish/Slavic 2% Other Indo-European 1%
Political lean MEDSL · Maricopa
- 2024 margin
- Toss-up / Even · D 47.7% · R 51.2% · Other 1.1%
- 2008→2024 swing
- +7.1pp toward D · 2008: -10.6pp · 2024: -3.5pp
- All cycles
- 2024: R+3.5 2020: D+2.2 2016: R+3.5 2012: R+12.0 2008: R+10.6
Not yet ingested
- Civics
- —
Market trends
- HPI YoY
- ▼ -488.65%
- Current HPI
- 339.4181
- Rent YoY
- ▼ -1.46%
- Metro
- Phoenix-Mesa-Chandler, AZ
- State GDP YoY
- ▲ 4.54%
- F500 in state
- 20
Industry mix (Fortune 500 HQ in AZ)
| Industry | F500 HQs | Revenue |
|---|---|---|
| Technology | 2 | $13B |
|
||
| Mining / Metals | 1 | $23B |
|
||
| Environmental Services | 1 | $16B |
|
||
| Metals / Steel | 1 | $14B |
|
||
| Technology Distribution | 1 | $9B |
|
||
| Homebuilding | 1 | $8B |
|
||
Price history
-29.5% since first listed10 events — show timeline
- 2026-04-23 Price Changed $67,000 ARMLS
- 2026-03-21 Listed $72,500 ARMLS
- 2025-11-24 Listing Removed — ARMLS
- 2025-11-07 Price Changed $74,500 ARMLS
- 2025-01-25 Price Changed $79,850 ARMLS
- 2024-10-10 Listed $83,950 ARMLS
- 2024-05-17 Listing Removed — ARMLS
- 2024-05-04 Listed $85,000 ARMLS
- 2024-03-31 Listing Removed — ARMLS
- 2024-03-07 Listed $95,000 ARMLS
Cash-flow waterfall
monthlySold comps — $/sqft
last 12 mo · ≤1 miLoading sold comps…