23313 Sugar Maple Ct Unit 2C · Wildewood, MD
Flood risk No data
- FEMA flood zone
- —
- Chance of flooding over 30 yrs
- —
- Est. flood insurance / yr
- —
Fire risk No data
- Est. fire insurance / yr
- —
Heat risk No data
- Hot days now (above threshold)
- —
- Hot days in 30 yrs
- —
Wind risk No data
- Chance of severe wind over 30 yrs
- —
Air-quality risk No data
- Unhealthy air days now
- —
- Unhealthy air days in 30 yrs
- —
Risk factors via First Street. Map © Google.
Why this score? — see what drove the D grade
The composite is a weighted blend of 9 inputs, each scored 0–100. Each bar is that input's sub-score; the figure is the points it added to the 100-point composite (weight × sub-score).
- Cash flow +9.1/30.0
- ARV discount +7.5/15.0
- Appreciation +6.2/10.0
- 1% rule +4.5/10.0
- Rent growth +4.2/5.0
- Schools +3.0/10.0
- DSCR +2.5/10.0
- Livability +2.5/5.0
- Condition / age +2.5/5.0
$220,000
🖨 Deal sheet (PDF) 📄 Offer letter ✓ Due diligence
Listing remarks
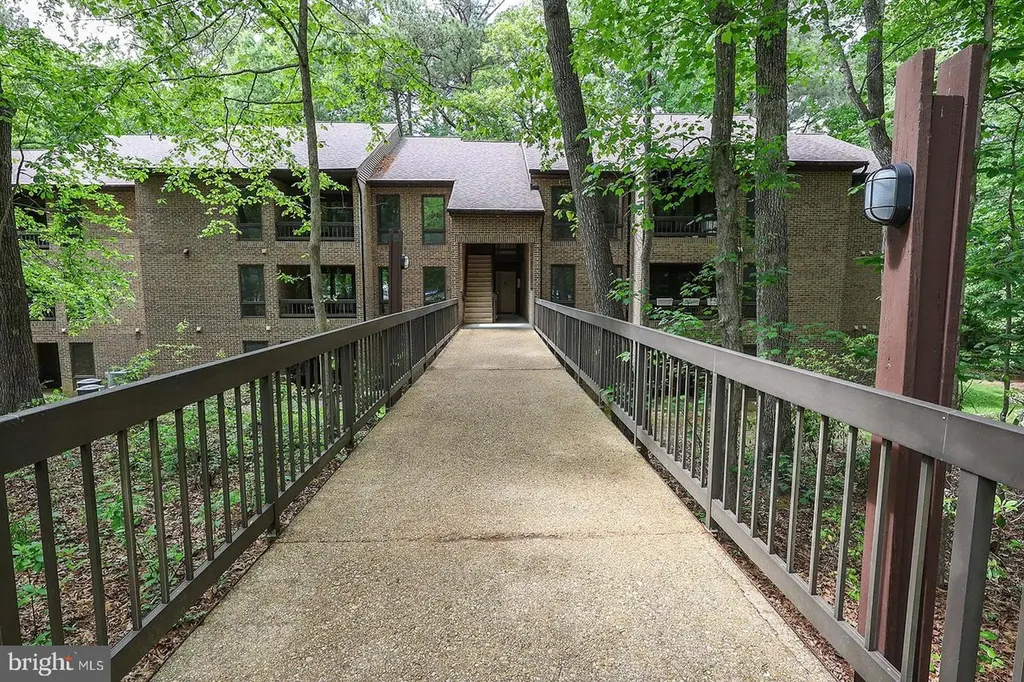
Ground (lower) level condo in convenient Wildewood Community with access to pool and clubhouse that comes with a one year home warranty! UNIT NUMBER ON DOOR IS #826. Condo dues are $275/mo and include trash and water utilities. The assigned parking is close to the condo and guest parking spots are also nearby. Move in ready with 2 Bedrooms and 1.5 bathrooms. The primary bedroom has a WIC w/ attached half bath. The balcony backs to woods and offers a nice space to sit outside. Great investment property or first time home buyer opportunity!
Key facts
- Access to clubhouse
- Access to pool
- Assigned parking
Tags
Property features AI
Finance
- Other: Fee simple ownership; Not in a federal flood zone; Finished above-grade area reported by assessor
- HOA & community: Condo fee $450 quarterly; HOA covers exterior building maintenance, lawn maintenance, management, and insurance; Community amenities include outdoor pool, playgrounds/tot lots, bike trail, jogging/walking path, and baseball field
Exterior
- Utilities: Public water; Public sewer
- Home design: Garden-style building (1–4 floors); Unit/flat; Entry on level 1; Facing: not specified
- Construction: Brick construction; Double pane windows; Above-grade and below-grade structures
- Exterior features: Patio; Sidewalks; Street lights; Community pool; Pets allowed on a case-by-case basis
Interior
- Kitchen: Dishwasher; Disposal; Electric oven/range; Range hood; Refrigerator; Exhaust fan
- Bedrooms: Master bedroom; Bedroom 2; Bedroom 6; Two bedrooms on the main level
- Bathrooms: One full bathroom; One half bathroom
- Heating & cooling: Heat pump heating; Electric heating fuel; Electric hot water; Electric cooling
- Interior features: Open floor plan; Combination dining and living area; Galley kitchen; Master bath; Window treatments; Sliding glass door
- Laundry & utility: Washer; Dryer; Washer/dryer stacked; Washer/dryer hookups in unit
Neighborhood map
What this means for you Summary
Snapshot
- This is a 2-bed/1.5-bath condo listed at $220k.
Deal economics
- At list price, monthly cash flow is $-168 ($-2k/yr) — negative.
- To cash-flow at today's rent, offer at most $196k (11.1% below list).
- To meet the 1% rule (rent ≥ 1% of price), the offer needs to be $209k (4.9% below list).
- Recommended offer: $196k (11.1% below list) — sets the bar for cash-flow.
- Cap rate 5.4% vs local median 3.9% in Wildewood — top-decile yield for the area; either an underpriced asset or a hidden risk that comps aren't pricing in. Stress-test before assuming the spread holds.
Location & tenants
- Location reads: area grade D — affects rentability + tenant quality, not the cash-flow math above.
- St. Mary'S County Public Schools (rural): math 23% / reading 38% proficiency, ranked #8 of 24 in MD (top 33%) — families likely to look elsewhere, expect single-tenant / working-renter base with shorter leases.
- Zoned schools: Evergreen Elementary School (math 32% / reading 32%, grade F, #176 of 860 statewide, top 21%, 736 students, 24% FRL); Esperanza Middle (math 18% / reading 41%, grade F, #67 of 225 statewide, top 32%, 875 students, 41% FRL); Leonardtown High (math 59% / reading 76%, grade B, #48 of 222 statewide, top 22%, 2,039 students, 21% FRL) — zoned schools at 29% FRL track the district average.
- Zoned-school proficiency averages 43% at this address vs 30% district-wide (+12 pts) — the actual schools serving this property are materially stronger than the St. Mary'S County Public Schools average implies; a family-tenant draw the district grade alone would hide.
- Market conditions: Rents rising fast (+6.7%/yr); 65 active listings in the ZIP; 1 comparable units currently listed for rent nearby; high-income renter base; 265 units permitted in St. Mary's County in 2024 (0 in 5+ unit buildings).
Forward outlook
- In year one you build about $7k of equity ($2k loan paydown + $5k appreciation (2.3% local appreciation)).
- St. Mary's County population projected at +16% by 2050 — long-run rental-demand tailwind backs the buy-and-hold thesis.
- By year 6, paydown + projected appreciation supports a ~$35k cash-out refi (75% LTV) — recoverable capital for the next deal without selling this one.
Negotiation context
- Only 4 days on market — expect competitive offers; lowballing is unlikely to land.
Questions for the listing agent
- What do current leases actually rent for vs. the listed asking? Can we see a recent rent roll and the last 12 months of T-12 income?
- What does the HOA fee cover, when was the last increase, and are there any pending special assessments or reserve-fund shortfalls?
- Any open or pending special assessments — roof, HVAC, plumbing, elevator, façade? What's the per-unit balance and payoff schedule, and is the seller paying it off at close or rolling it to the buyer?
- Is there a deadline driving the sale (1031 exchange, divorce, estate, relocation)? That informs how much negotiation room exists.
- The area grade is low — what's the realistic commute time and amenity access for the typical tenant pool here? Any planned neighborhood developments (good or bad) we should know about?
- What's the average days-on-market for RENTAL listings here right now (not sales)? A rising rental-DOM trend means longer vacancies and softer asking-rent achievability than the comps imply.
- What's the recent tenant-quality profile in this submarket — average credit score on applications, eviction rate, late-payment / NSF rate, and stable-employment percentage? A property-management company in the area should have these aggregated.
- How much new apartment / multifamily construction is in the pipeline within 1–3 miles? Heavy new supply (>2% of stock underway) typically softens rents 12–24 months out; light construction supports rent growth.
Investment metrics
- 1% rule
- 0.95% ✗
- Cap rate
- 5.37%
- Cash-on-cash
- -3.28%
- DSCR
- 0.85
- GRM
- 8.8
CMA / ARV
No comps found within radius.
Projected returns pro-forma
2.3% appreciation · 6.73% rent growth · sell at horizon
- IRR
- 4.7%
- Equity multiple
- 1.26×
- Total profit
- $16,148
- Equity at exit
- $90,425
- IRR
- 10.4%
- Equity multiple
- 2.58×
- Total profit
- $97,255
- Equity at exit
- $133,079
Cash invested: $61,600 (down + closing). Projections, not guarantees.
Landlord ↔ Tenant lean methodology
- Overall (STATE)
- 27 Tenant-Leaning
- State Maryland
- 27 Tenant-Leaning · D+14
- County
- — inherits STATE
- City
- — inherits STATE
ZIP-level market 20619
- Home prices YoY
- 1.0%
- Rents YoY
- 6.7%
- Active inventory
- 65
- Price-to-rent
- 8.8×
Monthly cashflow live
- Estimated rent
- $2,091 medium interval (Pro) →
- Mortgage (P&I)
- −$1,154
- Tax est. 1.5%
- −$275 /mo · $3,300/yr
- Insurance
- −$92
- HOA
- −$300
- Vacancy / Maint / Mgmt
- −$439
- Net cashflow
- $-168
Break-even live
Sensitivity live
| Price | -10% $-16 | -5% $-92 | +0% $-168 | +5% $-244 | +10% $-320 |
|---|---|---|---|---|---|
| Rent | -10% $-334 | -5% $-251 | +0% $-168 | +5% $-86 | +10% $-3 |
| Rate | -1.0pp $-58 | -0.5pp $-112 | base $-168 | +0.5pp $-225 | +1.0pp $-283 |
UW: 25.0% down · 7.5% · 30yr · 1.5% tax · 5.0% vac · 8.0% maint · 8.0% mgmt
Financing live
Cash to close
- Down payment
- $55,000
- Closing costs
- $6,600
- Reserves months
- —
- Total cash needed
- —
Loan-product check · same deal, 3 products live
Conventional
25% down · 7.5% · 30yr
- Down + closing
- —
- Monthly P&I
- —
- Monthly cashflow
- —
- DSCR
- —
- Eligible?
- —
Personal DTI + credit; lowest rate.
DSCR
20% down · 8.5% · 30yr
- Down + closing
- —
- Monthly P&I
- —
- Monthly cashflow
- —
- DSCR
- —
- Eligible?
- —
No personal income docs; deal must DSCR.
Hard money
10% down · 12.0% · 12mo
- Down + closing
- —
- Monthly P&I
- —
- Monthly cashflow
- —
- DSCR
- —
- Eligible?
- —
Short-term bridge; refi at stabilization.
Rent comps 1 comps
| Address | Beds | Baths | Sqft | Rent | $/sqft | DOM | Units | Dist |
|---|---|---|---|---|---|---|---|---|
| 23155 Park Place Way California, MD | 1.0–3.0 | 1.0–2.0 | 1039 | $2,215 | $2.13 | 6d | 1 | 1.33mi |
HOA detail condo
- Monthly dues
- $300 · $3,600/yr
- Likely covers
- watertrashpoolparking
- Assessments
- None detected in remarks — confirm with the listing agent.
Listing history 2 events
-
2026-05-08historical Active Under Contract
-
2026-05-03$220,000 Active
ⓘ Source: listings_history table (triggers on properties + properties_extension) + one-shot
backfill from property_details.listing_events for pre-trigger history.
Nearby sold comps map
Loading sold comps map…
Walkable amenities ~0.75 mi
Loading nearby amenities…
Taxation est. · year 1
- Rental income
- $25,093
- − Mortgage interest
- −$12,323
- − Property taxes
- −$3,300
- − Insurance
- −$1,100
- − Repairs & maintenance
- −$2,007
- − Management
- −$2,007
- − HOA
- −$3,600
- − Depreciation
- −$6,400
- Taxable loss
- −$5,645
- Est. tax savings @ 24.0%
- +$1,355
- After-tax cash flow
- $-666/yr
For passive investors: Depreciation is non-cash, so a rental often shows a tax loss while cash-flowing — sheltering income. Rental losses are passive: they offset passive income freely, and up to $25,000/yr can offset ordinary (W-2) income if you actively participate and your MAGI is under $100k (phasing out to $0 by $150k); unused losses carry forward. On sale, claimed depreciation is recaptured at up to 25%, and gains may owe capital-gains tax (a 1031 exchange can defer both). Figures are a year-1 estimate at your 24.0% rate — not tax advice; consult a CPA.
Schools (NCES district)
- District
- St. Mary'S County Public Schools
- NCES district ID
- 2400600
- Math proficiency
- 23% ▼ -23.00%
- Reading proficiency
- 38% ▼ -12.00%
- Median HH income
- $83,240
- Composite
- 29.74/100
- National rank
- #6444
- State rank
- #8 of 24 in MD
Livability — Wildewood
No livability data for this city. (Only ~50 U.S. cities are tracked.)
Census & demographics
- Census place
- Wildewood, MD
- County
- Saint Marys County · 48,152 people
- Metro
- California-Lexington Park, MD
- Population (ZIP)
- 14,212
- Household income
- $119,432
- Rent vs Own
- Severe rent burden
- 357.0
Population outlook (St. Mary's County) Hauer SSP2
- Today (2025)
- 123,125 people
- By 2030
- 128,374 · +4.3%
- By 2040
- 137,305 · +11.5%
- By 2050
- 143,065 · +16.2%
- By 2075
- 153,408 · +24.6%
- By 2100
- 151,790 · +23.3%
Race, ethnicity, and origin ACS 2023
- Neighborhood character
- Predominantly White (68%)
- Race & ethnicity
- White 68% Black 13% Hispanic / Latino 10% Two or more races 6% Asian 5%
- Hispanic origin (detail)
- Mexican 5%
- Common ancestry
- Slovak 3% Iranian 3% Italian 3%
- Foreign-born
- 7% · Canada, Jamaica, Vietnam
- Languages at home
- 90% English-only · Spanish 5% Chinese 1% Tagalog/Filipino 1%
Political lean MEDSL · St. Mary's
- 2024 margin
- R (+17.2) · D 40.2% · R 57.4% · Other 2.4%
- 2008→2024 swing
- -4.4pp toward R · 2008: -12.8pp · 2024: -17.2pp
- All cycles
- 2024: R+17.2 2020: R+13.8 2016: R+24.6 2012: R+16.1 2008: R+12.8
Not yet ingested
- Civics
- —
Market trends
- HPI YoY
- ▲ 2.30%
- Current HPI
- 239.4326
- Rent YoY
- ▲ 6.73%
- Metro
- California-Lexington Park, MD
- State GDP YoY
- ▲ 2.97%
- F500 in state
- 12
Industry mix (Fortune 500 HQ in MD)
| Industry | F500 HQs | Revenue |
|---|---|---|
| Aerospace / Defense | 1 | $71B |
|
||
| Utilities | 1 | $25B |
|
||
| Hotels | 1 | $24B |
|
||
| Consumer Goods | 1 | $7B |
|
||
| Real Estate | 1 | $6B |
|
||
| Chemicals | 1 | $2B |
|
||
Price history
2 events — show timeline
- 2026-05-08 Contingent — BRIGHT MLS
- 2026-05-03 Listed $220,000 BRIGHT MLS
Cash-flow waterfall
monthlySold comps — $/sqft
last 12 mo · ≤1 miLoading sold comps…