 Duplex
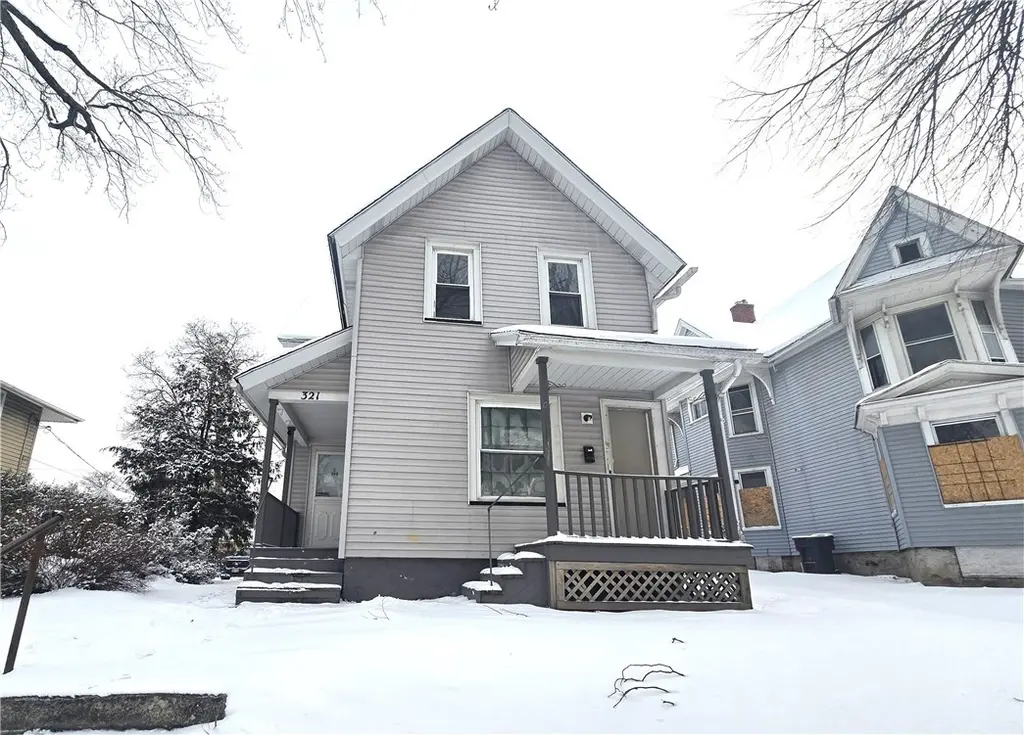
321 Ravine Ave · Rochester, NY
Flood risk 1/10 · Minimal
- FEMA flood zone
- X (unshaded)
- Chance of flooding over 30 yrs
- 0.0%
- Est. flood insurance / yr
- $473 – $860
Fire risk 1/10 · Minimal
- Est. fire insurance / yr
- $691 – $1,283
Heat risk 2/10 · Minimal
- Hot days now (above 95°F)
- 7 days/yr
- Hot days in 30 yrs
- 14 days/yr
Wind risk 1/10 · Minimal
- Chance of severe wind over 30 yrs
- —
Air-quality risk 2/10 · Minimal
- Unhealthy air days now
- 1 days/yr
- Unhealthy air days in 30 yrs
- 2 days/yr
Risk factors via First Street. Map © Google.
Why this score? — see what drove the B+ grade
The composite is a weighted blend of 9 inputs, each scored 0–100. Each bar is that input's sub-score; the figure is the points it added to the 100-point composite (weight × sub-score).
- Cash flow +30.0/30.0
- ARV discount +15.0/15.0
- 1% rule +10.0/10.0
- DSCR +10.0/10.0
- Livability +3.8/5.0
- Rent growth +2.5/5.0
- Condition / age +2.5/5.0
- Appreciation +2.2/10.0
- Schools +1.9/10.0
$89,900
🖨 Deal sheet 📄 Offer letter ✓ Due diligence
Multi-family units
County records classify this as Multi-Family (2-4 Unit). Listing-text estimate: 2 units. confirmed
Listing remarks MLS
Welcome to 321 Ravine Ave. This duplex has vinyl siding, current C of O, some newer windows, newer vinyl flooring, laundry in basement, large driveway with backyard and upper unit vacant. Current rent is $995, downstairs tenants have been there approximately 4 years. C of O expires 11/2027. Great investment opportunity. Group showings Sat 02/07/2026 at 11am and Monday 02/09 at 1:30pm. Due to weather group showing on Saturday at 11am is cancelled.
Key facts
- Large driveway
- Laundry in basement
- Backyard
Tags
Neighborhood map
What this means for you Summary
Snapshot
- This is a 2 × 2-bed/1.0-bath units multifamily listed at $90k.
Deal economics
- At list price, monthly cash flow is $1k ($16k/yr) — positive. Per door: $669/mo.
- The deal already cash-flows at list — no discount required.
- Meets the 1% rule at list price ($2k rent vs $90k).
- Recommended offer: $79k (12.0% below list) — sets the bar for market timing.
- Cap rate 24.1% vs local median 9.3% in Rochester — top-decile yield for the area; either an underpriced asset or a hidden risk that comps aren't pricing in. Stress-test before assuming the spread holds.
Location & tenants
- Location reads 76/100 on livability (#222 in NY, #3,482 nationally) — a middle-class / working-renter tenant base. Strengths: commute A+, cost of living A+, housing A+; Watch: schools D+, crime F, employment F.
- Rochester City School District (urban): math 21% / reading 26% proficiency, ranked #589 of 590 in NY (top 100%) — low school quality limits family demand, transient renter base, plan for 1-2y turnover; 82% free/reduced lunch — lower-income household profile, screen leases tightly.
- Market conditions: 71 active listings in the ZIP; 12 comparable units currently listed for rent nearby; rentals at typical pace (median 22d on market — plan ~3-4 weeks tenant-placement turnaround); 1,169 units permitted in Monroe County in 2024 (591 in 5+ unit buildings).
Forward outlook
- Local home prices are declining (-3.0%/yr); year-one equity from $622 of loan paydown is wiped out by about $3k of value loss. Plan a longer hold.
- Monroe County population projected to shrink 6% by 2050 — rents likely to lag national; underwrite the cash flow, not the appreciation.
- At projected returns (-3.0% appreciation + 3.0% rent growth), your $25k cash investment doubles in ~2 years — after that, you're playing with house money.
Negotiation context
- It's been on market 132 days — a 12% lower offer ($79k) is reasonable based on typical stale-listing flexibility.
- 4 sale attempts since 5y ago with the ask held roughly flat each time — persistent listings suggest the price (not the market) is what's stuck; bring a comps-based counter.
Risks & watch-outs
- Watch-outs: built in 1900 — expect roof / HVAC / electrical / plumbing capex.
Questions for the listing agent
- It's been on market 132 days. Have you received any prior offers? Is the seller open to a 12% concession, seller financing, or rate buy-down credit?
- Can we see the unit-by-unit rent roll, current vacancy, and any below-market leases? What's the average tenancy length?
- What capital expenditures (roof, boiler, parking lot, exteriors) have been made in the last 5 years, and what's planned in the next 2?
- Built in 1900 — when were the roof, HVAC, electrical panel, plumbing, and water heater last replaced?
- Why hasn't it sold? Are there any deal-killer items the seller is aware of (foundation, flood, title, zoning, code violations)?
- Is there a deadline driving the sale (1031 exchange, divorce, estate, relocation)? That informs how much negotiation room exists.
- Schools are D-rated, which usually means shorter tenancies and higher turnover. Who's the typical renter profile here, and what's been the actual vacancy rate?
- Crime grade is F in this area — have there been break-ins, vandalism, or insurance claims at this property in the last 3 years? What carrier currently insures it and at what premium?
- What's the average days-on-market for RENTAL listings here right now (not sales)? A rising rental-DOM trend means longer vacancies and softer asking-rent achievability than the comps imply.
- What's the recent tenant-quality profile in this submarket — average credit score on applications, eviction rate, late-payment / NSF rate, and stable-employment percentage? A property-management company in the area should have these aggregated.
- How much new apartment / multifamily construction is in the pipeline within 1–3 miles? Heavy new supply (>2% of stock underway) typically softens rents 12–24 months out; light construction supports rent growth.
Investment metrics
- 1% rule
- 2.70% ✓
- Cap rate
- 24.15%
- Cash-on-cash
- 63.77%
- DSCR
- 3.84
- GRM
- 3.1
CMA / ARV
- ARV (median comp)
- $143,672
- List price
- $89,900
- Delta
- -37.43%
- Verdict
- UNDERPRICED
- Comps
- 20 within 1.0 mi
Show comp detail 12 sales within ~0.75 mi
| Address | Dist | Beds/Ba | Sqft | Sold | Price | $/sf | Match |
|---|---|---|---|---|---|---|---|
| 304 Ravine Ave | 0.04mi | 3/2.0 (-1) | 1,812 (-1%) | 7mo | $35,000 | $19 | 86 |
| 31 Plover St | 0.21mi | 4/2.0 | 1,776 (-3%) | 6mo | $123,000 | $69 | 81 |
| 254 Lexington Ave | 0.32mi | 5/2.0 (+1) | 1,845 (+1%) | 0mo | $135,000 | $73 | 78 |
| 40 Finch St | 0.23mi | 3/2.0 (-1) | 1,826 (-0%) | 9mo | $91,000 | $50 | 76 |
| 191 Emerson St | 0.20mi | 5/2.0 (+1) | 1,808 (-1%) | 9mo | $45,000 | $25 | 76 |
| 315 Lexington Ave | 0.29mi | 3/2.0 (-1) | 1,754 (-4%) | 1mo | $107,000 | $61 | 74 |
| 475 Sherman St | 0.16mi | 4/2.0 | 2,016 (+10%) | 5mo | $150,000 | $74 | 71 |
| 41 Pierpont St | 0.37mi | 3/2.0 (-1) | 1,778 (-3%) | 2mo | $17,000 | $10 | 71 |
| 35 Curtis St | 0.21mi | 4/2.0 | 1,614 (-12%) | 1mo | $65,000 | $40 | 70 |
| 152 Driving Park Ave | 0.47mi | 5/2.0 (+1) | 1,688 (-8%) | 0mo | $105,000 | $62 | 60 |
| 203 Emerson St | 0.18mi | 5/2.0 (+1) | 1,577 (-14%) | 8mo | $62,000 | $39 | 57 |
| 201 Parkway | 0.51mi | 4/3.0 | 1,602 (-12%) | 2mo | $85,000 | $53 | 49 |
Match score weights: distance 35% · size 25% · config 20% · recency 20%. Top-matched comps best support the ARV.
Projected returns pro-forma
-3.0% appreciation · 3.0% rent growth · sell at horizon
- IRR
- 62.8%
- Equity multiple
- 3.81×
- Total profit
- $70,641
- Equity at exit
- $13,404
- IRR
- 67.3%
- Equity multiple
- 7.80×
- Total profit
- $171,267
- Equity at exit
- $7,773
Cash invested: $25,172 (down + closing). Projections, not guarantees.
Landlord ↔ Tenant lean methodology
- Overall (STATE)
- 15 Strongly Tenant-Friendly
- State New York
- 15 Strongly Tenant-Friendly · D+10
- County
- — inherits STATE
- City
- — inherits STATE
ZIP-level market 14613
- Home prices YoY
- -2.0%
- Active inventory
- 71
- Price-to-rent
- 6.2×
Monthly cashflow live
- Estimated rent
- $2,430 high interval (Pro) →
- Mortgage (P&I)
- −$471
- Tax from tax record
- −$73 /mo · $878/yr
- Insurance
- −$37
- HOA
- −$0
- Vacancy / Maint / Mgmt
- −$510
- Net cashflow
- $1,338
Break-even live
2-unit breakdown (identical units grouped — click to expand)
| Units | Beds | Baths | Est. rent |
|---|---|---|---|
| 2× units | 2 | 1 | $2,430 |
| #1 | 2 | 1 | $1,215 |
| #2 | 2 | 1 | $1,215 |
| Total (2 units) | $2,430 | ||
UW: 25.0% down · 7.5% · 30yr · 1.5% tax · 5.0% vac · 8.0% maint · 8.0% mgmt
Financing live
Cash to close
- Down payment
- $22,475
- Closing costs
- $2,697
- Reserves months
- —
- Total cash needed
- —
Loan-product check · same deal, 3 products live
Conventional
25% down · 7.5% · 30yr
- Down + closing
- —
- Monthly P&I
- —
- Monthly cashflow
- —
- DSCR
- —
- Eligible?
- —
Personal DTI + credit; lowest rate.
DSCR
20% down · 8.5% · 30yr
- Down + closing
- —
- Monthly P&I
- —
- Monthly cashflow
- —
- DSCR
- —
- Eligible?
- —
No personal income docs; deal must DSCR.
Hard money
10% down · 12.0% · 12mo
- Down + closing
- —
- Monthly P&I
- —
- Monthly cashflow
- —
- DSCR
- —
- Eligible?
- —
Short-term bridge; refi at stabilization.
Rent comps 12 comps
| Address | Beds | Baths | Sqft | Rent | $/sqft | DOM | Units | Dist |
|---|---|---|---|---|---|---|---|---|
| 327 Glenwood Ave Rochester, NY | 3.0 | 1.0 | 2012 | $1,690 | $0.84 | 3d | 1 | 0.11mi |
| 98 Pierpont St Rochester, NY | 3.0 | 1.0 | 1973 | $1,295 | $0.66 | 44d | 1 | 0.44mi |
| 28-30 Carthage Dr Unit 28 Rochester, NY | 3.0 | 1.0 | 1415 | $1,600 | $1.13 | 23d | 1 | 0.66mi |
| 1016 Lake Ave Unit 1 Rochester, NY | 3.0 | 1.0 | 1300 | $1,600 | $1.23 | 44d | 1 | 0.72mi |
| 649 Jay St Rochester, NY | 5.0 | 2.0 | 2144 | $2,000 | $0.93 | 3d | 1 | 1.09mi |
| 287 Electric Ave Rochester, NY | 3.0 | 1.5 | 1297 | $1,500 | $1.16 | 2d | 1 | 1.10mi |
| 2 Jay St Unit 2 Rochester, NY | 3.0 | 1.0 | 1252 | $1,045 | $0.83 | 44d | 1 | 1.16mi |
| 385 Ames St Rochester, NY | 3.0 | 1.5 | 1738 | $1,500 | $0.86 | 21d | 1 | 1.21mi |
| 235 Flower City Park Rochester, NY | 3.0 | 1.0 | 2000 | $1,360 | $0.68 | 44d | 1 | 1.25mi |
| 248 Flower City Park Rochester, NY | 3.0 | 1.0 | 1350 | $1,800 | $1.33 | 3d | 1 | 1.29mi |
| 768 Flower City Park Rochester, NY | 3.0 | 1.0 | 1995 | $1,995 | $1.00 | 10d | 1 | 1.31mi |
| 108 Wetmore Park Rochester, NY | 3.0 | 2.0 | 1278 | $1,900 | $1.49 | 10d | 1 | 1.32mi |
Listing history 30 events
-
2026-06-18days on market $89,900 Active 132 DOM
-
2026-06-17days on market $89,900 Active 131 DOM
-
2026-06-16days on market $89,900 Active 130 DOM
-
2026-06-15days on market $89,900 Active 129 DOM
-
2026-06-13days on market $89,900 Active 127 DOM
-
2026-06-13days on market $89,900 Active 126 DOM
-
2026-06-10days on market $89,900 Active 124 DOM
-
2026-06-09days on market $89,900 Active 123 DOM
-
2026-06-09days on market $89,900 Active 122 DOM
-
2026-06-07days on market $89,900 Active 121 DOM
-
2026-06-05days on market $89,900 Active 118 DOM
-
2026-06-03days on market $89,900 Active 117 DOM
-
2026-06-03days on market $89,900 Active 116 DOM
-
2026-06-01days on market $89,900 Active 115 DOM
-
2026-05-31days on market $89,900 Active 114 DOM
-
2026-02-06$89,900 Active 450-char remark
Show marketing remark (450 chars)
Welcome to 321 Ravine Ave. This duplex has vinyl siding, current C of O, some newer windows, newer vinyl flooring, laundry in basement, large driveway with backyard and upper unit vacant. Current rent is $995, downstairs tenants have been there approximately 4 years. C of O expires 11/2027. Great investment opportunity. Group showings Sat 02/07/2026 at 11am and Monday 02/09 at 1:30pm. Due to weather group showing on Saturday at 11am is cancelled.
-
2025-02-04soldstatus $95,000
-
2025-02-03soldstatus $95,000 Closed 253-char remark
Show marketing remark (253 chars)
BACK ON THE MARKET, DEAL FELL THROUGH!! DONT LET THEIR LOSS BE YOUR LOSS TOO!!! GREAT INVESTMENT OPPORTUNITY! Both units are currently occupied so please give 48 hours notice when requesting showings. Monthly rent total = $1945. Valid c of o until 2027
-
2024-12-10status Pending 253-char remark
Show marketing remark (253 chars)
BACK ON THE MARKET, DEAL FELL THROUGH!! DONT LET THEIR LOSS BE YOUR LOSS TOO!!! GREAT INVESTMENT OPPORTUNITY! Both units are currently occupied so please give 48 hours notice when requesting showings. Monthly rent total = $1945. Valid c of o until 2027
-
2024-10-30status Active 253-char remark
Show marketing remark (253 chars)
BACK ON THE MARKET, DEAL FELL THROUGH!! DONT LET THEIR LOSS BE YOUR LOSS TOO!!! GREAT INVESTMENT OPPORTUNITY! Both units are currently occupied so please give 48 hours notice when requesting showings. Monthly rent total = $1945. Valid c of o until 2027
-
2024-10-18status Pending 253-char remark
Show marketing remark (253 chars)
BACK ON THE MARKET, DEAL FELL THROUGH!! DONT LET THEIR LOSS BE YOUR LOSS TOO!!! GREAT INVESTMENT OPPORTUNITY! Both units are currently occupied so please give 48 hours notice when requesting showings. Monthly rent total = $1945. Valid c of o until 2027
-
2024-09-24$99,999 Active 253-char remark
Show marketing remark (253 chars)
BACK ON THE MARKET, DEAL FELL THROUGH!! DONT LET THEIR LOSS BE YOUR LOSS TOO!!! GREAT INVESTMENT OPPORTUNITY! Both units are currently occupied so please give 48 hours notice when requesting showings. Monthly rent total = $1945. Valid c of o until 2027
-
2021-11-04soldstatus $69,900
-
2021-11-01soldstatus $69,900 Closed Sale or Rented
-
2021-08-27status Pending Sale
-
2021-08-21historical Continue to Show- Under Contract
-
2021-08-17$69,900 Active
-
2008-06-02soldstatus $45,000
-
2008-01-17soldstatus $18,000
-
2008-01-07soldstatus $11,500
ⓘ Source: listings_history table (triggers on properties + properties_extension) + one-shot
backfill from property_details.listing_events for pre-trigger history.
Tax reassessment forecast NY · Partial reset (capped growth)
- Current annual tax
- $878 · $73/mo
- Projected year-2 tax
- $1,199 · $100/mo
- Expected delta
- +$321/yr (+$27/mo · 36.6%)
ⓘ Screening estimate from a state-policy table — verify with the county assessor before closing.
Climate risk First Street
- Flood 1/10 Low FEMA zone X (unshaded) · 0% chance over 30 yrs
- Wildfire 1/10 Low
- Heat 2/10 Low 7 d/yr ≥95°F today · 14 d/yr by 30 yrs out
- Wind 1/10 Low
- Air quality 2/10 Low 1 unhealthy d/yr today · 2 by 30 yrs out
Nearby sold comps map
Loading sold comps map…
Walkable amenities ~0.75 mi
Loading nearby amenities…
Taxation est. · year 1
- Rental income
- $29,160
- − Mortgage interest
- −$5,036
- − Property taxes
- −$878
- − Insurance
- −$450
- − Repairs & maintenance
- −$2,333
- − Management
- −$2,333
- − Depreciation
- −$2,615
- Taxable income
- $15,516
- Est. tax owed @ 24.0%
- −$3,724
- After-tax cash flow
- $12,328/yr
For passive investors: Depreciation is non-cash, so a rental often shows a tax loss while cash-flowing — sheltering income. Rental losses are passive: they offset passive income freely, and up to $25,000/yr can offset ordinary (W-2) income if you actively participate and your MAGI is under $100k (phasing out to $0 by $150k); unused losses carry forward. On sale, claimed depreciation is recaptured at up to 25%, and gains may owe capital-gains tax (a 1031 exchange can defer both). Figures are a year-1 estimate at your 24.0% rate — not tax advice; consult a CPA.
Schools (NCES district)
- District
- Rochester City School District
- NCES district ID
- 3624750
- Math proficiency
- 21% ▬ 0.00%
- Reading proficiency
- 26% ▲ 4.00%
- Median HH income
- $30,923
- Composite
- 18.98/100
- National rank
- #8850
- State rank
- #589 of 590 in NY
Livability — Rochester
- Score
- 76/100
- State rank
- #222
- US rank
- #3482
Category grades
Schools grade is shown separately in the Schools card above.
Census & demographics
- Census place
- Rochester, NY
- City population
- 432,803
- Population (ZIP)
- 14,740
Population outlook (Monroe County) Hauer SSP2
- Today (2025)
- 759,460 people
- By 2030
- 757,154 · -0.3%
- By 2040
- 740,644 · -2.5%
- By 2050
- 714,443 · -5.9%
- By 2075
- 645,883 · -15.0%
- By 2100
- 547,084 · -28.0%
Race, ethnicity, and origin ACS 2023
- Neighborhood character
- Highly diverse neighborhood (Simpson 0.70)
- Race & ethnicity
- Black 45% White 22% Hispanic / Latino 20% Two or more races 10% Asian 8% Pacific Islander 1%
- Hispanic origin (detail)
- Puerto Rican 16% Dominican 3%
- Common ancestry
- British 2% Serbian 1% Romanian 1%
- Foreign-born
- 13% · Canada, India, Philippines
- Languages at home
- 79% English-only · Spanish 12% Other Asian/Pacific 5% Other Indo-European 3%
Political lean MEDSL · Monroe
- 2024 margin
- D (+19.1) · D 59.5% · R 40.5%
- 2008→2024 swing
- +1.4pp toward D · 2008: 17.7pp · 2024: 19.1pp
- All cycles
- 2024: D+19.1 2020: D+21.0 2016: D+14.1 2012: D+17.4 2008: D+17.7
Not yet ingested
- Civics
- —
Market trends
- HPI YoY
- ▼ -5.56%
- Current HPI
- 274.2485
- Rent YoY
- —
- Metro
- —
- State GDP YoY
- ▲ 2.60%
- F500 in state
- 92
Industry mix (Fortune 500 HQ in NY)
| Industry | F500 HQs | Revenue |
|---|---|---|
| Financial Services | 10 | $950B |
|
||
| Consumer Goods | 9 | $162B |
|
||
| Insurance | 4 | $225B |
|
||
| Telecommunications | 2 | $144B |
|
||
| Pharmaceuticals | 2 | $112B |
|
||
| Media / Entertainment | 2 | $69B |
|
||
Price history
+681.7% since first listed15 events — show timeline
- 2026-02-06 Listed $89,900 UNYREIS
- 2025-02-04 Sold (Public Records) $95,000 Public Records
- 2025-02-03 Sold (MLS) $95,000 UNYREIS
- 2024-12-10 Pending — UNYREIS
- 2024-10-30 Relisted — UNYREIS
- 2024-10-18 Pending — UNYREIS
- 2024-09-24 Listed $99,999 UNYREIS
- 2021-11-04 Sold (Public Records) $69,900 Public Records
- 2021-11-01 Sold (MLS) $69,900 UNYREIS
- 2021-08-27 Pending — UNYREIS
- 2021-08-21 Contingent — UNYREIS
- 2021-08-17 Listed $69,900 UNYREIS
- 2008-06-02 Sold (Public Records) $45,000 Public Records
- 2008-01-17 Sold (Public Records) $18,000 Public Records
- 2008-01-07 Sold (Public Records) $11,500 Public Records
Property tax history
+2.5%/yrLatest (2025): $878 · +0.0% YoY. Source: county tax records.
Cash-flow waterfall
monthlySold comps — $/sqft
last 12 mo · ≤1 miLoading sold comps…