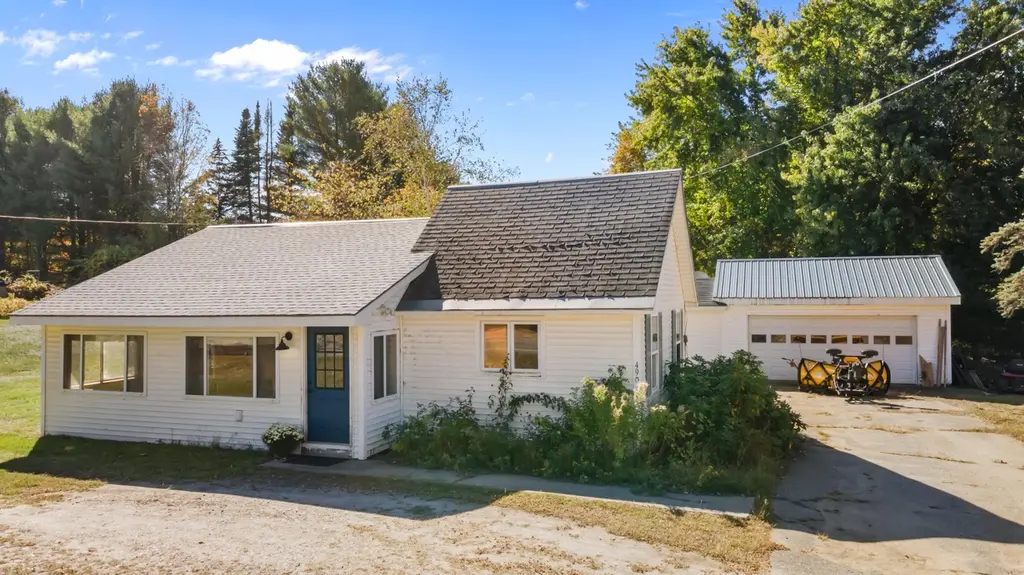
490 Fairbanks Rd · Farmington, ME
Flood risk 1/10 · Minimal
- FEMA flood zone
- X
- Chance of flooding over 30 yrs
- 0.0%
- Est. flood insurance / yr
- $473 – $860
Fire risk 1/10 · Minimal
- Est. fire insurance / yr
- $669 – $1,243
Heat risk 2/10 · Minimal
- Hot days now (above 89°F)
- 7 days/yr
- Hot days in 30 yrs
- 16 days/yr
Wind risk 4/10 · Minor
- Chance of severe wind over 30 yrs
- 9.0%
Air-quality risk 2/10 · Minimal
- Unhealthy air days now
- 0 days/yr
- Unhealthy air days in 30 yrs
- 1 days/yr
Risk factors via First Street. Map © Google.
Why this score? — see what drove the C grade
The composite is a weighted blend of 9 inputs, each scored 0–100. Each bar is that input's sub-score; the figure is the points it added to the 100-point composite (weight × sub-score).
- Cash flow +14.6/30.0
- ARV discount +10.1/15.0
- Appreciation +10.0/10.0
- Schools +6.7/10.0
- DSCR +4.5/10.0
- Livability +4.0/5.0
- 1% rule +3.3/10.0
- Rent growth +2.5/5.0
- Condition / age +2.5/5.0
$224,000
🖨 Deal sheet 📄 Offer letter ✓ Due diligence
Listing remarks MLS
Affordable, easy living in a prime Farmington location. Just 5 minutes to downtown and UMF, this well-maintained ranch offers true one-floor living with a simple, efficient layout that's easy to own and maintain. Enjoy a bright breezeway connecting to a two-car garage--perfect for Maine seasons--and a fully fenced backyard ideal for pets, gardening, or relaxing in privacy. Outdoor lovers will appreciate quick access to the Sandy River, Titcomb Mountain, and major ski areas like Sugarloaf and Saddleback--all under an hour away--while still being close to shopping, dining, and everyday essentials. With solid bones, low-maintenance living, and room to add your personal touch, this is a smart move for first-time buyers, downsizers, or anyone ready to stop renting and start building equity. Motivated seller--don't miss this opportunity at an increasingly hard-to-find price point.
Key facts
- One-floor living
- 0.49 acre lot
- 2 garage spots
Tags
Neighborhood map
What this means for you Summary
Snapshot
- This is a 2-bed/1.0-bath single-family listed at $224k.
Deal economics
- At list price, monthly cash flow is $55 ($655/yr) — positive.
- The deal already cash-flows at list — no discount required.
- To meet the 1% rule (rent ≥ 1% of price), the offer needs to be $185k (17.3% below list).
- Recommended offer: $185k (17.3% below list) — sets the bar for 1% rule.
- Cap rate 6.6% vs local median 4.8% in Farmington — top-decile yield for the area; either an underpriced asset or a hidden risk that comps aren't pricing in. Stress-test before assuming the spread holds.
Location & tenants
- Location reads 80/100 on livability (#18 in ME, #1,653 nationally) — a professional / high-income tenant draw. Strengths: cost of living A+, health & safety A+, crime A-; Watch: schools D, employment D-.
- RSU 09 (rural): math 78% / reading 82% proficiency, ranked #88 of 112 in ME (top 79%) — strong family-tenant draw, lease renewals of 3-5y typical.
- Market conditions: 90 active listings in the ZIP; 164 units permitted in Franklin County in 2024 (0 in 5+ unit buildings).
Forward outlook
- In year one you build about $24k of equity ($2k loan paydown + $22k appreciation (10.0% local appreciation)).
- Franklin County population projected at -21% by 2050 — secular population decline; favor cash flow + early exit over multi-decade hold.
- At projected returns (10.0% appreciation + 3.0% rent growth), your $63k cash investment doubles in ~3 years — after that, you're playing with house money.
- By year 2, paydown + projected appreciation supports a ~$38k cash-out refi (75% LTV) — recoverable capital for the next deal without selling this one.
Negotiation context
- It's been on market 65 days — a 6% lower offer ($211k) is reasonable based on typical stale-listing flexibility.
- 2 sale attempts since 9y ago with the ask held roughly flat each time — persistent listings suggest the price (not the market) is what's stuck; bring a comps-based counter.
- Current owner paid $100k; list at $224k implies a 125% gain — meaningful room to come down on a strong offer.
Risks & watch-outs
- Watch-outs: built in 1950 — expect roof / HVAC / electrical / plumbing capex.
Questions for the listing agent
- It's been on market 65 days. Have you received any prior offers? Is the seller open to a 17% concession, seller financing, or rate buy-down credit?
- Built in 1950 — when were the roof, HVAC, electrical panel, plumbing, and water heater last replaced?
- Why hasn't it sold? Are there any deal-killer items the seller is aware of (foundation, flood, title, zoning, code violations)?
- Is there a deadline driving the sale (1031 exchange, divorce, estate, relocation)? That informs how much negotiation room exists.
- Schools are D-rated, which usually means shorter tenancies and higher turnover. Who's the typical renter profile here, and what's been the actual vacancy rate?
- What's the average days-on-market for RENTAL listings here right now (not sales)? A rising rental-DOM trend means longer vacancies and softer asking-rent achievability than the comps imply.
- What's the recent tenant-quality profile in this submarket — average credit score on applications, eviction rate, late-payment / NSF rate, and stable-employment percentage? A property-management company in the area should have these aggregated.
- How much new for-sale + rental construction is in the pipeline within 1–3 miles? Heavy new supply typically softens prices + rents 12–24 months out; constrained supply supports both.
Investment metrics
- 1% rule
- 0.83% ✗
- Cap rate
- 6.59%
- Cash-on-cash
- 1.05%
- DSCR
- 1.05
- GRM
- 10.1
CMA / ARV
- ARV (median comp)
- $237,752
- List price
- $224,000
- Delta
- -5.78%
- Verdict
- FAIR
- Comps
- 12 within 1.0 mi
Show comp detail 2 sales within ~0.75 mi
| Address | Dist | Beds/Ba | Sqft | Sold | Price | $/sf | Match |
|---|---|---|---|---|---|---|---|
| 505 Fairbanks Rd | 0.08mi | 3/1.5 (+1) | 1,475 (+5%) | 5mo | $275,000 | $186 | 77 |
| 420 Fairbanks Rd | 0.33mi | 3/1.0 (+1) | 1,248 (-11%) | 21mo | $175,800 | $141 | 43 |
Match score weights: distance 35% · size 25% · config 20% · recency 20%. Top-matched comps best support the ARV.
Projected returns pro-forma
10.0% appreciation · 3.0% rent growth · sell at horizon
- IRR
- 25.0%
- Equity multiple
- 3.00×
- Total profit
- $125,418
- Equity at exit
- $201,797
- IRR
- 22.1%
- Equity multiple
- 6.84×
- Total profit
- $366,485
- Equity at exit
- $435,183
Cash invested: $62,720 (down + closing). Projections, not guarantees.
Landlord ↔ Tenant lean methodology
- Overall (STATE)
- 41 Moderately Tenant-Leaning
- State Maine
- 41 Moderately Tenant-Leaning · D+2
- County
- — inherits STATE
- City
- — inherits STATE
ZIP-level market 04938
- Home prices YoY
- 6.4%
- Active inventory
- 90
- Price-to-rent
- 10.1×
Monthly cashflow live
- Estimated rent
- $1,853 medium interval (Pro) →
- Mortgage (P&I)
- −$1,175
- Tax from tax record
- −$141 /mo · $1,693/yr
- Insurance
- −$93
- HOA
- −$0
- Vacancy / Maint / Mgmt
- −$389
- Net cashflow
- $55
Break-even live
UW: 25.0% down · 7.5% · 30yr · 1.5% tax · 5.0% vac · 8.0% maint · 8.0% mgmt
Financing live
Cash to close
- Down payment
- $56,000
- Closing costs
- $6,720
- Reserves months
- —
- Total cash needed
- —
Loan-product check · same deal, 3 products live
Conventional
25% down · 7.5% · 30yr
- Down + closing
- —
- Monthly P&I
- —
- Monthly cashflow
- —
- DSCR
- —
- Eligible?
- —
Personal DTI + credit; lowest rate.
DSCR
20% down · 8.5% · 30yr
- Down + closing
- —
- Monthly P&I
- —
- Monthly cashflow
- —
- DSCR
- —
- Eligible?
- —
No personal income docs; deal must DSCR.
Hard money
10% down · 12.0% · 12mo
- Down + closing
- —
- Monthly P&I
- —
- Monthly cashflow
- —
- DSCR
- —
- Eligible?
- —
Short-term bridge; refi at stabilization.
Listing history 21 events
-
2026-06-18days on market $224,000 Active 65 DOM
-
2026-06-17days on market $224,000 Active 64 DOM
-
2026-06-16days on market $224,000 Active 63 DOM
-
2026-06-15days on market $224,000 Active 62 DOM
-
2026-06-13days on market $224,000 Active 60 DOM
-
2026-06-12days on market $224,000 Active 59 DOM
-
2026-06-09days on market $224,000 Active 56 DOM
-
2026-06-08days on market $224,000 Active 55 DOM
-
2026-06-07days on market $224,000 Active 54 DOM
-
2026-06-07days on market $224,000 Active 53 DOM
-
2026-06-04days on market $224,000 Active 50 DOM
-
2026-06-02days on market $224,000 Active 49 DOM
-
2026-06-01days on market $224,000 Active 48 DOM
-
2026-05-31days on market $224,000 Active 47 DOM
-
2026-05-31days on market $224,000 Active 46 DOM
-
2026-05-19price $224,000 887-char remark
Show marketing remark (887 chars)
Affordable, easy living in a prime Farmington location. Just 5 minutes to downtown and UMF, this well-maintained ranch offers true one-floor living with a simple, efficient layout that's easy to own and maintain. Enjoy a bright breezeway connecting to a two-car garage--perfect for Maine seasons--and a fully fenced backyard ideal for pets, gardening, or relaxing in privacy. Outdoor lovers will appreciate quick access to the Sandy River, Titcomb Mountain, and major ski areas like Sugarloaf and Saddleback--all under an hour away--while still being close to shopping, dining, and everyday essentials. With solid bones, low-maintenance living, and room to add your personal touch, this is a smart move for first-time buyers, downsizers, or anyone ready to stop renting and start building equity. Motivated seller--don't miss this opportunity at an increasingly hard-to-find price point.
-
2026-04-14$234,900 Active 887-char remark
Show marketing remark (887 chars)
Affordable, easy living in a prime Farmington location. Just 5 minutes to downtown and UMF, this well-maintained ranch offers true one-floor living with a simple, efficient layout that's easy to own and maintain. Enjoy a bright breezeway connecting to a two-car garage--perfect for Maine seasons--and a fully fenced backyard ideal for pets, gardening, or relaxing in privacy. Outdoor lovers will appreciate quick access to the Sandy River, Titcomb Mountain, and major ski areas like Sugarloaf and Saddleback--all under an hour away--while still being close to shopping, dining, and everyday essentials. With solid bones, low-maintenance living, and room to add your personal touch, this is a smart move for first-time buyers, downsizers, or anyone ready to stop renting and start building equity. Motivated seller--don't miss this opportunity at an increasingly hard-to-find price point.
-
2025-10-17price $239,900
-
2017-07-07soldstatus $99,500 Sold
-
2017-05-10status Pending
-
2017-05-02$103,000 Active
ⓘ Source: listings_history table (triggers on properties + properties_extension) + one-shot
backfill from property_details.listing_events for pre-trigger history.
Tax reassessment forecast ME · Partial reset (capped growth)
- Current annual tax
- $1,693 · $141/mo
- Projected year-2 tax
- $2,370 · $197/mo
- Expected delta
- +$677/yr (+$56/mo · 40.0%)
ⓘ Screening estimate from a state-policy table — verify with the county assessor before closing.
Climate risk First Street
- Flood 1/10 Low FEMA zone X · 0% chance over 30 yrs
- Wildfire 1/10 Low
- Heat 2/10 Low 7 d/yr ≥89°F today · 16 d/yr by 30 yrs out
- Wind 4/10 Moderate 9% chance of damaging wind over 30 yrs
- Air quality 2/10 Low 0 unhealthy d/yr today · 1 by 30 yrs out
Nearby sold comps map
Loading sold comps map…
Walkable amenities ~0.75 mi
Loading nearby amenities…
Taxation est. · year 1
- Rental income
- $22,234
- − Mortgage interest
- −$12,547
- − Property taxes
- −$1,693
- − Insurance
- −$1,120
- − Repairs & maintenance
- −$1,779
- − Management
- −$1,779
- − Depreciation
- −$6,516
- Taxable loss
- −$3,201
- Est. tax savings @ 24.0%
- +$768
- After-tax cash flow
- $1,424/yr
For passive investors: Depreciation is non-cash, so a rental often shows a tax loss while cash-flowing — sheltering income. Rental losses are passive: they offset passive income freely, and up to $25,000/yr can offset ordinary (W-2) income if you actively participate and your MAGI is under $100k (phasing out to $0 by $150k); unused losses carry forward. On sale, claimed depreciation is recaptured at up to 25%, and gains may owe capital-gains tax (a 1031 exchange can defer both). Figures are a year-1 estimate at your 24.0% rate — not tax advice; consult a CPA.
Schools (NCES district)
- District
- RSU 09
- NCES district ID
- 2314809
- Math proficiency
- 78% ▲ 48.00%
- Reading proficiency
- 82% ▲ 31.00%
- Median HH income
- $40,202
- Composite
- 66.71/100
- National rank
- #409
- State rank
- #88 of 112 in ME
Livability — Farmington
- Score
- 80/100
- State rank
- #18
- US rank
- #1653
Category grades
Schools grade is shown separately in the Schools card above.
Census & demographics
- Population (ZIP)
- 10,368
Population outlook (Franklin County) Hauer SSP2
- Today (2025)
- 28,948 people
- By 2030
- 27,889 · -3.7%
- By 2040
- 25,275 · -12.7%
- By 2050
- 22,770 · -21.3%
- By 2075
- 18,980 · -34.4%
- By 2100
- 16,816 · -41.9%
Race, ethnicity, and origin ACS 2023
- Neighborhood character
- Predominantly White (93%)
- Race & ethnicity
- White 93% Two or more races 4% Hispanic / Latino 2%
- Common ancestry
- Lithuanian 11% Italian 3% Slovak 2%
- Foreign-born
- 4% · Canada
- Languages at home
- 98% English-only · French/Haitian/Cajun 1%
Political lean MEDSL · Franklin
- 2024 margin
- Lean R (+8.2) · D 44.8% · R 53.0% · Other 2.2%
- 2008→2024 swing
- -28.5pp toward R · 2008: 20.3pp · 2024: -8.2pp
- All cycles
- 2024: R+8.2 2020: R+3.9 2016: R+5.5 2012: D+18.5 2008: D+20.3
Not yet ingested
- Civics
- —
Market trends
- HPI YoY
- ▲ 19.53%
- Current HPI
- 325.7666
- Rent YoY
- —
- Metro
- —
- State GDP YoY
- —
- F500 in state
- 0
Price history
+117.5% since first listed6 events — show timeline
- 2026-05-19 Price Changed $224,000 MREIS
- 2026-04-14 Listed $234,900 MREIS
- 2025-10-17 Price Changed $239,900 MREIS
- 2017-07-07 Sold (MLS) $99,500 MREIS
- 2017-05-10 Pending — MREIS
- 2017-05-02 Listed $103,000 MREIS
Property tax history
+3.3%/yrLatest (2025): $1,693 · +8.0% YoY. Source: county tax records.
Cash-flow waterfall
monthlySold comps — $/sqft
last 12 mo · ≤1 miLoading sold comps…