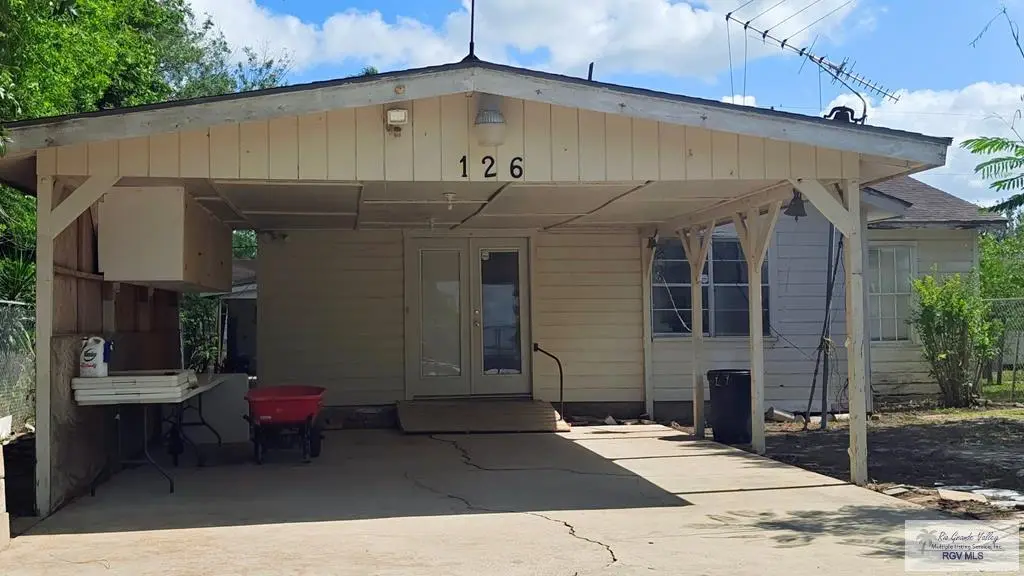
126 Ebony Ave #21 · Rio Hondo, TX
Flood risk 1/10 · Minimal
- FEMA flood zone
- X (unshaded)
- Chance of flooding over 30 yrs
- 0.0%
- Est. flood insurance / yr
- $507 – $1,088
Fire risk 1/10 · Minimal
- Est. fire insurance / yr
- $1,222 – $2,270
Heat risk 10/10 · Severe
- Hot days now (above 110°F)
- 7 days/yr
- Hot days in 30 yrs
- 26 days/yr
Wind risk 9/10 · Severe
- Chance of severe wind over 30 yrs
- 99.0%
Air-quality risk 1/10 · Minimal
- Unhealthy air days now
- 0 days/yr
- Unhealthy air days in 30 yrs
- 0 days/yr
Risk factors via First Street. Map © Google.
Why this score? — see what drove the C+ grade
The composite is a weighted blend of 9 inputs, each scored 0–100. Each bar is that input's sub-score; the figure is the points it added to the 100-point composite (weight × sub-score).
- Cash flow +18.3/30.0
- ARV discount +15.0/15.0
- Appreciation +8.3/10.0
- DSCR +5.7/10.0
- 1% rule +4.9/10.0
- Livability +3.6/5.0
- Rent growth +2.5/5.0
- Condition / age +2.2/5.0
- Schools +1.8/10.0
$145,000
🖨 Deal sheet (PDF) 📄 Offer letter ✓ Due diligence
Listing remarks
Welcome to 126 Ebony Avenue in Rio Hondo! This 4-bedroom, 1-bath home offers a spacious fenced backyard, detached garage with alley access and automatic roll-up door, plus a large covered carport with room for two vehicles or a boat. The detached garage also includes plumbing and potential for a workshop or extra storage. Conveniently located across from walking trails and close to Mary's Cafe, shopping, and dining. A great opportunity in a desirable location!
Key facts
- 7,500 sq ft lot
- Garage
- Built 1963
Property features AI
Exterior
- Parking: Detached 1-car garage
- Utilities: Public water and sewer (standard services)
- Home design: Single-family residence; One story
- Construction: Wood siding construction
- Exterior features: Located in the Rio Hondo original townsite subdivision
Interior
- Flooring: Carpet
- Bathrooms: 1 full bathroom
- Heating & cooling: Central heating; Central air conditioning
- Interior features: Electric water heater
Neighborhood map
What this means for you Summary
Snapshot
- This is a 4-bed/1.0-bath single-family listed at $145k. Condition is rated fair.
Deal economics
- At list price, monthly cash flow is $132 ($2k/yr) — positive.
- The deal already cash-flows at list — no discount required.
- To meet the 1% rule (rent ≥ 1% of price), the offer needs to be $144k (1.0% below list).
- Recommended offer: $141k (3.0% below list) — sets the bar for market timing.
Location & tenants
- Location reads 71/100 on livability (#305 in TX) — a middle-class / working-renter tenant base. Strengths: cost of living A+, housing A+, health & safety A+; Watch: crime C-, amenities F, commute F.
- Rio Hondo ISD (town): math 15% / reading 28% proficiency, ranked #769 of 826 in TX (top 93%) — low school quality limits family demand, transient renter base, plan for 1-2y turnover.
- Zoned schools: Rio Hondo El (math 12% / reading 17%, grade F, #4,048 of 4,322 statewide, top 95%, 624 students, 86% FRL); Rio Hondo Middle (math 14% / reading 29%, grade F, #1,378 of 1,662 statewide, top 83%, 488 students, 91% FRL); Rio Hondo H S (math 22% / reading 42%, grade F, #1,044 of 1,632 statewide, top 66%, 507 students, 83% FRL) — zoned schools average 87% FRL vs 23% district-wide (64 pts higher); higher-poverty schools than district average — tighter screening recommended.
- Market conditions: 98 active listings in the ZIP; 2,326 units permitted in Cameron County in 2024 (503 in 5+ unit buildings).
Forward outlook
- In year one you build about $11k of equity ($1k loan paydown + $10k appreciation (6.6% local appreciation)).
- Cameron County population projected at +3% by 2050 — modest demand growth; plan on rents tracking national, not racing it.
- At projected returns (6.6% appreciation + 3.0% rent growth), your $41k cash investment doubles in ~4 years — after that, you're playing with house money.
- By year 4, paydown + projected appreciation supports a ~$36k cash-out refi (75% LTV) — recoverable capital for the next deal without selling this one.
Negotiation context
- It's been on market 35 days — a 3% lower offer ($141k) is reasonable based on typical stale-listing flexibility.
Risks & watch-outs
- Climate carrying-cost: severe wind risk, 99% chance of damaging wind over 30y; extreme-heat days projected 7→26/yr by 2055 (HVAC capex compounding) — expect insurance premiums to compound above CPI over the hold.
Questions for the listing agent
- It's been on market 35 days. Have you received any prior offers? Is the seller open to a 3% concession, seller financing, or rate buy-down credit?
- Have any recent inspections been done? Can we get a copy of the seller's disclosures and any deferred-maintenance estimates?
- Built in 1963 — when were the roof, HVAC, electrical panel, plumbing, and water heater last replaced?
- Is there a deadline driving the sale (1031 exchange, divorce, estate, relocation)? That informs how much negotiation room exists.
- Schools are D-rated, which usually means shorter tenancies and higher turnover. Who's the typical renter profile here, and what's been the actual vacancy rate?
- What's the average days-on-market for RENTAL listings here right now (not sales)? A rising rental-DOM trend means longer vacancies and softer asking-rent achievability than the comps imply.
- What's the recent tenant-quality profile in this submarket — average credit score on applications, eviction rate, late-payment / NSF rate, and stable-employment percentage? A property-management company in the area should have these aggregated.
- How much new for-sale + rental construction is in the pipeline within 1–3 miles? Heavy new supply typically softens prices + rents 12–24 months out; constrained supply supports both.
Investment metrics
- 1% rule
- 0.99% ✗
- Cap rate
- 7.38%
- Cash-on-cash
- 3.89%
- DSCR
- 1.17
- GRM
- 8.4
CMA / ARV
- ARV (on-the-fly)
- $218,536
- Comps found
- 1
Show comp detail 1 sale within ~0.75 mi
| Address | Dist | Beds/Ba | Sqft | Sold | Price | $/sf | Match |
|---|---|---|---|---|---|---|---|
| 310 N Arroyo Blvd | 0.48mi | 4/2.5 | 2,000 (+8%) | 2mo | $235,000 | $118 | 56 |
Match score weights: distance 35% · size 25% · config 20% · recency 20%. Top-matched comps best support the ARV.
Projected returns pro-forma
6.58% appreciation · 3.0% rent growth · sell at horizon
- IRR
- 19.9%
- Equity multiple
- 2.36×
- Total profit
- $55,292
- Equity at exit
- $96,489
- IRR
- 18.9%
- Equity multiple
- 4.82×
- Total profit
- $154,963
- Equity at exit
- $179,780
Cash invested: $40,600 (down + closing). Projections, not guarantees.
Landlord ↔ Tenant lean methodology
- Overall (STATE)
- 87 Strongly Landlord-Friendly
- State Texas
- 87 Strongly Landlord-Friendly · R+5
- County
- — inherits STATE
- City
- — inherits STATE
ZIP-level market 78583
- Home prices YoY
- 3.4%
- Active inventory
- 98
- Price-to-rent
- 8.4×
Monthly cashflow live
- Estimated rent
- $1,435 medium interval (Pro) →
- Mortgage (P&I)
- −$760
- Tax est. 1.5%
- −$181 /mo · $2,175/yr
- Insurance
- −$60
- HOA
- −$0
- Vacancy / Maint / Mgmt
- −$301
- Net cashflow
- $132
Break-even live
Sensitivity live
| Price | -10% $232 | -5% $182 | +0% $132 | +5% $82 | +10% $32 |
|---|---|---|---|---|---|
| Rent | -10% $18 | -5% $75 | +0% $132 | +5% $188 | +10% $245 |
| Rate | -1.0pp $205 | -0.5pp $169 | base $132 | +0.5pp $94 | +1.0pp $56 |
UW: 25.0% down · 7.5% · 30yr · 1.5% tax · 5.0% vac · 8.0% maint · 8.0% mgmt
Financing live
Cash to close
- Down payment
- $36,250
- Closing costs
- $4,350
- Reserves months
- —
- Total cash needed
- —
Loan-product check · same deal, 3 products live
Conventional
25% down · 7.5% · 30yr
- Down + closing
- —
- Monthly P&I
- —
- Monthly cashflow
- —
- DSCR
- —
- Eligible?
- —
Personal DTI + credit; lowest rate.
DSCR
20% down · 8.5% · 30yr
- Down + closing
- —
- Monthly P&I
- —
- Monthly cashflow
- —
- DSCR
- —
- Eligible?
- —
No personal income docs; deal must DSCR.
Hard money
10% down · 12.0% · 12mo
- Down + closing
- —
- Monthly P&I
- —
- Monthly cashflow
- —
- DSCR
- —
- Eligible?
- —
Short-term bridge; refi at stabilization.
Listing history 18 events
-
2026-06-22days on market $145,000 Active 35 DOM
-
2026-06-18days on market $145,000 Active 32 DOM
-
2026-06-17days on market $145,000 Active 31 DOM
-
2026-06-16days on market $145,000 Active 30 DOM
-
2026-06-15days on market $145,000 Active 29 DOM
-
2026-06-14days on market $145,000 Active 27 DOM
-
2026-06-13days on market $145,000 Active 26 DOM
-
2026-06-10days on market $145,000 Active 24 DOM
-
2026-06-09days on market $145,000 Active 23 DOM
-
2026-06-09days on market $145,000 Active 22 DOM
-
2026-06-07days on market $145,000 Active 21 DOM
-
2026-06-05days on market $145,000 Active 18 DOM
-
2026-06-03days on market $145,000 Active 17 DOM
-
2026-06-02days on market $145,000 Active 16 DOM
-
2026-06-01days on market $145,000 Active 15 DOM
-
2026-05-31days on market $145,000 Active 14 DOM
-
2026-05-30days on market $145,000 Active 13 DOM
-
2026-05-11$145,000 Active
ⓘ Source: listings_history table (triggers on properties + properties_extension) + one-shot
backfill from property_details.listing_events for pre-trigger history.
Climate risk First Street
- Flood 1/10 Low FEMA zone X (unshaded) · 0% chance over 30 yrs
- Wildfire 1/10 Low
- Heat 10/10 Extreme 7 d/yr ≥110°F today · 26 d/yr by 30 yrs out
- Wind 9/10 Extreme 99% chance of damaging wind over 30 yrs
- Air quality 1/10 Low 0 unhealthy d/yr today · 0 by 30 yrs out
Nearby sold comps map
Loading sold comps map…
Walkable amenities ~0.75 mi
Loading nearby amenities…
Taxation est. · year 1
- Rental income
- $17,222
- − Mortgage interest
- −$8,122
- − Property taxes
- −$2,175
- − Insurance
- −$725
- − Repairs & maintenance
- −$1,378
- − Management
- −$1,378
- − Depreciation
- −$4,218
- Taxable loss
- −$774
- Est. tax savings @ 24.0%
- +$186
- After-tax cash flow
- $1,766/yr
For passive investors: Depreciation is non-cash, so a rental often shows a tax loss while cash-flowing — sheltering income. Rental losses are passive: they offset passive income freely, and up to $25,000/yr can offset ordinary (W-2) income if you actively participate and your MAGI is under $100k (phasing out to $0 by $150k); unused losses carry forward. On sale, claimed depreciation is recaptured at up to 25%, and gains may owe capital-gains tax (a 1031 exchange can defer both). Figures are a year-1 estimate at your 24.0% rate — not tax advice; consult a CPA.
Condition & rehab AI · 2 photos
This home requires significant repairs and maintenance, including a new roof, siding, and HVAC unit, as well as painting and landscaping. These improvements will significantly increase its value and make it more attractive to buyers and renters.
Repairs flagged
- Major roof — Signs of wear and discoloration suggest significant damage.
- Major siding — The siding is old and shows extensive wear.
- Major concrete driveway — The driveway is cracked and uneven, indicating structural issues.
- Major HVAC unit — The unit appears old and may need replacement or repair.
- Major interior walls — The walls and ceilings show signs of wear and discoloration, indicating they need painting or repairs.
- Major landscaping — The landscaping is sparse and overgrown, requiring significant maintenance or replacement.
Value-add opportunities
- Both painting the exterior and interior — Fresh paint can significantly improve the home's curb appeal and interior aesthetics.
- Both repairing the roof and siding — These repairs are critical to the home's structural integrity and will improve its value.
- Both repairing the driveway and HVAC unit — These repairs will enhance the home's functionality and appeal to potential buyers or renters.
- Both landscaping and curb appeal — A well-maintained and attractive exterior can greatly increase the home's value and appeal to potential buyers or renters.
Renovation cost estimate screening
| Repair item | Severity | Est. cost |
|---|---|---|
| roof · Signs of wear and discoloration suggest significant damage. | Major | $15,000–50,000 |
| siding · The siding is old and shows extensive wear. | Major | $15,000–50,000 |
| concrete driveway · The driveway is cracked and uneven, indicating structural issues. | Major | $15,000–50,000 |
| HVAC unit · The unit appears old and may need replacement or repair. | Major | $15,000–50,000 |
| interior walls · The walls and ceilings show signs of wear and discoloration, indicating they need painting or repairs. | Major | $15,000–50,000 |
| landscaping · The landscaping is sparse and overgrown, requiring significant maintenance or replacement. | Major | $15,000–50,000 |
| Total estimated repair cost · 6 items | $90,000–300,000 |
Value-add ROI direction
- Both painting the exterior and interior — Fresh paint can significantly improve the home's curb appeal and interior aesthetics. ↑
- Both repairing the roof and siding — These repairs are critical to the home's structural integrity and will improve its value. ↑
- Both repairing the driveway and HVAC unit — These repairs will enhance the home's functionality and appeal to potential buyers or renters. ↑
- Both landscaping and curb appeal — A well-maintained and attractive exterior can greatly increase the home's value and appeal to potential buyers or renters. ↑
ⓘ Cost ranges are severity-bucket heuristics (US national rule-of-thumb). Get contractor quotes + a written scope before underwriting a rehab budget.
Schools (NCES district)
- District
- Rio Hondo ISD
- NCES district ID
- 4837170
- Math proficiency
- 15% ▼ -24.00%
- Reading proficiency
- 28% ▼ -10.00%
- Median HH income
- $36,099
- Composite
- 17.78/100
- National rank
- #9014
- State rank
- #769 of 826 in TX
Livability — Rio Hondo
- Score
- 71/100
- State rank
- #305
- US rank
- #6894
Category grades
Schools grade is shown separately in the Schools card above.
Census & demographics
- Census place
- Rio Hondo, TX
- Population (ZIP)
- 5,472
Population outlook (Cameron County) Hauer SSP2
- Today (2025)
- 441,603 people
- By 2030
- 448,113 · +1.5%
- By 2040
- 456,385 · +3.3%
- By 2050
- 456,294 · +3.3%
- By 2075
- 423,851 · -4.0%
- By 2100
- 342,787 · -22.4%
Race, ethnicity, and origin ACS 2023
- Neighborhood character
- Predominantly Hispanic (84%)
- Race & ethnicity
- Hispanic / Latino 84% Two or more races 48% White 15%
- Hispanic origin (detail)
- Mexican 81%
- Common ancestry
- Slovak 1% Portuguese 1% Iranian 1%
- Foreign-born
- 17% · Canada
- Languages at home
- 37% English-only · Spanish 63%
Political lean MEDSL · Cameron
- 2024 margin
- Lean R (+5.8) · D 46.7% · R 52.5%
- 2008→2024 swing
- -34.6pp toward R · 2008: 28.8pp · 2024: -5.8pp
- All cycles
- 2024: R+5.8 2020: D+13.2 2016: D+32.5 2012: D+32.4 2008: D+28.8
Not yet ingested
- Civics
- —
Market trends
- HPI YoY
- ▲ 6.58%
- Current HPI
- 199.084
- Rent YoY
- —
- Metro
- —
- State GDP YoY
- ▲ 3.95%
- F500 in state
- 110
Industry mix (Fortune 500 HQ in TX)
| Industry | F500 HQs | Revenue |
|---|---|---|
| Energy | 16 | $1,198B |
|
||
| Technology | 5 | $198B |
|
||
| Engineering / Construction | 4 | $72B |
|
||
| Energy Services | 3 | $60B |
|
||
| Utilities | 3 | $41B |
|
||
| Healthcare | 2 | $330B |
|
||
Price history
1 event — show timeline
- 2026-05-11 Listed $145,000 RGVMLS
Cash-flow waterfall
monthlySold comps — $/sqft
last 12 mo · ≤1 miLoading sold comps…