 🏗️ New Construction
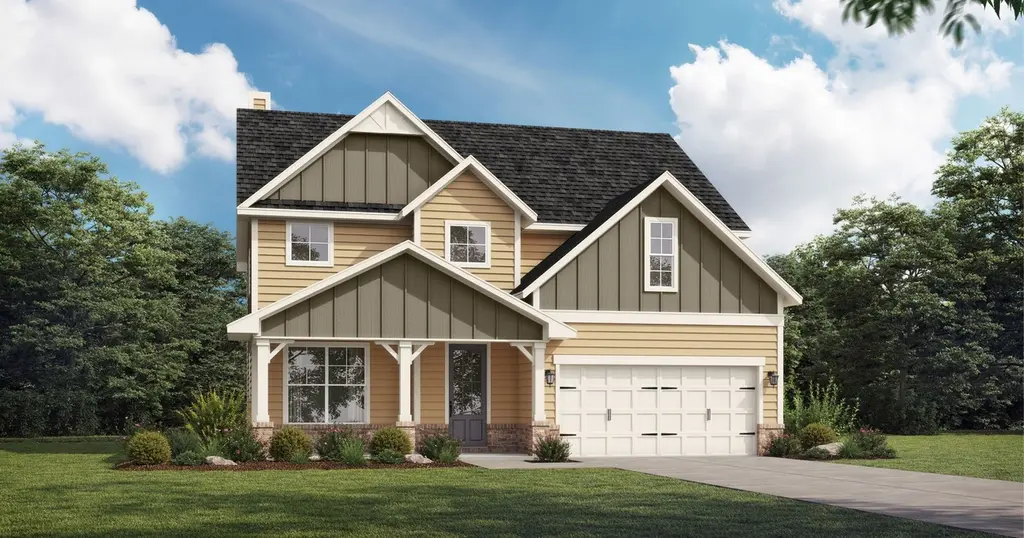
Bedford Plan · Warner Robins, GA
Flood risk 1/10 · Minimal
- FEMA flood zone
- X (unshaded)
- Chance of flooding over 30 yrs
- 0.0%
- Est. flood insurance / yr
- $507 – $1,088
Fire risk 3/10 · Minor
- Est. fire insurance / yr
- $963 – $1,789
Heat risk 7/10 · Major
- Hot days now (above 109°F)
- 7 days/yr
- Hot days in 30 yrs
- 18 days/yr
Wind risk 7/10 · Major
- Chance of severe wind over 30 yrs
- 78.0%
Air-quality risk 3/10 · Minor
- Unhealthy air days now
- 3 days/yr
- Unhealthy air days in 30 yrs
- 4 days/yr
Risk factors via First Street. Map © Google.
Why this score? — see what drove the D- grade
The composite is a weighted blend of 9 inputs, each scored 0–100. Each bar is that input's sub-score; the figure is the points it added to the 100-point composite (weight × sub-score).
- Cash flow +8.6/30.0
- ARV discount +7.5/15.0
- Condition / age +4.8/5.0
- Schools +3.9/10.0
- Rent growth +3.6/5.0
- Livability +3.2/5.0
- 1% rule +2.6/10.0
- DSCR +2.3/10.0
- Appreciation +0.0/10.0
$332,990
🖨 Deal sheet 📄 Offer letter ✓ Due diligence
Listing remarks MLS
Discover Harley Farms South, a beautifully crafted community offering 4- and 5-bedroom new homes in Bonaire, GA, with thoughtful designs and high-end features. These homes offer open-concept living, designer kitchens, covered patios, and spacious layouts with primary suites on the main level or upstairs options with lofts and flex space. Perfectly positioned near Robins Air Force Base and I-75, Harley Farms South puts you just minutes from everyday conveniences-shopping, dining, and major employers-while offering a quiet, well-designed neighborhood to call home. On select homes, get up to $25,000 in Flex Cash plus an included refrigerator. Ask about no payments until September 2026. Preferred Lender promotion ends 05/29/2026.
Key facts
- Covered patios
- Designer kitchens
- Quiet neighborhood
Tags
Neighborhood map
What this means for you Summary
Snapshot
- This is a 5-bed/3.5-bath single-family listed at $333k. Condition is rated excellent.
Deal economics
- At list price, monthly cash flow is $-312 ($-4k/yr) — negative.
- To cash-flow at today's rent, offer at most $313k (5.9% below list).
- To meet the 1% rule (rent ≥ 1% of price), the offer needs to be $274k (17.7% below list).
- Recommended offer: $274k (17.7% below list) — sets the bar for 1% rule.
Location & tenants
- Location reads 65/100 on livability (#227 in GA) — a middle-class / working-renter tenant base. Strengths: cost of living A+, housing A+, health & safety A+; Watch: schools D+, employment D+, crime F.
- Houston County (urban): math 43% / reading 46% proficiency, ranked #23 of 174 in GA (top 13%) — families likely to look elsewhere, expect single-tenant / working-renter base with shorter leases.
- Market conditions: Rents rising fast (+4.5%/yr); 239 active listings in the ZIP; 3 comparable units currently listed for rent nearby; rentals lingering (median 44d on market — plan ~5-8 weeks vacancy on turnover, expect pricing pressure); 67% of comp listings sitting > 30 days — soft ceiling on asking rent; high-income renter base; 1,545 units permitted in Houston County in 2024 (336 in 5+ unit buildings).
Forward outlook
- Local home prices are declining (-3.0%/yr); year-one equity from $2k of loan paydown is wiped out by about $11k of value loss. Plan a longer hold.
- Houston County population projected at +22% by 2050 — long-run rental-demand tailwind backs the buy-and-hold thesis.
Negotiation context
- It's been on market 316 days — a 12% lower offer ($293k) is reasonable based on typical stale-listing flexibility.
Risks & watch-outs
- Climate carrying-cost: major wind risk, 78% chance of damaging wind over 30y; extreme-heat days projected 7→18/yr by 2055 (HVAC capex compounding) — expect insurance premiums to compound above CPI over the hold.
Questions for the listing agent
- What do current leases actually rent for vs. the listed asking? Can we see a recent rent roll and the last 12 months of T-12 income?
- It's been on market 316 days. Have you received any prior offers? Is the seller open to a 18% concession, seller financing, or rate buy-down credit?
- Why hasn't it sold? Are there any deal-killer items the seller is aware of (foundation, flood, title, zoning, code violations)?
- Is there a deadline driving the sale (1031 exchange, divorce, estate, relocation)? That informs how much negotiation room exists.
- Schools are D-rated, which usually means shorter tenancies and higher turnover. Who's the typical renter profile here, and what's been the actual vacancy rate?
- Crime grade is F in this area — have there been break-ins, vandalism, or insurance claims at this property in the last 3 years? What carrier currently insures it and at what premium?
- The area grade is low — what's the realistic commute time and amenity access for the typical tenant pool here? Any planned neighborhood developments (good or bad) we should know about?
- What's the average days-on-market for RENTAL listings here right now (not sales)? A rising rental-DOM trend means longer vacancies and softer asking-rent achievability than the comps imply.
- What's the recent tenant-quality profile in this submarket — average credit score on applications, eviction rate, late-payment / NSF rate, and stable-employment percentage? A property-management company in the area should have these aggregated.
- How much new for-sale + rental construction is in the pipeline within 1–3 miles? Heavy new supply typically softens prices + rents 12–24 months out; constrained supply supports both.
Investment metrics
- 1% rule
- 0.76% ✗
- Cap rate
- 5.25%
- Cash-on-cash
- -3.72%
- DSCR
- 0.83
- GRM
- 10.9
CMA / ARV
- ARV (median comp)
- $358,448
- List price
- $332,990
- Delta
- -7.10%
- Verdict
- FAIR
- Comps
- 20 within 1.0 mi
Show comp detail 12 sales within ~0.75 mi
| Address | Dist | Beds/Ba | Sqft | Sold | Price | $/sf | Match |
|---|---|---|---|---|---|---|---|
| 801 Brittany Nichole Lot 129 Ct | 0.11mi | 5/3.0 | 2,676 (+3%) | 2mo | $375,596 | $140 | 87 |
| 519 Foster Sydney Ct Lot 49 | 0.22mi | 5/4.0 | 2,551 (-2%) | 2mo | $357,674 | $140 | 83 |
| 606 Samantha Brooke Way | 0.27mi | 5/3.0 | 2,496 (-4%) | 0mo | $357,000 | $143 | 78 |
| 716 Lindsey Brooke Trce | 0.30mi | 5/4.0 | 2,866 (+10%) | 1mo | $409,990 | $143 | 66 |
| 817 Brittany Nichole Ct Lot 137 | 0.19mi | 4/2.5 (-1) | 2,286 (-12%) | 0mo | $362,511 | $159 | 61 |
| 507 Foster Sydney Ct | 0.19mi | 4/2.5 (-1) | 2,297 (-12%) | 1mo | $380,000 | $165 | 61 |
| 117 Maisie Way | 0.65mi | 4/2.5 (-1) | 2,599 (-0%) | 1mo | $404,900 | $156 | 60 |
| 117 Maisie Way #232 | 0.65mi | 4/2.5 (-1) | 2,599 (-0%) | 1mo | $404,900 | $156 | 60 |
| 817 Brittany Nichole Lot 137 Ct Lot 137 | 0.19mi | 4/1.5 (-1) | 2,286 (-12%) | 0mo | $362,511 | $159 | 57 |
| 130 Maisie Way #201 | 0.65mi | 4/2.5 (-1) | 2,406 (-8%) | 0mo | $407,500 | $169 | 48 |
| 130 Maisie Way | 0.65mi | 4/2.5 (-1) | 2,406 (-8%) | 0mo | $407,500 | $169 | 48 |
| 503 Thurston St | 0.67mi | 4/3.0 (-1) | 2,862 (+10%) | 0mo | $395,000 | $138 | 45 |
Match score weights: distance 35% · size 25% · config 20% · recency 20%. Top-matched comps best support the ARV.
Projected returns pro-forma
-3.0% appreciation · 4.53% rent growth · sell at horizon
- IRR
- -20.9%
- Equity multiple
- 0.27×
- Total profit
- $-73,599
- Equity at exit
- $53,446
- IRR
- -11.1%
- Equity multiple
- 0.29×
- Total profit
- $-71,331
- Equity at exit
- $30,992
Cash invested: $100,365 (down + closing). Projections, not guarantees.
Landlord ↔ Tenant lean methodology
- Overall (STATE)
- 90 Strongly Landlord-Friendly
- State Georgia
- 90 Strongly Landlord-Friendly · R+3
- County
- — inherits STATE
- City
- — inherits STATE
ZIP-level market 31005
- Home prices YoY
- -17.1%
- Rents YoY
- 4.5%
- Active inventory
- 239
- Price-to-rent
- 10.1×
Monthly cashflow live
- Estimated rent
- $2,741 medium interval (Pro) →
- Mortgage (P&I)
- −$1,880
- Tax est. 1.5%
- −$448 /mo · $5,377/yr
- Insurance
- −$149
- HOA
- −$0
- Vacancy / Maint / Mgmt
- −$576
- Net cashflow
- $-312
Break-even live
UW: 25.0% down · 7.5% · 30yr · 1.5% tax · 5.0% vac · 8.0% maint · 8.0% mgmt
Financing live
Cash to close
- Down payment
- $89,612
- Closing costs
- $10,753
- Reserves months
- —
- Total cash needed
- —
Loan-product check · same deal, 3 products live
Conventional
25% down · 7.5% · 30yr
- Down + closing
- —
- Monthly P&I
- —
- Monthly cashflow
- —
- DSCR
- —
- Eligible?
- —
Personal DTI + credit; lowest rate.
DSCR
20% down · 8.5% · 30yr
- Down + closing
- —
- Monthly P&I
- —
- Monthly cashflow
- —
- DSCR
- —
- Eligible?
- —
No personal income docs; deal must DSCR.
Hard money
10% down · 12.0% · 12mo
- Down + closing
- —
- Monthly P&I
- —
- Monthly cashflow
- —
- DSCR
- —
- Eligible?
- —
Short-term bridge; refi at stabilization.
Rent comps 3 comps
| Address | Beds | Baths | Sqft | Rent | $/sqft | DOM | Units | Dist |
|---|---|---|---|---|---|---|---|---|
| 805 Harley Farms Dr Bonaire, GA | 5.0 | 3.0 | 2440 | $2,550 | $1.05 | 43d | 1 | 0.38mi |
| 805 Harley Farms Dr Bonaire, GA | 5.0 | 3.0 | 2440 | $2,550 | $1.05 | 20d | 1 | 0.38mi |
| 234 Oakley Ct Bonaire, GA | 5.0 | 4.0 | 3335 | $3,000 | $0.90 | 43d | 1 | 0.55mi |
Listing history 18 events
-
2026-06-19days on market $332,990 Active 316 DOM
-
2026-06-18days on market $332,990 Active 315 DOM
-
2026-06-17days on market $332,990 Active 314 DOM
-
2026-06-16days on market $332,990 Active 313 DOM
-
2026-06-15days on market $332,990 Active 312 DOM
-
2026-06-14days on market $332,990 Active 310 DOM
-
2026-06-13days on market $332,990 Active 309 DOM
-
2026-06-10days on market $332,990 Active 307 DOM
-
2026-06-09days on market $332,990 Active 306 DOM
-
2026-06-08days on market $332,990 Active 305 DOM
-
2026-06-07days on market $332,990 Active 304 DOM
-
2026-06-05days on market $332,990 Active 301 DOM
-
2026-06-03days on market $332,990 Active 300 DOM
-
2026-06-02days on market $332,990 Active 299 DOM
-
2026-06-01days on market $332,990 Active 298 DOM
-
2026-05-31days on market $332,990 Active 297 DOM
-
2026-05-30days on market $332,990 Active 296 DOM
-
2025-08-07$332,990 Active 735-char remark
Show marketing remark (735 chars)
Discover Harley Farms South, a beautifully crafted community offering 4- and 5-bedroom new homes in Bonaire, GA, with thoughtful designs and high-end features. These homes offer open-concept living, designer kitchens, covered patios, and spacious layouts with primary suites on the main level or upstairs options with lofts and flex space. Perfectly positioned near Robins Air Force Base and I-75, Harley Farms South puts you just minutes from everyday conveniences-shopping, dining, and major employers-while offering a quiet, well-designed neighborhood to call home. On select homes, get up to $25,000 in Flex Cash plus an included refrigerator. Ask about no payments until September 2026. Preferred Lender promotion ends 05/29/2026.
ⓘ Source: listings_history table (triggers on properties + properties_extension) + one-shot
backfill from property_details.listing_events for pre-trigger history.
Climate risk First Street
- Flood 1/10 Low FEMA zone X (unshaded) · 0% chance over 30 yrs
- Wildfire 3/10 Moderate
- Heat 7/10 Severe 7 d/yr ≥109°F today · 18 d/yr by 30 yrs out
- Wind 7/10 Severe 78% chance of damaging wind over 30 yrs
- Air quality 3/10 Moderate 3 unhealthy d/yr today · 4 by 30 yrs out
Nearby sold comps map
Loading sold comps map…
Walkable amenities ~0.75 mi
Loading nearby amenities…
Taxation est. · year 1
- Rental income
- $32,896
- − Mortgage interest
- −$20,079
- − Property taxes
- −$5,377
- − Insurance
- −$1,792
- − Repairs & maintenance
- −$2,632
- − Management
- −$2,632
- − Depreciation
- −$10,428
- Taxable loss
- −$10,043
- Est. tax savings @ 24.0%
- +$2,410
- After-tax cash flow
- $-1,328/yr
For passive investors: Depreciation is non-cash, so a rental often shows a tax loss while cash-flowing — sheltering income. Rental losses are passive: they offset passive income freely, and up to $25,000/yr can offset ordinary (W-2) income if you actively participate and your MAGI is under $100k (phasing out to $0 by $150k); unused losses carry forward. On sale, claimed depreciation is recaptured at up to 25%, and gains may owe capital-gains tax (a 1031 exchange can defer both). Figures are a year-1 estimate at your 24.0% rate — not tax advice; consult a CPA.
Condition & rehab AI · 3 photos
This home is in excellent condition with no visible repairs or maintenance needed. It offers a high-end design and is move-in ready, making it an attractive option for both resale and rental markets.
Value-add opportunities
- Both Painting exterior and interior — Enhances curb appeal and interior aesthetics
- Both Landscaping improvements — Enhances curb appeal and adds value
- Both New flooring in high-traffic areas — Improves appearance and reduces maintenance
- Both New kitchen appliances — Modernizes the kitchen and adds value
- Both New bathroom fixtures — Enhances functionality and adds value
Renovation cost estimate screening
Value-add ROI direction
- Both Painting exterior and interior — Enhances curb appeal and interior aesthetics ↑
- Both Landscaping improvements — Enhances curb appeal and adds value ↑
- Both New flooring in high-traffic areas — Improves appearance and reduces maintenance ↑
- Both New kitchen appliances — Modernizes the kitchen and adds value ↑
- Both New bathroom fixtures — Enhances functionality and adds value ↑
ⓘ Cost ranges are severity-bucket heuristics (US national rule-of-thumb). Get contractor quotes + a written scope before underwriting a rehab budget.
Schools (NCES district)
- District
- Houston County
- NCES district ID
- 1302880
- Math proficiency
- 43% ▼ -7.00%
- Reading proficiency
- 46% ▼ -2.00%
- Median HH income
- $54,823
- Composite
- 38.68/100
- National rank
- #4144
- State rank
- #23 of 174 in GA
Livability — Warner Robins
- Score
- 65/100
- State rank
- #227
- US rank
- #13290
Category grades
Schools grade is shown separately in the Schools card above.
Census & demographics
- County
- Houston County · 157,321 people
- City population
- 92,102
- Metro
- Warner Robins, GA
- Population (ZIP)
- 22,063
- Household income
- $110,461
- Rent vs Own
- Severe rent burden
- 212.0
Population outlook (Houston County) Hauer SSP2
- Today (2025)
- 169,502 people
- By 2030
- 178,486 · +5.3%
- By 2040
- 194,642 · +14.8%
- By 2050
- 207,119 · +22.2%
- By 2075
- 231,480 · +36.6%
- By 2100
- 235,034 · +38.7%
Race, ethnicity, and origin ACS 2023
- Neighborhood character
- Diverse neighborhood (Simpson 0.57)
- Race & ethnicity
- White 61% Black 23% Two or more races 11% Hispanic / Latino 8% Asian 1%
- Hispanic origin (detail)
- Mexican 3% Puerto Rican 1% Salvadoran 1%
- Common ancestry
- Italian 3% Lithuanian 2% Serbian 1%
- Foreign-born
- 5% · Canada
- Languages at home
- 96% English-only · Spanish 2% French/Haitian/Cajun 1% German/W. Germanic 1%
Political lean MEDSL · Houston
- 2024 margin
- R (+11.3) · D 44.0% · R 55.3%
- 2008→2024 swing
- +8.9pp toward D · 2008: -20.2pp · 2024: -11.3pp
- All cycles
- 2024: R+11.3 2020: R+12.4 2016: R+21.6 2012: R+20.7 2008: R+20.2
Not yet ingested
- Civics
- —
Market trends
- HPI YoY
- ▼ -43.85%
- Current HPI
- 213.0605
- Rent YoY
- ▲ 4.53%
- Metro
- Warner Robins, GA
- State GDP YoY
- ▲ 2.66%
- F500 in state
- 28
Industry mix (Fortune 500 HQ in GA)
| Industry | F500 HQs | Revenue |
|---|---|---|
| Paper / Packaging | 2 | $29B |
|
||
| Retail | 1 | $160B |
|
||
| Transportation / Logistics | 1 | $91B |
|
||
| Airlines | 1 | $62B |
|
||
| Consumer Goods | 1 | $47B |
|
||
| Utilities | 1 | $25B |
|
||
Price history
1 event — show timeline
- 2025-08-07 Listed $332,990 Zillow
Cash-flow waterfall
monthlySold comps — $/sqft
last 12 mo · ≤1 miLoading sold comps…