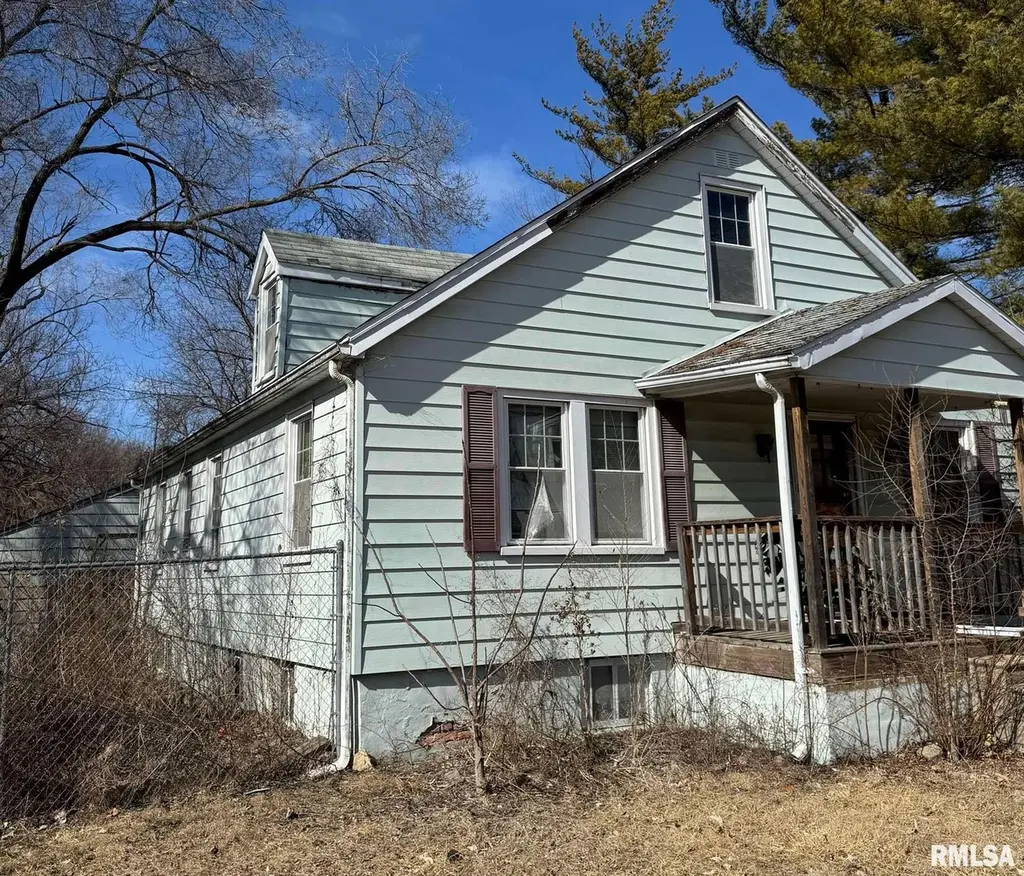
1325 N Park Rd · West Peoria, IL
Flood risk 4/10 · Minor
- FEMA flood zone
- X
- Chance of flooding over 30 yrs
- 0.22%
- Est. flood insurance / yr
- $473 – $860
Fire risk 1/10 · Minimal
- Est. fire insurance / yr
- $804 – $1,492
Heat risk 3/10 · Minor
- Hot days now (above 105°F)
- 7 days/yr
- Hot days in 30 yrs
- 18 days/yr
Wind risk 2/10 · Minimal
- Chance of severe wind over 30 yrs
- 1.0%
Air-quality risk 3/10 · Minor
- Unhealthy air days now
- 1 days/yr
- Unhealthy air days in 30 yrs
- 3 days/yr
Risk factors via First Street. Map © Google.
Why this score? — see what drove the B grade
The composite is a weighted blend of 9 inputs, each scored 0–100. Each bar is that input's sub-score; the figure is the points it added to the 100-point composite (weight × sub-score).
- Cash flow +27.8/30.0
- ARV discount +13.8/15.0
- DSCR +9.8/10.0
- 1% rule +9.0/10.0
- Livability +3.8/5.0
- Rent growth +3.1/5.0
- Condition / age +2.5/5.0
- Schools +1.1/10.0
- Appreciation +0.0/10.0
$89,000
🖨 Deal sheet 📄 Offer letter ✓ Due diligence
Listing remarks MLS
Charming 1930 Home with Investment Potential Near Bradley Park & Farmington Road District Step into history with this 1930-built 4-bedroom home, full of character and opportunity. Nestled in a prime location next to Bradley Park and the vibrant Farmington Road entertainment district, this property is a rare find for investors or buyers seeking a project with strong upside. Inside, you’ll find spacious rooms and classic architectural details ready to be brought back to life with your personal touch. While the home needs updating, the solid bones and generous layout make it an excellent canvas for renovation. The location is unbeatable—whether you’re looking to create a dream home close to recreation and nightlife or to maximize rental and resale potential, this property is positioned for growth. Bring your vision and unlock the full potential of this historic home in West Peoria.
Key facts
- Historic home
- 9,450 sq ft lot
- 2 garage spots
Tags
Neighborhood map
What this means for you Summary
Snapshot
- This is a 3-bed/1.0-bath townhouse listed at $89k.
Deal economics
- At list price, monthly cash flow is $270 ($3k/yr) — positive.
- The deal already cash-flows at list — no discount required.
- Meets the 1% rule at list price ($1k rent vs $89k).
- Recommended offer: $78k (12.0% below list) — sets the bar for market timing.
- Cap rate 9.9% vs local median 6.2% in West Peoria — top-decile yield for the area; either an underpriced asset or a hidden risk that comps aren't pricing in. Stress-test before assuming the spread holds.
Location & tenants
- Location reads 76/100 on livability (#181 in IL, #3,474 nationally) — a middle-class / working-renter tenant base. Strengths: cost of living A+, housing A+, commute A-; Watch: schools F, amenities F.
- Peoria SD 150 (urban): math 11% / reading 14% proficiency, ranked #554 of 620 in IL (top 89%) — low school quality limits family demand, transient renter base, plan for 1-2y turnover; 70% free/reduced lunch — lower-income household profile, screen leases tightly.
- Market conditions: Rents rising (+2.3%/yr); 180 active listings in the ZIP; 26 comparable units currently listed for rent nearby; rentals at typical pace (median 21d on market — plan ~3-4 weeks tenant-placement turnaround); 42% of comp listings sitting > 30 days — soft ceiling on asking rent; 73 units permitted in Peoria County in 2024 (0 in 5+ unit buildings).
Forward outlook
- Local home prices are declining (-3.0%/yr); year-one equity from $615 of loan paydown is wiped out by about $3k of value loss. Plan a longer hold.
- Peoria County population projected at -11% by 2050 — secular population decline; favor cash flow + early exit over multi-decade hold.
- At projected returns (-3.0% appreciation + 2.3% rent growth), your $25k cash investment doubles in ~10 years — after that, you're playing with house money.
Negotiation context
- It's been on market 292 days — a 12% lower offer ($78k) is reasonable based on typical stale-listing flexibility.
- 4 sale attempts since 19y ago; this cycle's ask has dropped $11k (11%) from the opening price — seller is motivated, your offer sets the floor, not the list.
- Current owner paid $32k; list at $89k implies a 178% gain — meaningful room to come down on a strong offer.
Risks & watch-outs
- Watch-outs: property tax is 2.8% of price; built in 1930 — expect roof / HVAC / electrical / plumbing capex.
Questions for the listing agent
- It's been on market 292 days. Have you received any prior offers? Is the seller open to a 12% concession, seller financing, or rate buy-down credit?
- Built in 1930 — when were the roof, HVAC, electrical panel, plumbing, and water heater last replaced?
- Property tax is high relative to price — has the assessment been appealed recently, and will the sale trigger a re-assessment?
- Why hasn't it sold? Are there any deal-killer items the seller is aware of (foundation, flood, title, zoning, code violations)?
- Is there a deadline driving the sale (1031 exchange, divorce, estate, relocation)? That informs how much negotiation room exists.
- Schools are F-rated, which usually means shorter tenancies and higher turnover. Who's the typical renter profile here, and what's been the actual vacancy rate?
- What's the average days-on-market for RENTAL listings here right now (not sales)? A rising rental-DOM trend means longer vacancies and softer asking-rent achievability than the comps imply.
- What's the recent tenant-quality profile in this submarket — average credit score on applications, eviction rate, late-payment / NSF rate, and stable-employment percentage? A property-management company in the area should have these aggregated.
- How much new for-sale + rental construction is in the pipeline within 1–3 miles? Heavy new supply typically softens prices + rents 12–24 months out; constrained supply supports both.
Investment metrics
- 1% rule
- 1.40% ✓
- Cap rate
- 9.94%
- Cash-on-cash
- 13.02%
- DSCR
- 1.58
- GRM
- 6.0
CMA / ARV
- ARV (median comp)
- $103,391
- List price
- $89,000
- Delta
- -13.92%
- Verdict
- UNDERPRICED
- Comps
- 20 within 1.0 mi
Projected returns pro-forma
-3.0% appreciation · 2.3% rent growth · sell at horizon
- IRR
- 2.1%
- Equity multiple
- 1.08×
- Total profit
- $2,011
- Equity at exit
- $13,270
- IRR
- 11.0%
- Equity multiple
- 1.83×
- Total profit
- $20,730
- Equity at exit
- $7,695
Cash invested: $24,920 (down + closing). Projections, not guarantees.
Landlord ↔ Tenant lean methodology
- Overall (STATE)
- 43 Moderately Tenant-Leaning
- State Illinois
- 43 Moderately Tenant-Leaning · D+7
- County
- — inherits STATE
- City
- — inherits STATE
ZIP-level market 61604
- Home prices YoY
- -24.6%
- Rents YoY
- 2.3%
- Active inventory
- 180
- Price-to-rent
- 6.0×
Monthly cashflow live
- Estimated rent
- $1,242 high interval (Pro) →
- Mortgage (P&I)
- −$467
- Tax from tax record
- −$207 /mo · $2,480/yr
- Insurance
- −$37
- HOA
- −$0
- Vacancy / Maint / Mgmt
- −$261
- Net cashflow
- $270
Break-even live
UW: 25.0% down · 7.5% · 30yr · 1.5% tax · 5.0% vac · 8.0% maint · 8.0% mgmt
Financing live
Cash to close
- Down payment
- $22,250
- Closing costs
- $2,670
- Reserves months
- —
- Total cash needed
- —
Loan-product check · same deal, 3 products live
Conventional
25% down · 7.5% · 30yr
- Down + closing
- —
- Monthly P&I
- —
- Monthly cashflow
- —
- DSCR
- —
- Eligible?
- —
Personal DTI + credit; lowest rate.
DSCR
20% down · 8.5% · 30yr
- Down + closing
- —
- Monthly P&I
- —
- Monthly cashflow
- —
- DSCR
- —
- Eligible?
- —
No personal income docs; deal must DSCR.
Hard money
10% down · 12.0% · 12mo
- Down + closing
- —
- Monthly P&I
- —
- Monthly cashflow
- —
- DSCR
- —
- Eligible?
- —
Short-term bridge; refi at stabilization.
Rent comps 26 comps
| Address | Beds | Baths | Sqft | Rent | $/sqft | DOM | Units | Dist |
|---|---|---|---|---|---|---|---|---|
| 1019 N Farmington Rd Unit 1017 Peoria, IL | 3.0 | 1.0 | 1304 | $1,600 | $1.23 | 44d | 1 | 0.34mi |
| 1723 W Fredonia Ave Peoria, IL | 4.0 | 2.5 | 1219 | $2,100 | $1.72 | 13d | 1 | 0.63mi |
| 2601 W Kenwood Ave West Peoria, IL | 3.0 | 1.5 | 1405 | $1,500 | $1.07 | 13d | 1 | 0.65mi |
| 1801 N Gentry Ln West Peoria, IL | 3.0 | 1.0 | 1000 | $1,650 | $1.65 | 13d | 1 | 0.70mi |
| 2023 N Underhill St Peoria, IL | 3.0 | 1.0 | 1050 | $1,200 | $1.14 | 13d | 1 | 0.96mi |
| 102 N Cedar Ave West Peoria, IL | 4.0 | 1.0 | 1272 | $995 | $0.78 | 44d | 1 | 1.05mi |
| 2610 N Renwood Ave Peoria, IL | 2.0 | 1.0 | 904 | $1,300 | $1.44 | 13d | 1 | 1.10mi |
| 1401 W Adrian G Hinton Ave Peoria, IL | 2.0 | 1.0 | 1100 | $775 | $0.70 | 44d | 1 | 1.16mi |
| 1220 W John H Gwynn Jr Ave Peoria, IL | 2.0 | 1.0 | 853 | $745 | $0.87 | 21d | 1 | 1.16mi |
| 911 N Sheridan Rd Unit a1 Peoria, IL | 2.0 | 1.0 | 825 | $850 | $1.03 | 13d | 1 | 1.22mi |
| 911 N Sheridan Rd Unit A4 Peoria, IL | 2.0 | 1.0 | 825 | $850 | $1.03 | 44d | 1 | 1.22mi |
| 903 W Brons Ave Peoria, IL | 3.0 | 1.0 | 971 | $995 | $1.02 | 44d | 1 | 1.23mi |
| 2109 N Abbey Cir Peoria, IL | 3.0 | 2.0 | 1088 | $1,009 | $0.93 | 13d | 1 | 1.26mi |
| 905 W Thrush Ave Peoria, IL | 2.0 | 1.0 | 750 | $950 | $1.27 | 21d | 1 | 1.26mi |
| 2317 W Martin Luther King Junior Dr Peoria, IL | 1.0–2.0 | 1.0 | 697 | $800 | $1.15 | 13d | 3 | 1.30mi |
| 2317 W Martin Luther King Junior Dr Unit 2-214 Peoria, IL | 2.0 | 1.0 | 807 | $800 | $0.99 | 44d | 1 | 1.30mi |
| 501 W Columbia Ter Unit 3 Peoria, IL | 3.0 | 1.0 | 1500 | $1,400 | $0.93 | 44d | 1 | 1.33mi |
| 913 W McClure Ave Peoria, IL | 3.0 | 1.0 | 1400 | $1,200 | $0.86 | 21d | 1 | 1.37mi |
| 812 W Macqueen Ave Peoria, IL | 2.0 | 1.0 | 822 | $795 | $0.97 | 44d | 1 | 1.38mi |
| 1540 W Kettelle St Peoria, IL | 3.0 | 1.0 | 1001 | $748 | $0.75 | 13d | 1 | 1.39mi |
| 1413 W Gilbert Ave Peoria, IL | 2.0 | 2.0 | 1428 | $1,500 | $1.05 | 13d | 1 | 1.40mi |
| 2920 N Rockwood Dr Apt B Peoria, IL | 2.0 | 1.0 | 800 | $895 | $1.12 | 13d | 1 | 1.40mi |
| 416 W Main St Unit A Peoria, IL | 2.0 | 1.0 | 1050 | $950 | $0.90 | 44d | 1 | 1.40mi |
| 2511 W Wardcliffe Dr Unit H Peoria, IL | 2.0 | 1.0 | 800 | $875 | $1.09 | 44d | 1 | 1.40mi |
| 814 W McClure Ave Peoria, IL | 3.0 | 1.0 | 1148 | $1,100 | $0.96 | 44d | 1 | 1.42mi |
| 2207 N Ellis St Peoria, IL | 2.0 | 1.0 | 864 | $999 | $1.16 | 13d | 1 | 1.43mi |
Listing history 30 events
-
2026-06-19days on market $89,000 Active 292 DOM
-
2026-06-18days on market $89,000 Active 291 DOM
-
2026-06-17days on market $89,000 Active 290 DOM
-
2026-06-16days on market $89,000 Active 289 DOM
-
2026-06-15days on market $89,000 Active 288 DOM
-
2026-06-14days on market $89,000 Active 286 DOM
-
2026-06-13days on market $89,000 Active 285 DOM
-
2026-06-10days on market $89,000 Active 283 DOM
-
2026-06-09days on market $89,000 Active 282 DOM
-
2026-06-08days on market $89,000 Active 281 DOM
-
2026-06-07days on market $89,000 Active 280 DOM
-
2026-06-03days on market $89,000 Active 276 DOM
-
2026-06-02days on market $89,000 Active 275 DOM
-
2026-06-01days on market $89,000 Active 274 DOM
-
2026-05-31days on market $89,000 Active 273 DOM
-
2026-05-30days on market $89,000 Active 272 DOM
-
2026-03-03price $89,000 917-char remark
Show marketing remark (917 chars)
Charming 1930 Home with Investment Potential Near Bradley Park & Farmington Road District Step into history with this 1930-built 4-bedroom home, full of character and opportunity. Nestled in a prime location next to Bradley Park and the vibrant Farmington Road entertainment district, this property is a rare find for investors or buyers seeking a project with strong upside. Inside, you’ll find spacious rooms and classic architectural details ready to be brought back to life with your personal touch. While the home needs updating, the solid bones and generous layout make it an excellent canvas for renovation. The location is unbeatable—whether you’re looking to create a dream home close to recreation and nightlife or to maximize rental and resale potential, this property is positioned for growth. Bring your vision and unlock the full potential of this historic home in West Peoria.
-
2026-02-25price $100,000 917-char remark
Show marketing remark (917 chars)
Charming 1930 Home with Investment Potential Near Bradley Park & Farmington Road District Step into history with this 1930-built 4-bedroom home, full of character and opportunity. Nestled in a prime location next to Bradley Park and the vibrant Farmington Road entertainment district, this property is a rare find for investors or buyers seeking a project with strong upside. Inside, you’ll find spacious rooms and classic architectural details ready to be brought back to life with your personal touch. While the home needs updating, the solid bones and generous layout make it an excellent canvas for renovation. The location is unbeatable—whether you’re looking to create a dream home close to recreation and nightlife or to maximize rental and resale potential, this property is positioned for growth. Bring your vision and unlock the full potential of this historic home in West Peoria.
-
2026-02-25price $88,000 917-char remark
Show marketing remark (917 chars)
Charming 1930 Home with Investment Potential Near Bradley Park & Farmington Road District Step into history with this 1930-built 4-bedroom home, full of character and opportunity. Nestled in a prime location next to Bradley Park and the vibrant Farmington Road entertainment district, this property is a rare find for investors or buyers seeking a project with strong upside. Inside, you’ll find spacious rooms and classic architectural details ready to be brought back to life with your personal touch. While the home needs updating, the solid bones and generous layout make it an excellent canvas for renovation. The location is unbeatable—whether you’re looking to create a dream home close to recreation and nightlife or to maximize rental and resale potential, this property is positioned for growth. Bring your vision and unlock the full potential of this historic home in West Peoria.
-
2025-08-31$100,000 Active 917-char remark
Show marketing remark (917 chars)
Charming 1930 Home with Investment Potential Near Bradley Park & Farmington Road District Step into history with this 1930-built 4-bedroom home, full of character and opportunity. Nestled in a prime location next to Bradley Park and the vibrant Farmington Road entertainment district, this property is a rare find for investors or buyers seeking a project with strong upside. Inside, you’ll find spacious rooms and classic architectural details ready to be brought back to life with your personal touch. While the home needs updating, the solid bones and generous layout make it an excellent canvas for renovation. The location is unbeatable—whether you’re looking to create a dream home close to recreation and nightlife or to maximize rental and resale potential, this property is positioned for growth. Bring your vision and unlock the full potential of this historic home in West Peoria.
-
2013-05-23soldstatus $32,000 106-char remark
Show marketing remark (106 chars)
Great investment opportunity, needs some TLC. Convenient location, fenced yard, deck, & large garage.
-
2013-04-30$39,000 106-char remark
Show marketing remark (106 chars)
Great investment opportunity, needs some TLC. Convenient location, fenced yard, deck, & large garage.
-
2009-10-22soldstatus $98,000
-
2009-10-21soldstatus $98,000
-
2009-08-05$98,765
-
2007-06-04soldstatus $94,000
-
2007-06-01soldstatus $94,000
-
2007-05-03$93,900
-
1992-09-28soldstatus $61,500
-
1992-09-28soldstatus $61,500
ⓘ Source: listings_history table (triggers on properties + properties_extension) + one-shot
backfill from property_details.listing_events for pre-trigger history.
Tax reassessment forecast IL · Partial reset (capped growth)
- Current annual tax
- $2,480 · $207/mo
- Projected year-2 tax
- $2,480 · $207/mo
- Expected delta
- $0/yr ($0/mo · 0.0%)
ⓘ Screening estimate from a state-policy table — verify with the county assessor before closing.
Climate risk First Street
- Flood 4/10 Moderate FEMA zone X · 22% chance over 30 yrs
- Wildfire 1/10 Low
- Heat 3/10 Moderate 7 d/yr ≥105°F today · 18 d/yr by 30 yrs out
- Wind 2/10 Low 100% chance of damaging wind over 30 yrs
- Air quality 3/10 Moderate 1 unhealthy d/yr today · 3 by 30 yrs out
Nearby sold comps map
Loading sold comps map…
Walkable amenities ~0.75 mi
Loading nearby amenities…
Taxation est. · year 1
- Rental income
- $14,900
- − Mortgage interest
- −$4,985
- − Property taxes
- −$2,480
- − Insurance
- −$445
- − Repairs & maintenance
- −$1,192
- − Management
- −$1,192
- − Depreciation
- −$2,589
- Taxable income
- $2,016
- Est. tax owed @ 24.0%
- −$484
- After-tax cash flow
- $2,761/yr
For passive investors: Depreciation is non-cash, so a rental often shows a tax loss while cash-flowing — sheltering income. Rental losses are passive: they offset passive income freely, and up to $25,000/yr can offset ordinary (W-2) income if you actively participate and your MAGI is under $100k (phasing out to $0 by $150k); unused losses carry forward. On sale, claimed depreciation is recaptured at up to 25%, and gains may owe capital-gains tax (a 1031 exchange can defer both). Figures are a year-1 estimate at your 24.0% rate — not tax advice; consult a CPA.
Schools (NCES district)
- District
- Peoria SD 150
- NCES district ID
- 1731230
- Math proficiency
- 11% ▼ -5.00%
- Reading proficiency
- 14% ▼ -4.00%
- Median HH income
- $41,951
- Composite
- 10.92/100
- National rank
- #9751
- State rank
- #554 of 620 in IL
Livability — West Peoria
- Score
- 76/100
- State rank
- #181
- US rank
- #3474
Category grades
Schools grade is shown separately in the Schools card above.
Census & demographics
- Census place
- West Peoria, IL
- County
- Peoria County · 120,495 people
- Metro
- Peoria, IL
- Population (ZIP)
- 28,313
- Household income
- $52,414
- Rent vs Own
- Severe rent burden
- 815.0
Population outlook (Peoria County) Hauer SSP2
- Today (2025)
- 183,007 people
- By 2030
- 179,643 · -1.8%
- By 2040
- 171,782 · -6.1%
- By 2050
- 163,508 · -10.7%
- By 2075
- 140,178 · -23.4%
- By 2100
- 114,493 · -37.4%
Race, ethnicity, and origin ACS 2023
- Neighborhood character
- Diverse neighborhood (Simpson 0.61)
- Race & ethnicity
- White 55% Black 29% Two or more races 10% Hispanic / Latino 7% Asian 2%
- Hispanic origin (detail)
- Mexican 5%
- Common ancestry
- Italian 2% Slovak 1% Iranian 1%
- Foreign-born
- 6% · Canada, China
- Languages at home
- 92% English-only · Spanish 4% Chinese 1% French/Haitian/Cajun 1%
Political lean MEDSL · Peoria
- 2024 margin
- Toss-up / Even · D 51.5% · R 46.9% · Other 1.6%
- 2008→2024 swing
- -9.2pp toward R · 2008: 13.9pp · 2024: 4.7pp
- All cycles
- 2024: D+4.7 2020: D+6.3 2016: D+2.8 2012: D+4.4 2008: D+13.9
Not yet ingested
- Civics
- —
Market trends
- HPI YoY
- ▼ -54.15%
- Current HPI
- 165.8838
- Rent YoY
- ▲ 2.30%
- Metro
- Peoria, IL
- State GDP YoY
- ▲ 1.59%
- F500 in state
- 60
Industry mix (Fortune 500 HQ in IL)
| Industry | F500 HQs | Revenue |
|---|---|---|
| Insurance | 4 | $201B |
|
||
| Consumer Goods | 4 | $87B |
|
||
| Industrial Machinery | 3 | $64B |
|
||
| Healthcare | 2 | $55B |
|
||
| Retail / Pharmacy | 1 | $148B |
|
||
| Agriculture / Food | 1 | $86B |
|
||
Price history
+44.7% since first listed14 events — show timeline
- 2026-03-03 Price Changed $89,000 RMLSA as Distributed by MLS Grid
- 2026-02-25 Price Changed $100,000 RMLSA as Distributed by MLS Grid
- 2026-02-25 Price Changed $88,000 RMLSA as Distributed by MLS Grid
- 2025-08-31 Listed $100,000 RMLSA as Distributed by MLS Grid
- 2013-05-23 Sold (MLS) $32,000 RMLSA as Distributed by MLS Grid
- 2013-04-30 Listed $39,000 RMLSA as Distributed by MLS Grid
- 2009-10-22 Sold (Public Records) $98,000 Public Records
- 2009-10-21 Sold (MLS) $98,000 RMLSA as Distributed by MLS Grid
- 2009-08-05 Listed $98,765 RMLSA as Distributed by MLS Grid
- 2007-06-04 Sold (Public Records) $94,000 Public Records
- 2007-06-01 Sold (MLS) $94,000 RMLSA as Distributed by MLS Grid
- 2007-05-03 Listed $93,900 RMLSA as Distributed by MLS Grid
- 1992-09-28 Sold (Public Records) $61,500 Public Records
- 1992-09-28 Sold (Public Records) $61,500 Public Records
Property tax history
+4.2%/yrLatest (2024): $2,480 · +36.2% YoY. Source: county tax records.
Cash-flow waterfall
monthlySold comps — $/sqft
last 12 mo · ≤1 miLoading sold comps…