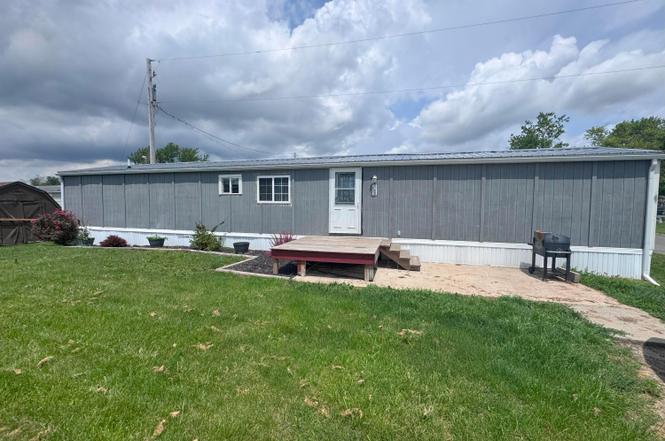
6106 London Groveport Rd Unit C9 · Darbydale, OH
Flood risk 1/10 · Minimal
- FEMA flood zone
- X (unshaded)
- Chance of flooding over 30 yrs
- 0.0%
- Est. flood insurance / yr
- $507 – $1,088
Fire risk 1/10 · Minimal
- Est. fire insurance / yr
- $713 – $1,323
Heat risk 4/10 · Minor
- Hot days now (above 100°F)
- 7 days/yr
- Hot days in 30 yrs
- 18 days/yr
Wind risk 2/10 · Minimal
- Chance of severe wind over 30 yrs
- 1.0%
Air-quality risk 2/10 · Minimal
- Unhealthy air days now
- 1 days/yr
- Unhealthy air days in 30 yrs
- 3 days/yr
Risk factors via First Street. Map © Google.
Why this score? — see what drove the D+ grade
The composite is a weighted blend of 9 inputs, each scored 0–100. Each bar is that input's sub-score; the figure is the points it added to the 100-point composite (weight × sub-score).
- Cash flow +15.0/30.0
- ARV discount +7.5/15.0
- 1% rule +5.0/10.0
- DSCR +5.0/10.0
- Schools +3.8/10.0
- Rent growth +3.4/5.0
- Livability +3.1/5.0
- Condition / age +2.5/5.0
- Appreciation +0.0/10.0
$24,900
🖨 Deal sheet (PDF) 📄 Offer letter ✓ Due diligence
Listing remarks MLS
Manufactured Home, features an open style kitchen and living room. Needs some work done and priced accordingly, being sold as is. Buyer must be approved by the Home Owners Association.
Key facts
- Built 1990
- Listed 116 days
Neighborhood map
What this means for you Summary
Snapshot
- This is a 3-bed/2.0-bath manufactured listed at $25k.
Deal economics
- At list price, monthly cash flow is $658 ($8k/yr) — positive.
- The deal already cash-flows at list — no discount required.
- Meets the 1% rule at list price ($2k rent vs $25k).
- Recommended offer: $23k (9.0% below list) — sets the bar for market timing.
Location & tenants
- Location reads 62/100 on livability (#871 in OH) — a middle-class / working-renter tenant base. Strengths: cost of living A+, housing A+, employment A-; Watch: schools F, amenities F, commute F.
- South-Western City (suburban): math 40% / reading 48% proficiency, ranked #500 of 656 in OH (top 76%) — families likely to look elsewhere, expect single-tenant / working-renter base with shorter leases.
- Market conditions: Rents rising (+3.7%/yr); 327 active listings in the ZIP; solid renter incomes; 8,139 units permitted in Franklin County in 2024 (5,940 in 5+ unit buildings).
Forward outlook
- Local home prices are declining (-3.0%/yr); year-one equity from $172 of loan paydown is wiped out by about $747 of value loss. Plan a longer hold.
- Franklin County population projected at +34% by 2050 — long-run rental-demand tailwind backs the buy-and-hold thesis.
- At projected returns (-3.0% appreciation + 3.7% rent growth), your $7k cash investment doubles in ~1 year — after that, you're playing with house money.
Negotiation context
- It's been on market 116 days — a 9% lower offer ($23k) is reasonable based on typical stale-listing flexibility.
- 5 sale attempts since 5y ago; this cycle's ask has dropped $15k (38%) from the opening price — seller is motivated, your offer sets the floor, not the list.
- Current owner paid $14k; list at $25k implies a 84% gain — meaningful room to come down on a strong offer.
Risks & watch-outs
- Watch-outs: HOA is 33% of rent.
Questions for the listing agent
- It's been on market 116 days. Have you received any prior offers? Is the seller open to a 9% concession, seller financing, or rate buy-down credit?
- What does the HOA fee cover, when was the last increase, and are there any pending special assessments or reserve-fund shortfalls?
- Why hasn't it sold? Are there any deal-killer items the seller is aware of (foundation, flood, title, zoning, code violations)?
- Is there a deadline driving the sale (1031 exchange, divorce, estate, relocation)? That informs how much negotiation room exists.
- Schools are F-rated, which usually means shorter tenancies and higher turnover. Who's the typical renter profile here, and what's been the actual vacancy rate?
- The area grade is low — what's the realistic commute time and amenity access for the typical tenant pool here? Any planned neighborhood developments (good or bad) we should know about?
- What's the average days-on-market for RENTAL listings here right now (not sales)? A rising rental-DOM trend means longer vacancies and softer asking-rent achievability than the comps imply.
- What's the recent tenant-quality profile in this submarket — average credit score on applications, eviction rate, late-payment / NSF rate, and stable-employment percentage? A property-management company in the area should have these aggregated.
- How much new for-sale + rental construction is in the pipeline within 1–3 miles? Heavy new supply typically softens prices + rents 12–24 months out; constrained supply supports both.
Investment metrics
- 1% rule
- 7.27% ✓
- Cap rate
- 37.99%
- Cash-on-cash
- 113.21%
- DSCR
- 6.04
- GRM
- 1.1
CMA / ARV
No comps found within radius.
Projected returns pro-forma
-3.0% appreciation · 3.68% rent growth · sell at horizon
- IRR
- —
- Equity multiple
- 6.67×
- Total profit
- $39,501
- Equity at exit
- $3,713
- IRR
- —
- Equity multiple
- 14.65×
- Total profit
- $95,136
- Equity at exit
- $2,153
Cash invested: $6,972 (down + closing). Projections, not guarantees.
Landlord ↔ Tenant lean methodology
- Overall (STATE)
- 73 Landlord-Friendly
- State Ohio
- 73 Landlord-Friendly · R+6
- County
- — inherits STATE
- City
- — inherits STATE
ZIP-level market 43123
- Rents YoY
- 3.7%
- Active inventory
- 327
- Price-to-rent
- 1.1×
Monthly cashflow live
- Estimated rent
- $1,810 medium interval (Pro) →
- Mortgage (P&I)
- −$131
- Tax est. 1.5%
- −$31 /mo · $374/yr
- Insurance
- −$10
- HOA
- −$600
- Vacancy / Maint / Mgmt
- −$380
- Net cashflow
- $658
Break-even live
Sensitivity live
| Price | -10% $675 | -5% $666 | +0% $658 | +5% $649 | +10% $641 |
|---|---|---|---|---|---|
| Rent | -10% $515 | -5% $586 | +0% $658 | +5% $729 | +10% $801 |
| Rate | -1.0pp $670 | -0.5pp $664 | base $658 | +0.5pp $651 | +1.0pp $645 |
UW: 25.0% down · 7.5% · 30yr · 1.5% tax · 5.0% vac · 8.0% maint · 8.0% mgmt
Financing live
Cash to close
- Down payment
- $6,225
- Closing costs
- $747
- Reserves months
- —
- Total cash needed
- —
Loan-product check · same deal, 3 products live
Conventional
25% down · 7.5% · 30yr
- Down + closing
- —
- Monthly P&I
- —
- Monthly cashflow
- —
- DSCR
- —
- Eligible?
- —
Personal DTI + credit; lowest rate.
DSCR
20% down · 8.5% · 30yr
- Down + closing
- —
- Monthly P&I
- —
- Monthly cashflow
- —
- DSCR
- —
- Eligible?
- —
No personal income docs; deal must DSCR.
Hard money
10% down · 12.0% · 12mo
- Down + closing
- —
- Monthly P&I
- —
- Monthly cashflow
- —
- DSCR
- —
- Eligible?
- —
Short-term bridge; refi at stabilization.
HOA detail
- Monthly dues
- $600 · $7,200/yr
Listing history 16 events
-
2025-10-13status Pending
-
2025-09-25status Active
-
2025-09-25price $24,900
-
2025-09-22historical Contingent
-
2025-09-02price $27,500
-
2025-07-11price $30,000
-
2025-06-19$40,000 Active
-
2025-03-31historical
-
2025-03-24$45,000 Active
-
2021-04-26soldstatus $13,500 Closed 184-char remark
Show marketing remark (184 chars)
Manufactured Home, features an open style kitchen and living room. Needs some work done and priced accordingly, being sold as is. Buyer must be approved by the Home Owners Association.
-
2021-04-13historical Contingent Finance and Inspection 184-char remark
Show marketing remark (184 chars)
Manufactured Home, features an open style kitchen and living room. Needs some work done and priced accordingly, being sold as is. Buyer must be approved by the Home Owners Association.
-
2021-03-21price $18,000 184-char remark
Show marketing remark (184 chars)
Manufactured Home, features an open style kitchen and living room. Needs some work done and priced accordingly, being sold as is. Buyer must be approved by the Home Owners Association.
-
2021-02-25status Active 184-char remark
Show marketing remark (184 chars)
Manufactured Home, features an open style kitchen and living room. Needs some work done and priced accordingly, being sold as is. Buyer must be approved by the Home Owners Association.
-
2021-02-20historical Contingent Finance and Inspection 184-char remark
Show marketing remark (184 chars)
Manufactured Home, features an open style kitchen and living room. Needs some work done and priced accordingly, being sold as is. Buyer must be approved by the Home Owners Association.
-
2021-02-07price $20,000 184-char remark
Show marketing remark (184 chars)
Manufactured Home, features an open style kitchen and living room. Needs some work done and priced accordingly, being sold as is. Buyer must be approved by the Home Owners Association.
-
2021-01-06$25,500 Active 184-char remark
Show marketing remark (184 chars)
Manufactured Home, features an open style kitchen and living room. Needs some work done and priced accordingly, being sold as is. Buyer must be approved by the Home Owners Association.
ⓘ Source: listings_history table (triggers on properties + properties_extension) + one-shot
backfill from property_details.listing_events for pre-trigger history.
Climate risk First Street
- Flood 1/10 Low FEMA zone X (unshaded) · 0% chance over 30 yrs
- Wildfire 1/10 Low
- Heat 4/10 Moderate 7 d/yr ≥100°F today · 18 d/yr by 30 yrs out
- Wind 2/10 Low 100% chance of damaging wind over 30 yrs
- Air quality 2/10 Low 1 unhealthy d/yr today · 3 by 30 yrs out
Nearby sold comps map
Loading sold comps map…
Walkable amenities ~0.75 mi
Loading nearby amenities…
Taxation est. · year 1
- Rental income
- $21,719
- − Mortgage interest
- −$1,395
- − Property taxes
- −$374
- − Insurance
- −$124
- − Repairs & maintenance
- −$1,738
- − Management
- −$1,738
- − HOA
- −$7,200
- − Depreciation
- −$724
- Taxable income
- $8,427
- Est. tax owed @ 24.0%
- −$2,022
- After-tax cash flow
- $5,871/yr
For passive investors: Depreciation is non-cash, so a rental often shows a tax loss while cash-flowing — sheltering income. Rental losses are passive: they offset passive income freely, and up to $25,000/yr can offset ordinary (W-2) income if you actively participate and your MAGI is under $100k (phasing out to $0 by $150k); unused losses carry forward. On sale, claimed depreciation is recaptured at up to 25%, and gains may owe capital-gains tax (a 1031 exchange can defer both). Figures are a year-1 estimate at your 24.0% rate — not tax advice; consult a CPA.
Schools (NCES district)
- District
- South-Western City
- NCES district ID
- 3904480
- Math proficiency
- 40% ▼ -18.00%
- Reading proficiency
- 48% ▼ -10.00%
- Median HH income
- $51,689
- Composite
- 37.95/100
- National rank
- #4305
- State rank
- #500 of 656 in OH
Livability — Darbydale
- Score
- 62/100
- State rank
- #871
- US rank
- #16516
Category grades
Schools grade is shown separately in the Schools card above.
Census & demographics
- County
- Franklin County · 1,351,780 people
- Metro
- Columbus, OH
- Population (ZIP)
- 67,626
- Household income
- $91,008
- Rent vs Own
- Severe rent burden
- 1087.0
Population outlook (Franklin County) Hauer SSP2
- Today (2025)
- 1,456,139 people
- By 2030
- 1,556,890 · +6.9%
- By 2040
- 1,757,349 · +20.7%
- By 2050
- 1,950,539 · +34.0%
- By 2075
- 2,376,171 · +63.2%
- By 2100
- 2,636,796 · +81.1%
Race, ethnicity, and origin ACS 2023
- Neighborhood character
- Predominantly White (84%)
- Race & ethnicity
- White 84% Two or more races 6% Hispanic / Latino 5% Black 5% Asian 2%
- Common ancestry
- Romanian 2% Slovak 2% Italian 2%
- Foreign-born
- 4% · Canada, Vietnam, China
- Languages at home
- 93% English-only · Spanish 3% Russian/Polish/Slavic 1% Other Indo-European 1%
Political lean MEDSL · Franklin
- 2024 margin
- Strong D (+28.4) · D 63.7% · R 35.3% · Other 1.0%
- 2008→2024 swing
- +7.7pp toward D · 2008: 20.7pp · 2024: 28.4pp
- All cycles
- 2024: D+28.4 2020: D+31.4 2016: D+25.9 2012: D+21.7 2008: D+20.7
Not yet ingested
- Civics
- —
Market trends
- HPI YoY
- ▼ -241.42%
- Current HPI
- 238.709
- Rent YoY
- ▲ 3.68%
- Metro
- Columbus, OH
- State GDP YoY
- ▲ 1.98%
- F500 in state
- 48
Industry mix (Fortune 500 HQ in OH)
| Industry | F500 HQs | Revenue |
|---|---|---|
| Insurance | 3 | $145B |
|
||
| Industrial Machinery | 3 | $49B |
|
||
| Financial Services | 3 | $24B |
|
||
| Consumer Goods | 2 | $93B |
|
||
| Aerospace / Defense | 2 | $47B |
|
||
| Utilities | 2 | $33B |
|
||
Price history
-2.4% since first listed16 events — show timeline
- 2025-10-13 Pending — CBRMLS
- 2025-09-25 Relisted — CBRMLS
- 2025-09-25 Price Changed $24,900 CBRMLS
- 2025-09-22 Contingent — CBRMLS
- 2025-09-02 Price Changed $27,500 CBRMLS
- 2025-07-11 Price Changed $30,000 CBRMLS
- 2025-06-19 Listed $40,000 CBRMLS
- 2025-03-31 Listing Removed — CBRMLS
- 2025-03-24 Listed $45,000 CBRMLS
- 2021-04-26 Sold (MLS) $13,500 CBRMLS
- 2021-04-13 Contingent — CBRMLS
- 2021-03-21 Price Changed $18,000 CBRMLS
- 2021-02-25 Relisted — CBRMLS
- 2021-02-20 Contingent — CBRMLS
- 2021-02-07 Price Changed $20,000 CBRMLS
- 2021-01-06 Listed $25,500 CBRMLS
Cash-flow waterfall
monthlySold comps — $/sqft
last 12 mo · ≤1 miLoading sold comps…