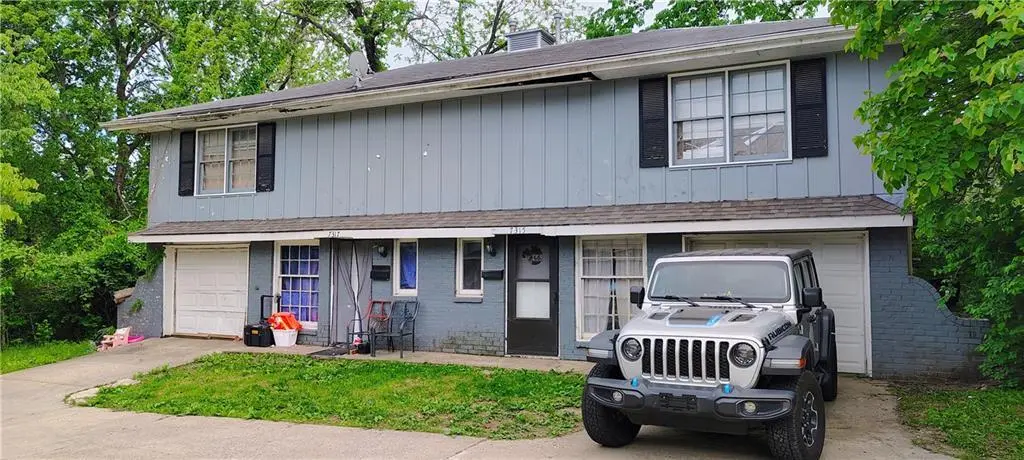
7315 Cleveland Ave · Kansas City, MO
Flood risk 1/10 · Minimal
- FEMA flood zone
- X (unshaded)
- Chance of flooding over 30 yrs
- 0.0%
- Est. flood insurance / yr
- $473 – $860
Fire risk 1/10 · Minimal
- Est. fire insurance / yr
- $1,054 – $1,958
Heat risk 4/10 · Minor
- Hot days now (above 106°F)
- 7 days/yr
- Hot days in 30 yrs
- 17 days/yr
Wind risk 2/10 · Minimal
- Chance of severe wind over 30 yrs
- —
Air-quality risk 3/10 · Minor
- Unhealthy air days now
- 3 days/yr
- Unhealthy air days in 30 yrs
- 5 days/yr
Risk factors via First Street. Map © Google.
Why this score? — see what drove the D grade
The composite is a weighted blend of 9 inputs, each scored 0–100. Each bar is that input's sub-score; the figure is the points it added to the 100-point composite (weight × sub-score).
- Appreciation +10.0/10.0
- Cash flow +8.7/30.0
- ARV discount +7.5/15.0
- Livability +3.9/5.0
- Rent growth +3.2/5.0
- Condition / age +2.5/5.0
- DSCR +2.4/10.0
- 1% rule +1.7/10.0
- Schools +1.5/10.0
$240,000
🖨 Deal sheet 📄 Offer letter ✓ Due diligence
Listing remarks MLS
Great Investment opportunity! Newly Renovated 2bed / 1bath duplex. Lots of completed renovations. Tenants are currently in place under an 18 month lease. Gross rents are $1425 per month. Located near Swope Park. Unit is sold 'AS IS'. Full roof replacement can be included in the purchase price. Many renovations were completed including replacing main sewer line. Owner will replace the roof before closing.
Key facts
- 2 garage spots
- Built 1970
- Listed 14 days
Property features AI
Exterior
- Parking: Detached carport; Off-street parking and shared driveway; 2-car garage
- Utilities: Public water; Public sewer
- Home design: Residential half duplex
- Construction: Brick/mortar construction; Composition roof; Home is 51–75 years old
- Exterior features: Not located in a flood plain; Lot approximately 0.16 acres
Interior
- Bedrooms: 4 bedrooms
- Bathrooms: 2 full bathrooms
- Heating & cooling: Natural gas heating; Electric cooling (central AC)
- Interior features: Finished full basement with crawl space and slab/raised wood elements; 1.5-story floor plan
- Laundry & utility: HVAC maintenance noted
Neighborhood map
What this means for you Summary
Snapshot
- This is a 4-bed/2.0-bath townhouse listed at $240k.
Deal economics
- At list price, monthly cash flow is $-204 ($-2k/yr) — negative.
- To cash-flow at today's rent, offer at most $204k (15.0% below list).
- To meet the 1% rule (rent ≥ 1% of price), the offer needs to be $160k (33.3% below list).
- Recommended offer: $160k (33.3% below list) — sets the bar for 1% rule.
- Cap rate 5.3% vs local median 3.9% in Kansas City — top-decile yield for the area; either an underpriced asset or a hidden risk that comps aren't pricing in. Stress-test before assuming the spread holds.
Location & tenants
- Location reads 78/100 on livability (#28 in MO, #2,671 nationally) — a middle-class / working-renter tenant base. Strengths: amenities A+, commute A+, cost of living A+; Watch: schools C-, crime F.
- Kansas City 33 (urban): math 12% / reading 24% proficiency, ranked #308 of 324 in MO (top 95%) — low school quality limits family demand, transient renter base, plan for 1-2y turnover; 75% free/reduced lunch — lower-income household profile, screen leases tightly.
- Market conditions: Rents rising (+3.0%/yr); 93 active listings in the ZIP; 3 comparable units currently listed for rent nearby; rentals at typical pace (median 16d on market — plan ~3-4 weeks tenant-placement turnaround); 4,002 units permitted in Jackson County in 2024 (2,271 in 5+ unit buildings).
- This rent runs 42% of the median local income ($46k/yr) — at the standard rent-burdened threshold; future hikes will face affordability resistance.
Forward outlook
- In year one you build about $26k of equity ($2k loan paydown + $24k appreciation (10.0% local appreciation)).
- Jackson County population projected at +4% by 2050 — modest demand growth; plan on rents tracking national, not racing it.
- By year 2, paydown + projected appreciation supports a ~$41k cash-out refi (75% LTV) — recoverable capital for the next deal without selling this one.
Negotiation context
- It's been on market 15 days — a 2% lower offer ($236k) is reasonable based on typical stale-listing flexibility.
- 9 sale attempts since 9y ago with the ask held roughly flat each time — persistent listings suggest the price (not the market) is what's stuck; bring a comps-based counter.
Questions for the listing agent
- What do current leases actually rent for vs. the listed asking? Can we see a recent rent roll and the last 12 months of T-12 income?
- Built in 1970 — when were the roof, HVAC, electrical panel, plumbing, and water heater last replaced?
- Is there a deadline driving the sale (1031 exchange, divorce, estate, relocation)? That informs how much negotiation room exists.
- Crime grade is F in this area — have there been break-ins, vandalism, or insurance claims at this property in the last 3 years? What carrier currently insures it and at what premium?
- The area grade is low — what's the realistic commute time and amenity access for the typical tenant pool here? Any planned neighborhood developments (good or bad) we should know about?
- What's the average days-on-market for RENTAL listings here right now (not sales)? A rising rental-DOM trend means longer vacancies and softer asking-rent achievability than the comps imply.
- What's the recent tenant-quality profile in this submarket — average credit score on applications, eviction rate, late-payment / NSF rate, and stable-employment percentage? A property-management company in the area should have these aggregated.
- How much new for-sale + rental construction is in the pipeline within 1–3 miles? Heavy new supply typically softens prices + rents 12–24 months out; constrained supply supports both.
Investment metrics
- 1% rule
- 0.67% ✗
- Cap rate
- 5.28%
- Cash-on-cash
- -3.64%
- DSCR
- 0.84
- GRM
- 12.5
CMA / ARV
No comps found within radius.
Projected returns pro-forma
10.0% appreciation · 2.98% rent growth · sell at horizon
- IRR
- 21.7%
- Equity multiple
- 2.75×
- Total profit
- $117,619
- Equity at exit
- $216,211
- IRR
- 19.5%
- Equity multiple
- 6.30×
- Total profit
- $356,314
- Equity at exit
- $466,267
Cash invested: $67,200 (down + closing). Projections, not guarantees.
Landlord ↔ Tenant lean methodology
- Overall (STATE)
- 81 Strongly Landlord-Friendly
- State Missouri
- 81 Strongly Landlord-Friendly · R+10
- County
- — inherits STATE
- City
- — inherits STATE
ZIP-level market 64132
- Home prices YoY
- 23.6%
- Rents YoY
- 3.0%
- Active inventory
- 93
- Price-to-rent
- 12.5×
Monthly cashflow live
- Estimated rent
- $1,600 medium interval (Pro) →
- Mortgage (P&I)
- −$1,259
- Tax from tax record
- −$109 /mo · $1,307/yr
- Insurance
- −$100
- HOA
- −$0
- Vacancy / Maint / Mgmt
- −$336
- Net cashflow
- $-204
Break-even live
UW: 25.0% down · 7.5% · 30yr · 1.5% tax · 5.0% vac · 8.0% maint · 8.0% mgmt
Financing live
Cash to close
- Down payment
- $60,000
- Closing costs
- $7,200
- Reserves months
- —
- Total cash needed
- —
Loan-product check · same deal, 3 products live
Conventional
25% down · 7.5% · 30yr
- Down + closing
- —
- Monthly P&I
- —
- Monthly cashflow
- —
- DSCR
- —
- Eligible?
- —
Personal DTI + credit; lowest rate.
DSCR
20% down · 8.5% · 30yr
- Down + closing
- —
- Monthly P&I
- —
- Monthly cashflow
- —
- DSCR
- —
- Eligible?
- —
No personal income docs; deal must DSCR.
Hard money
10% down · 12.0% · 12mo
- Down + closing
- —
- Monthly P&I
- —
- Monthly cashflow
- —
- DSCR
- —
- Eligible?
- —
Short-term bridge; refi at stabilization.
Rent comps 3 comps
| Address | Beds | Baths | Sqft | Rent | $/sqft | DOM | Units | Dist |
|---|---|---|---|---|---|---|---|---|
| 1827 E 75th Ter Kansas City, MO | 3.0 | 1.5 | 1700 | $1,595 | $0.94 | 16d | 1 | 1.19mi |
| 6328 College Ave Kansas City, MO | 3.0 | 1.5 | 1856 | $1,399 | $0.75 | 4d | 1 | 1.28mi |
| 7316 Paseo Blvd Kansas City, MO | 3.0 | 1.5 | 1882 | $1,523 | $0.81 | 43d | 1 | 1.28mi |
Listing history 10 events
-
2026-06-18days on market $240,000 Active 15 DOM
-
2026-06-17days on market $240,000 Active 14 DOM
-
2026-06-16days on market $240,000 Active 13 DOM
-
2026-06-15days on market $240,000 Active 12 DOM
-
2026-06-13days on market $240,000 Active 10 DOM
-
2026-06-09days on market $240,000 Active 6 DOM
-
2026-06-08days on market $240,000 Active 5 DOM
-
2026-06-07days on market $240,000 Active 4 DOM
-
2026-06-05remarks 694-char remark
-
2026-06-05$240,000 Active 1 DOM
ⓘ Source: listings_history table (triggers on properties + properties_extension) + one-shot
backfill from property_details.listing_events for pre-trigger history.
Tax reassessment forecast MO · Resets to sale price
- Current annual tax
- $1,307 · $109/mo
- Projected year-2 tax
- $2,328 · $194/mo
- Expected delta
- +$1,021/yr (+$85/mo · 78.2%)
ⓘ Screening estimate from a state-policy table — verify with the county assessor before closing.
Climate risk First Street
- Flood 1/10 Low FEMA zone X (unshaded) · 0% chance over 30 yrs
- Wildfire 1/10 Low
- Heat 4/10 Moderate 7 d/yr ≥106°F today · 17 d/yr by 30 yrs out
- Wind 2/10 Low
- Air quality 3/10 Moderate 3 unhealthy d/yr today · 5 by 30 yrs out
Nearby sold comps map
Loading sold comps map…
Walkable amenities ~0.75 mi
Loading nearby amenities…
Taxation est. · year 1
- Rental income
- $19,199
- − Mortgage interest
- −$13,444
- − Property taxes
- −$1,307
- − Insurance
- −$1,200
- − Repairs & maintenance
- −$1,536
- − Management
- −$1,536
- − Depreciation
- −$6,982
- Taxable loss
- −$6,805
- Est. tax savings @ 24.0%
- +$1,633
- After-tax cash flow
- $-810/yr
For passive investors: Depreciation is non-cash, so a rental often shows a tax loss while cash-flowing — sheltering income. Rental losses are passive: they offset passive income freely, and up to $25,000/yr can offset ordinary (W-2) income if you actively participate and your MAGI is under $100k (phasing out to $0 by $150k); unused losses carry forward. On sale, claimed depreciation is recaptured at up to 25%, and gains may owe capital-gains tax (a 1031 exchange can defer both). Figures are a year-1 estimate at your 24.0% rate — not tax advice; consult a CPA.
Schools (NCES district)
- District
- Kansas City 33
- NCES district ID
- 2916400
- Math proficiency
- 12% ▼ -8.00%
- Reading proficiency
- 24% ▬ 0.00%
- Median HH income
- $35,227
- Composite
- 14.8/100
- National rank
- #9387
- State rank
- #308 of 324 in MO
Livability — Kansas City
- Score
- 78/100
- State rank
- #28
- US rank
- #2671
Category grades
Schools grade is shown separately in the Schools card above.
Census & demographics
- Census place
- Kansas City, MO
- County
- Jackson County · 687,798 people
- City population
- 439,467
- Metro
- Kansas City, MO-KS
- Population (ZIP)
- 12,084
- Household income
- $45,622
- Rent vs Own
- Severe rent burden
- 679.0
Population outlook (Jackson County) Hauer SSP2
- Today (2025)
- 719,589 people
- By 2030
- 731,456 · +1.6%
- By 2040
- 746,689 · +3.8%
- By 2050
- 749,289 · +4.1%
- By 2075
- 736,227 · +2.3%
- By 2100
- 668,210 · -7.1%
Race, ethnicity, and origin ACS 2023
- Neighborhood character
- Predominantly Black (66%)
- Race & ethnicity
- Black 66% White 16% Hispanic / Latino 11% Two or more races 10%
- Hispanic origin (detail)
- Mexican 9%
- Common ancestry
- Italian 2% Scotch-Irish 1% Romanian 1%
- Foreign-born
- 6% · Canada, Jamaica
- Languages at home
- 92% English-only · Spanish 7%
Political lean MEDSL · Jackson
- 2024 margin
- D (+19.3) · D 58.9% · R 39.5% · Other 1.6%
- 2008→2024 swing
- -6.1pp toward R · 2008: 25.4pp · 2024: 19.3pp
- All cycles
- 2024: D+19.3 2020: D+22.0 2016: D+16.6 2012: D+19.0 2008: D+25.4
Not yet ingested
- Civics
- —
Market trends
- HPI YoY
- ▲ 79.13%
- Current HPI
- 414.4305
- Rent YoY
- ▲ 2.98%
- Metro
- Kansas City, MO-KS
- State GDP YoY
- ▲ 1.84%
- F500 in state
- 20
Industry mix (Fortune 500 HQ in MO)
| Industry | F500 HQs | Revenue |
|---|---|---|
| Healthcare | 1 | $163B |
|
||
| Insurance | 1 | $21B |
|
||
| Industrial Technology | 1 | $17B |
|
||
| Retail | 1 | $16B |
|
||
| Industrial Distribution | 1 | $10B |
|
||
| Utilities | 1 | $9B |
|
||
Price history
+336.4% since first listed23 events — show timeline
- 2026-06-04 Listed $240,000 Heartland MLS as Distributed by MLS Grid
- 2026-06-04 Coming Soon $240,000 Heartland MLS as Distributed by MLS Grid
- 2025-09-13 Listing Removed — Heartland MLS as Distributed by MLS Grid
- 2025-06-28 Listed $235,900 Heartland MLS as Distributed by MLS Grid
- 2019-06-23 Listing Removed — Heartland MLS as Distributed by MLS Grid
- 2019-05-17 Relisted — Heartland MLS as Distributed by MLS Grid
- 2019-05-09 Pending — Heartland MLS as Distributed by MLS Grid
- 2019-04-01 Listed $130,000 Heartland MLS as Distributed by MLS Grid
- 2019-01-01 Listing Removed — Heartland MLS as Distributed by MLS Grid
- 2018-10-14 Listed $120,000 Heartland MLS as Distributed by MLS Grid
- 2018-05-01 Sold (Public Records) — Public Records
- 2018-04-17 Sold (MLS) — Heartland MLS as Distributed by MLS Grid
- 2018-03-19 Pending — Heartland MLS as Distributed by MLS Grid
- 2018-03-09 Price Changed $53,000 Heartland MLS as Distributed by MLS Grid
- 2018-02-10 Relisted — Heartland MLS as Distributed by MLS Grid
- 2018-01-11 Pending — Heartland MLS as Distributed by MLS Grid
- 2018-01-02 Relisted — Heartland MLS as Distributed by MLS Grid
- 2018-01-01 Listing Removed — Heartland MLS as Distributed by MLS Grid
- 2017-11-08 Price Changed $59,900 Heartland MLS as Distributed by MLS Grid
- 2017-11-08 Relisted — Heartland MLS as Distributed by MLS Grid
- 2017-08-19 Pending — Heartland MLS as Distributed by MLS Grid
- 2017-07-27 Listed $55,000 Heartland MLS as Distributed by MLS Grid
- 1980-04-01 Sold (Public Records) — Public Records
Property tax history
+1.8%/yrLatest (2025): $1,307 · -20.4% YoY. Source: county tax records.
Cash-flow waterfall
monthlySold comps — $/sqft
last 12 mo · ≤1 miLoading sold comps…