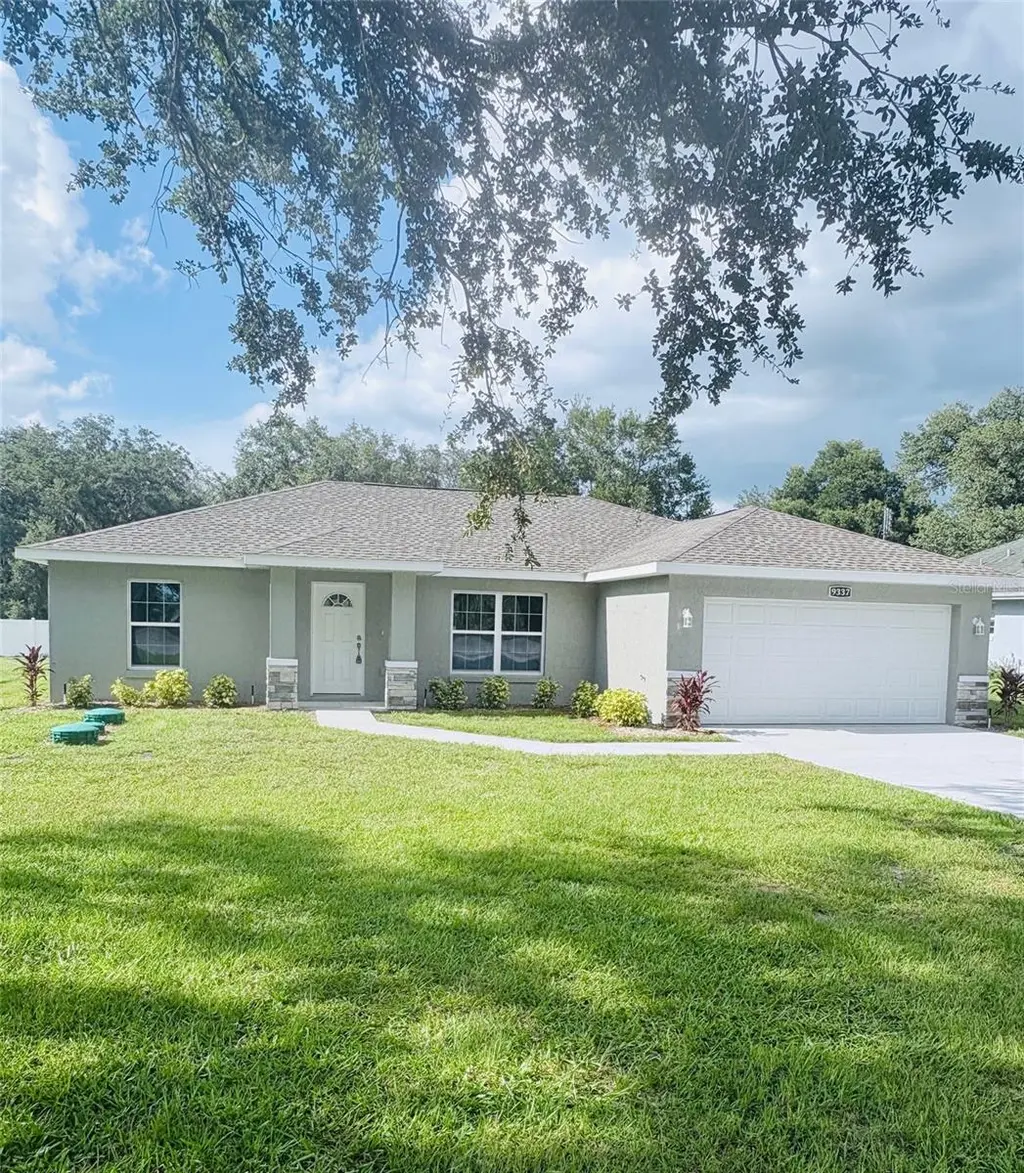
9337 SE Highway 42 · The Villages, FL
Flood risk 1/10 · Minimal
- FEMA flood zone
- X (unshaded)
- Chance of flooding over 30 yrs
- 0.0%
- Est. flood insurance / yr
- $507 – $1,088
Fire risk 2/10 · Minimal
- Est. fire insurance / yr
- $947 – $1,759
Heat risk 8/10 · Major
- Hot days now (above 109°F)
- 7 days/yr
- Hot days in 30 yrs
- 21 days/yr
Wind risk 9/10 · Severe
- Chance of severe wind over 30 yrs
- 99.0%
Air-quality risk 3/10 · Minor
- Unhealthy air days now
- 2 days/yr
- Unhealthy air days in 30 yrs
- 2 days/yr
Risk factors via First Street. Map © Google.
Why this score? — see what drove the D grade
The composite is a weighted blend of 9 inputs, each scored 0–100. Each bar is that input's sub-score; the figure is the points it added to the 100-point composite (weight × sub-score).
- Cash flow +12.5/30.0
- ARV discount +11.5/15.0
- DSCR +3.7/10.0
- Schools +3.6/10.0
- Livability +3.5/5.0
- Rent growth +2.5/5.0
- Condition / age +2.5/5.0
- 1% rule +2.3/10.0
- Appreciation +0.0/10.0
$278,400
🖨 Deal sheet 📄 Offer letter ✓ Due diligence
Listing remarks
This 2025 St. Michael model home is a block construction property located within walking distance to the VA Veterans Clinic near The Villages. The home sits on a . 31-acre lot and offers no HOA, no 55+ restrictions, no CDD, no flood zone, and no other restrictions. With over 2,090 total square feet, the spacious open-concept living area is perfect for entertaining. The kitchen is elegantly designed with granite countertops, 42-inch wood cabinets with soft-close system and crown molding, a large multifunctional island with storage, electrical outlets, and bar seating, a stainless steel double-bowl apron sink, and Whirlpool appliances including a microwave over the range. The interior also fe
Key facts
- No cdd
- No flood zone
- Granite countertops
Tags
Property features AI
Finance
- Other: Lot approximately 0.29 acres (75 x 168); Living area 1,468 (per public records); Building area 2,092 (per public records)
Exterior
- Parking: Attached garage; 2-car garage
- Utilities: Public water; Septic tank; Water connected; Sewer available
- Home design: Single family residence; Residential property; One story; Faces southeast; Completed condition; R1 zoning
- Construction: Block construction; Shingle roof; Block and slab foundation; New construction
- Exterior features: Sliding doors; Asphalt road access
Interior
- Kitchen: Dishwasher; Microwave; Range; Refrigerator
- Bedrooms: 3 bedrooms
- Flooring: Tile
- Bathrooms: 2 full bathrooms
- Heating & cooling: Electric heating; Central air conditioning
- Interior features: Ceiling fans; Thermostat; Walk-in closet(s)
- Laundry & utility: Laundry room
Neighborhood map
What this means for you Summary
Snapshot
- This is a 3-bed/2.0-bath single-family listed at $278k.
Deal economics
- At list price, monthly cash flow is $-42 ($-510/yr) — negative.
- To cash-flow at today's rent, offer at most $271k (2.7% below list).
- To meet the 1% rule (rent ≥ 1% of price), the offer needs to be $203k (27.3% below list).
- Recommended offer: $203k (27.3% below list) — sets the bar for 1% rule.
- Cap rate 6.1% vs local median 5.0% in The Villages — meaningfully above typical; check what's discounted (condition, days-on-market, listing class) to confirm the premium yield is real.
Location & tenants
- Location reads 70/100 on livability (#431 in FL) — a middle-class / working-renter tenant base. Strengths: schools A+, crime A+, housing A; Watch: amenities F, commute F, health & safety F.
- Marion (rural): math 42% / reading 43% proficiency, ranked #61 of 73 in FL (top 84%) — families likely to look elsewhere, expect single-tenant / working-renter base with shorter leases; 61% free/reduced lunch — lower-income household profile, screen leases tightly.
- Market conditions: 705 active listings in the ZIP; 15 comparable units currently listed for rent nearby; rentals at typical pace (median 21d on market — plan ~3-4 weeks tenant-placement turnaround); 7,071 units permitted in Marion County in 2024 (534 in 5+ unit buildings).
- This rent runs 36% of the median local income ($67k/yr) — at the standard rent-burdened threshold; future hikes will face affordability resistance.
Forward outlook
- Local home prices are declining (-3.0%/yr); year-one equity from $2k of loan paydown is wiped out by about $8k of value loss. Plan a longer hold.
- Marion County population projected at +13% by 2050 — modest demand growth; plan on rents tracking national, not racing it.
Negotiation context
- Only 6 days on market — expect competitive offers; lowballing is unlikely to land.
- Current owner paid $15k; list at $278k implies a 1781% gain — meaningful room to come down on a strong offer.
Risks & watch-outs
- Climate carrying-cost: severe wind risk, 99% chance of damaging wind over 30y; extreme-heat days projected 7→21/yr by 2055 (HVAC capex compounding) — expect insurance premiums to compound above CPI over the hold.
Questions for the listing agent
- What do current leases actually rent for vs. the listed asking? Can we see a recent rent roll and the last 12 months of T-12 income?
- Is there a deadline driving the sale (1031 exchange, divorce, estate, relocation)? That informs how much negotiation room exists.
- Schools are A-rated — typically a magnet for longer-tenancy family renters. What's the average tenant stay here, and is there a school-zone premium baked into asking?
- The area grade is low — what's the realistic commute time and amenity access for the typical tenant pool here? Any planned neighborhood developments (good or bad) we should know about?
- What's the average days-on-market for RENTAL listings here right now (not sales)? A rising rental-DOM trend means longer vacancies and softer asking-rent achievability than the comps imply.
- What's the recent tenant-quality profile in this submarket — average credit score on applications, eviction rate, late-payment / NSF rate, and stable-employment percentage? A property-management company in the area should have these aggregated.
- How much new for-sale + rental construction is in the pipeline within 1–3 miles? Heavy new supply typically softens prices + rents 12–24 months out; constrained supply supports both.
Investment metrics
- 1% rule
- 0.73% ✗
- Cap rate
- 6.11%
- Cash-on-cash
- -0.65%
- DSCR
- 0.97
- GRM
- 11.5
CMA / ARV
- ARV (on-the-fly)
- $305,344
- Comps found
- 10
Show comp detail 10 sales within ~0.75 mi
| Address | Dist | Beds/Ba | Sqft | Sold | Price | $/sf | Match |
|---|---|---|---|---|---|---|---|
| 16899 SE 96th Chapelwood Cir | 0.42mi | 2/2.0 (-1) | 1,452 (-1%) | 0mo | $280,000 | $193 | 73 |
| 16845 SE 93rd Cuthbert Cir | 0.45mi | 3/2.0 | 1,552 (+6%) | 1mo | $327,000 | $211 | 69 |
| 8702 SE 166th Birchbrook Loop | 0.70mi | 3/2.0 | 1,422 (-3%) | 1mo | $375,000 | $264 | 61 |
| 16840 SE 97th Wildwood Ct | 0.50mi | 3/2.0 | 1,527 (+4%) | 14mo | $343,000 | $225 | 58 |
| 9191 SE 171st Drayton Pl | 0.68mi | 3/2.0 | 1,510 (+3%) | 10mo | $345,000 | $228 | 55 |
| 16340 SE 89th Ct | 0.47mi | 3/2.0 | 1,421 (-3%) | 22mo | $270,000 | $190 | 55 |
| 16356 SE 87th Ave | 0.69mi | 3/2.0 | 1,621 (+10%) | 3mo | $233,000 | $144 | 48 |
| 16335 SE 88th Ave | 0.56mi | 3/2.0 | 1,300 (-11%) | 9mo | $270,000 | $208 | 48 |
| 9800 SE 167th Pl | 0.52mi | 3/2.0 | 1,296 (-12%) | 14mo | $184,900 | $143 | 44 |
| 9270 SE 157th Pl | 0.72mi | 3/3.0 | 1,630 (+11%) | 1mo | $282,999 | $174 | 43 |
Match score weights: distance 35% · size 25% · config 20% · recency 20%. Top-matched comps best support the ARV.
Projected returns pro-forma
-3.0% appreciation · 3.0% rent growth · sell at horizon
- IRR
- -17.4%
- Equity multiple
- 0.38×
- Total profit
- $-47,962
- Equity at exit
- $41,510
- IRR
- -9.6%
- Equity multiple
- 0.41×
- Total profit
- $-45,828
- Equity at exit
- $24,071
Cash invested: $77,952 (down + closing). Projections, not guarantees.
Landlord ↔ Tenant lean methodology
- Overall (STATE)
- 87 Strongly Landlord-Friendly
- State Florida
- 87 Strongly Landlord-Friendly · R+3
- County
- — inherits STATE
- City
- — inherits STATE
ZIP-level market 34491
- Home prices YoY
- -35.0%
- Active inventory
- 705
- Price-to-rent
- 11.5×
Monthly cashflow live
- Estimated rent
- $2,025 high interval (Pro) →
- Mortgage (P&I)
- −$1,460
- Tax from tax record
- −$66 /mo · $797/yr
- Insurance
- −$116
- HOA
- −$0
- Vacancy / Maint / Mgmt
- −$425
- Net cashflow
- $-42
Break-even live
UW: 25.0% down · 7.5% · 30yr · 1.5% tax · 5.0% vac · 8.0% maint · 8.0% mgmt
Financing live
Cash to close
- Down payment
- $69,600
- Closing costs
- $8,352
- Reserves months
- —
- Total cash needed
- —
Loan-product check · same deal, 3 products live
Conventional
25% down · 7.5% · 30yr
- Down + closing
- —
- Monthly P&I
- —
- Monthly cashflow
- —
- DSCR
- —
- Eligible?
- —
Personal DTI + credit; lowest rate.
DSCR
20% down · 8.5% · 30yr
- Down + closing
- —
- Monthly P&I
- —
- Monthly cashflow
- —
- DSCR
- —
- Eligible?
- —
No personal income docs; deal must DSCR.
Hard money
10% down · 12.0% · 12mo
- Down + closing
- —
- Monthly P&I
- —
- Monthly cashflow
- —
- DSCR
- —
- Eligible?
- —
Short-term bridge; refi at stabilization.
Rent comps 15 comps
| Address | Beds | Baths | Sqft | Rent | $/sqft | DOM | Units | Dist |
|---|---|---|---|---|---|---|---|---|
| 9195 SE 163rd St Summerfield, FL | 3.0 | 2.0 | 1410 | $1,800 | $1.28 | 21d | 1 | 0.27mi |
| 9523 SE 168th Maplesong Ln The Villages, FL | 3.0 | 2.0 | 1265 | $1,975 | $1.56 | 21d | 1 | 0.39mi |
| 16962 SE 94th Sunnybrook Cir The Villages, FL | 2.0 | 2.0 | 1160 | $2,000 | $1.72 | 21d | 1 | 0.43mi |
| 9990 SE 166th St Summerfield, FL | 3.0 | 2.0 | 962 | $1,395 | $1.45 | 13d | 1 | 0.63mi |
| 9871 SE 161st Lane Rd Unit 0 Summerfield, FL | 4.0 | 2.0 | 1827 | $2,200 | $1.20 | 21d | 1 | 0.74mi |
| 17199 SE 97th Ter Summerfield, FL | 3.0 | 2.0 | 1404 | $1,990 | $1.42 | 21d | 1 | 0.83mi |
| 10326 SE 162nd Place Rd Summerfield, FL | 3.0 | 2.0 | 1419 | $2,300 | $1.62 | 13d | 1 | 0.99mi |
| 8721 SE 157th St Summerfield, FL | 3.0 | 2.0 | 1236 | $1,650 | $1.33 | 21d | 1 | 1.05mi |
| 8364 SE 158th Pl Summerfield, FL | 3.0 | 2.0 | 1374 | $2,000 | $1.46 | 13d | 1 | 1.17mi |
| 8352 SE 158th Pl Summerfield, FL | 3.0 | 2.0 | 1232 | $2,000 | $1.62 | 13d | 1 | 1.19mi |
| 17582 SE 96th Ct Summerfield, FL | 2.0 | 2.0 | 1652 | $1,750 | $1.06 | 21d | 1 | 1.23mi |
| 17532 SE 100th Ct Summerfield, FL | 2.0 | 2.0 | 1217 | $1,800 | $1.48 | 21d | 1 | 1.27mi |
| 17713 SE 95th Cir Summerfield, FL | 3.0 | 2.0 | 1450 | $2,000 | $1.38 | 21d | 1 | 1.32mi |
| 17324 SE 82nd Pecan Ter The Villages, FL | 2.0 | 2.0 | 1358 | $2,500 | $1.84 | 21d | 1 | 1.39mi |
| 17400 SE 82nd Roslyn Ct The Villages, FL | 2.0 | 2.0 | 1138 | $4,700 | $4.13 | 21d | 1 | 1.45mi |
Listing history 6 events
-
2026-06-18days on market $278,400 Active 6 DOM
-
2026-06-17days on market $278,400 Active 5 DOM
-
2026-06-16days on market $278,400 Active 4 DOM
-
2026-06-15days on market $278,400 Active 3 DOM
-
2026-06-13remarks 699-char remark
-
2026-06-13$278,400 Active 1 DOM
ⓘ Source: listings_history table (triggers on properties + properties_extension) + one-shot
backfill from property_details.listing_events for pre-trigger history.
Tax reassessment forecast FL · Resets to sale price
- Current annual tax
- $797 · $66/mo
- Projected year-2 tax
- $2,311 · $193/mo
- Expected delta
- +$1,513/yr (+$126/mo · 189.8%)
ⓘ Screening estimate from a state-policy table — verify with the county assessor before closing.
Climate risk First Street
- Flood 1/10 Low FEMA zone X (unshaded) · 0% chance over 30 yrs
- Wildfire 2/10 Low
- Heat 8/10 Severe 7 d/yr ≥109°F today · 21 d/yr by 30 yrs out
- Wind 9/10 Extreme 99% chance of damaging wind over 30 yrs
- Air quality 3/10 Moderate 2 unhealthy d/yr today · 2 by 30 yrs out
Nearby sold comps map
Loading sold comps map…
Walkable amenities ~0.75 mi
Loading nearby amenities…
Taxation est. · year 1
- Rental income
- $24,302
- − Mortgage interest
- −$15,595
- − Property taxes
- −$797
- − Insurance
- −$1,392
- − Repairs & maintenance
- −$1,944
- − Management
- −$1,944
- − Depreciation
- −$8,099
- Taxable loss
- −$5,469
- Est. tax savings @ 24.0%
- +$1,313
- After-tax cash flow
- $803/yr
For passive investors: Depreciation is non-cash, so a rental often shows a tax loss while cash-flowing — sheltering income. Rental losses are passive: they offset passive income freely, and up to $25,000/yr can offset ordinary (W-2) income if you actively participate and your MAGI is under $100k (phasing out to $0 by $150k); unused losses carry forward. On sale, claimed depreciation is recaptured at up to 25%, and gains may owe capital-gains tax (a 1031 exchange can defer both). Figures are a year-1 estimate at your 24.0% rate — not tax advice; consult a CPA.
Schools (NCES district)
- District
- Marion
- NCES district ID
- 1201260
- Math proficiency
- 42% ▼ -7.00%
- Reading proficiency
- 43% ▼ -4.00%
- Median HH income
- $40,015
- Composite
- 35.61/100
- National rank
- #4890
- State rank
- #61 of 73 in FL
Livability — The Villages
- Score
- 70/100
- State rank
- #431
- US rank
- #7363
Category grades
Schools grade is shown separately in the Schools card above.
Census & demographics
- County
- Marion County · 315,796 people
- City population
- 83,973
- Metro
- Ocala, FL
- Population (ZIP)
- 33,318
- Household income
- $66,679
- Rent vs Own
- Severe rent burden
- 256.0
Population outlook (Marion County) Hauer SSP2
- Today (2025)
- 365,905 people
- By 2030
- 376,768 · +3.0%
- By 2040
- 396,555 · +8.4%
- By 2050
- 412,723 · +12.8%
- By 2075
- 446,090 · +21.9%
- By 2100
- 436,193 · +19.2%
Race, ethnicity, and origin ACS 2023
- Neighborhood character
- Predominantly White (77%)
- Race & ethnicity
- White 77% Hispanic / Latino 14% Two or more races 9% Black 4% Asian 2%
- Hispanic origin (detail)
- Mexican 3% Puerto Rican 6% Cuban 1%
- Common ancestry
- Lithuanian 3% Slovak 2% Romanian 2%
- Foreign-born
- 8% · Canada, Vietnam, Jamaica
- Languages at home
- 85% English-only · Spanish 11% Vietnamese 1% French/Haitian/Cajun 1%
Political lean MEDSL · Marion
- 2024 margin
- Solid R (+31.6) · D 33.8% · R 65.5%
- 2008→2024 swing
- -20.0pp toward R · 2008: -11.6pp · 2024: -31.6pp
- All cycles
- 2024: R+31.6 2020: R+25.9 2016: R+26.2 2012: R+16.2 2008: R+11.6
Not yet ingested
- Civics
- —
Market trends
- HPI YoY
- ▼ -107.67%
- Current HPI
- 200.0792
- Rent YoY
- —
- Metro
- Ocala, FL
- State GDP YoY
- ▲ 3.28%
- F500 in state
- 36
Industry mix (Fortune 500 HQ in FL)
| Industry | F500 HQs | Revenue |
|---|---|---|
| Industrial Technology | 2 | $29B |
|
||
| Insurance | 2 | $17B |
|
||
| Retail | 1 | $60B |
|
||
| Technology Distribution | 1 | $58B |
|
||
| Homebuilding | 1 | $35B |
|
||
| Technology Manufacturing | 1 | $35B |
|
||
Price history
+1781.1% since first listed2 events — show timeline
- 2026-06-12 Listed $278,400 Stellar MLS as Distributed by MLS Grid
- 2003-11-20 Sold (Public Records) $14,800 Public Records
Property tax history
+13.8%/yrLatest (2025): $797 · +65.5% YoY. Source: county tax records.
Cash-flow waterfall
monthlySold comps — $/sqft
last 12 mo · ≤1 miLoading sold comps…