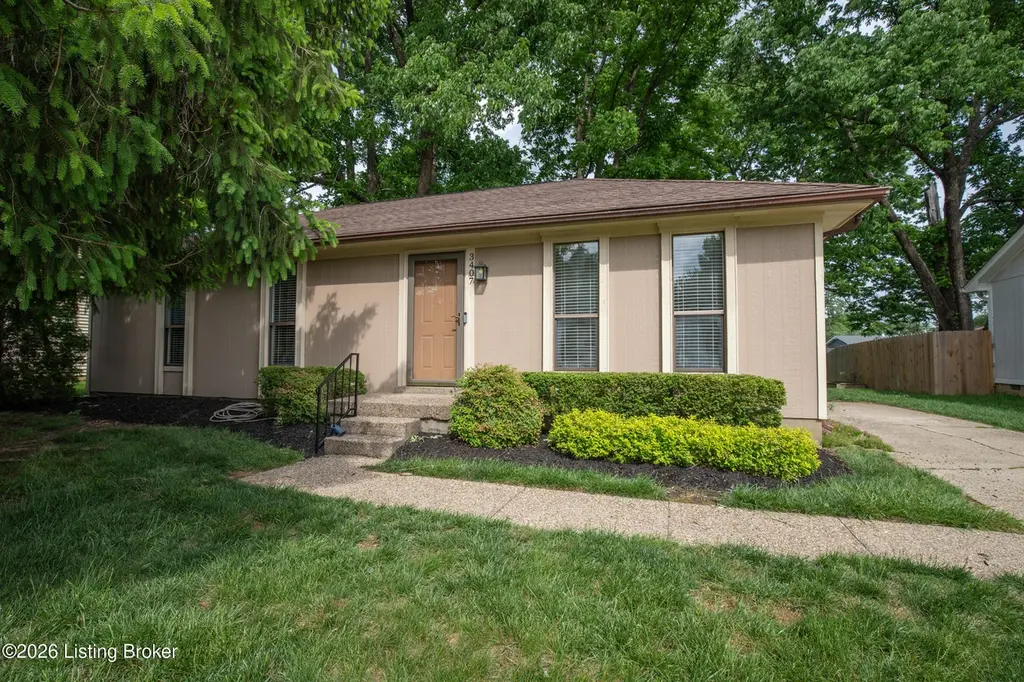
3407 La Follette Dr · Jeffersontown, KY
Flood risk 1/10 · Minimal
- FEMA flood zone
- X (unshaded)
- Chance of flooding over 30 yrs
- 0.0%
- Est. flood insurance / yr
- $507 – $1,088
Fire risk 1/10 · Minimal
- Est. fire insurance / yr
- $839 – $1,559
Heat risk 5/10 · Moderate
- Hot days now (above 103°F)
- 7 days/yr
- Hot days in 30 yrs
- 20 days/yr
Wind risk 2/10 · Minimal
- Chance of severe wind over 30 yrs
- 3.0%
Air-quality risk 3/10 · Minor
- Unhealthy air days now
- 2 days/yr
- Unhealthy air days in 30 yrs
- 5 days/yr
Risk factors via First Street. Map © Google.
Why this score? — see what drove the D+ grade
The composite is a weighted blend of 9 inputs, each scored 0–100. Each bar is that input's sub-score; the figure is the points it added to the 100-point composite (weight × sub-score).
- ARV discount +15.0/15.0
- Cash flow +13.8/30.0
- DSCR +4.2/10.0
- Livability +4.0/5.0
- Rent growth +3.6/5.0
- 1% rule +3.4/10.0
- Condition / age +2.5/5.0
- Schools +2.3/10.0
- Appreciation +0.0/10.0
$210,000
🖨 Deal sheet 📄 Offer letter ✓ Due diligence
Listing remarks
* * * Looking to BET on BUILDING SWEAT EQUITY this Derby Week? * * * . Look no further than this mint condition JTown RANCH! The interior is a cosmetic playground where YOU can go in and make this wonderful home your own! GREAT fenced backyard! AWESOME LOCATION, very functional floor plan w/ formal living room, MASSIVE Kitchen, and a cozy family room! The yard is flat and spacious. This one is going to draw a Derby-sized crowd, so schedule your showing today! Offers shall be submitted by 5 PM, Sunday, May 3 with a response no later than noon on Monday, May 4.
Key facts
- Spacious yard
- Cozy family room
- Fenced backyard
Tags
Property features AI
Finance
- HOA & community: No association fee
Exterior
- Parking: Driveway
- Utilities: Electricity connected
- Home design: Single-family ranch-style home; One story; Built in 1984
- Construction: Wood frame construction; Shingle roof; Crawl space foundation
- Exterior features: Located on a 0.21-acre lot; Subdivision: HILLRIDGE EAST; Directions available
Interior
- Kitchen: Kitchen located on the first floor
- Bedrooms: Three bedrooms, all on the first floor; Primary bedroom on the first floor
- Bathrooms: One full bathroom on the first floor
- Heating & cooling: One HVAC unit; Electric heating with heat pump; Central air conditioning
- Interior features: Six total rooms; Four closets; One fireplace on the first floor; No basement
- Laundry & utility: Laundry room on the first floor; First-floor laundry
Neighborhood map
What this means for you Summary
Snapshot
- This is a 3-bed/1.0-bath single-family listed at $210k.
Deal economics
- At list price, monthly cash flow is $20 ($238/yr) — positive.
- The deal already cash-flows at list — no discount required.
- To meet the 1% rule (rent ≥ 1% of price), the offer needs to be $176k (16.1% below list).
- Recommended offer: $176k (16.1% below list) — sets the bar for 1% rule.
- Cap rate 6.4% vs local median 4.2% in Jeffersontown — top-decile yield for the area; either an underpriced asset or a hidden risk that comps aren't pricing in. Stress-test before assuming the spread holds.
Location & tenants
- Location reads 81/100 on livability (#68 in KY, #1,520 nationally) — a professional / high-income tenant draw. Strengths: commute A+, cost of living A+, housing A+; Watch: schools C-, health & safety D+, amenities F.
- Jefferson County (urban): math 19% / reading 35% proficiency, ranked #121 of 165 in KY (top 73%) — low school quality limits family demand, transient renter base, plan for 1-2y turnover.
- Market conditions: Rents rising fast (+4.3%/yr); 228 active listings in the ZIP; 13 comparable units currently listed for rent nearby; rentals at typical pace (median 15d on market — plan ~3-4 weeks tenant-placement turnaround); solid renter incomes; 2,836 units permitted in Jefferson County in 2024 (1,558 in 5+ unit buildings).
Forward outlook
- Local home prices are declining (-3.0%/yr); year-one equity from $1k of loan paydown is wiped out by about $6k of value loss. Plan a longer hold.
- Jefferson County population projected at +13% by 2050 — modest demand growth; plan on rents tracking national, not racing it.
Negotiation context
- It's been on market 20 days — a 2% lower offer ($207k) is reasonable based on typical stale-listing flexibility.
Risks & watch-outs
- Climate carrying-cost: extreme-heat days projected 7→20/yr by 2055 (HVAC capex compounding) — expect insurance premiums to compound above CPI over the hold.
Questions for the listing agent
- Is there a deadline driving the sale (1031 exchange, divorce, estate, relocation)? That informs how much negotiation room exists.
- The area grade is low — what's the realistic commute time and amenity access for the typical tenant pool here? Any planned neighborhood developments (good or bad) we should know about?
- What's the average days-on-market for RENTAL listings here right now (not sales)? A rising rental-DOM trend means longer vacancies and softer asking-rent achievability than the comps imply.
- What's the recent tenant-quality profile in this submarket — average credit score on applications, eviction rate, late-payment / NSF rate, and stable-employment percentage? A property-management company in the area should have these aggregated.
- How much new for-sale + rental construction is in the pipeline within 1–3 miles? Heavy new supply typically softens prices + rents 12–24 months out; constrained supply supports both.
Investment metrics
- 1% rule
- 0.84% ✗
- Cap rate
- 6.41%
- Cash-on-cash
- 0.40%
- DSCR
- 1.02
- GRM
- 9.9
CMA / ARV
- ARV (on-the-fly)
- $257,404
- Comps found
- 12
Show comp detail 12 sales within ~0.75 mi
| Address | Dist | Beds/Ba | Sqft | Sold | Price | $/sf | Match |
|---|---|---|---|---|---|---|---|
| 3407 La Follette Dr | 0.00mi | 3/1.0 | 1,268 (0%) | 1mo | $204,828 | $162 | 99 |
| 3704 Ethelwood Dr | 0.27mi | 4/2.0 (+1) | 1,272 (+0%) | 5mo | $258,600 | $203 | 73 |
| 3901 Longview Rd | 0.47mi | 3/1.5 | 1,218 (-4%) | 3mo | $274,500 | $225 | 67 |
| 3309 Warson Ct | 0.21mi | 3/1.0 | 1,080 (-15%) | 1mo | $219,600 | $203 | 65 |
| 9005 Raintree Dr | 0.63mi | 3/2.0 | 1,257 (-1%) | 3mo | $309,900 | $247 | 62 |
| 3701 Glenlea Way | 0.62mi | 3/1.5 | 1,291 (+2%) | 5mo | $191,000 | $148 | 61 |
| 9708 Galene Dr | 0.42mi | 3/1.5 | 1,137 (-10%) | 4mo | $210,000 | $185 | 58 |
| 8812 Raintree Dr | 0.71mi | 3/2.0 | 1,250 (-1%) | 6mo | $300,000 | $240 | 55 |
| 3125 Lynnwood Way | 0.72mi | 3/1.0 | 1,209 (-5%) | 6mo | $215,000 | $178 | 53 |
| 9610 Watterson Trl | 0.74mi | 2/1.0 (-1) | 1,359 (+7%) | 2mo | $285,000 | $210 | 47 |
| 9002 Green Garden Ct | 0.61mi | 4/2.0 (+1) | 1,386 (+9%) | 2mo | $318,000 | $229 | 45 |
| 3121 Lynnwood Way | 0.72mi | 4/2.0 (+1) | 1,388 (+10%) | 4mo | $245,500 | $177 | 38 |
Match score weights: distance 35% · size 25% · config 20% · recency 20%. Top-matched comps best support the ARV.
Projected returns pro-forma
-3.0% appreciation · 4.34% rent growth · sell at horizon
- IRR
- -14.3%
- Equity multiple
- 0.48×
- Total profit
- $-30,382
- Equity at exit
- $31,312
- IRR
- -3.6%
- Equity multiple
- 0.75×
- Total profit
- $-14,764
- Equity at exit
- $18,157
Cash invested: $58,800 (down + closing). Projections, not guarantees.
Landlord ↔ Tenant lean methodology
- Overall (STATE)
- 83 Strongly Landlord-Friendly
- State Kentucky
- 83 Strongly Landlord-Friendly · R+16
- County
- — inherits STATE
- City
- — inherits STATE
ZIP-level market 40299
- Rents YoY
- 4.3%
- Active inventory
- 228
- Price-to-rent
- 9.9×
Monthly cashflow live
- Estimated rent
- $1,763 high interval (Pro) →
- Mortgage (P&I)
- −$1,101
- Tax from tax record
- −$184 /mo · $2,208/yr
- Insurance
- −$88
- HOA
- −$0
- Vacancy / Maint / Mgmt
- −$370
- Net cashflow
- $20
Break-even live
UW: 25.0% down · 7.5% · 30yr · 1.5% tax · 5.0% vac · 8.0% maint · 8.0% mgmt
Financing live
Cash to close
- Down payment
- $52,500
- Closing costs
- $6,300
- Reserves months
- —
- Total cash needed
- —
Loan-product check · same deal, 3 products live
Conventional
25% down · 7.5% · 30yr
- Down + closing
- —
- Monthly P&I
- —
- Monthly cashflow
- —
- DSCR
- —
- Eligible?
- —
Personal DTI + credit; lowest rate.
DSCR
20% down · 8.5% · 30yr
- Down + closing
- —
- Monthly P&I
- —
- Monthly cashflow
- —
- DSCR
- —
- Eligible?
- —
No personal income docs; deal must DSCR.
Hard money
10% down · 12.0% · 12mo
- Down + closing
- —
- Monthly P&I
- —
- Monthly cashflow
- —
- DSCR
- —
- Eligible?
- —
Short-term bridge; refi at stabilization.
Rent comps 13 comps
| Address | Beds | Baths | Sqft | Rent | $/sqft | DOM | Units | Dist |
|---|---|---|---|---|---|---|---|---|
| 3600 Ember Cir Louisville, KY | 4.0 | 1.5 | 1272 | $1,770 | $1.39 | 16d | 1 | 0.29mi |
| 3805 Bigelow Dr Louisville, KY | 3.0 | 2.0 | 1674 | $2,100 | $1.25 | 23d | 1 | 0.34mi |
| 9601 Balsam Way Louisville, KY | 1.0–3.0 | 1.0–1.5 | 962 | $1,405 | $1.46 | 2d | 29 | 0.58mi |
| 292 Stoke on Trent St Jeffersontown, KY | 1.0–3.0 | 1.0–2.5 | 955 | $1,499 | $1.57 | 3d | 9 | 0.62mi |
| 3706 Locust Ave Louisville, KY | 3.0 | 2.0 | 1146 | $1,799 | $1.57 | 2d | 1 | 0.76mi |
| 3061 Sprowl Rd Louisville, KY | 1.0–2.0 | 1.0–1.5 | 862 | $1,299 | $1.51 | 3d | 8 | 0.95mi |
| 4208 Prince Ln Louisville, KY | 3.0 | 1.0 | 925 | $1,499 | $1.62 | 16d | 1 | 1.04mi |
| 9106 Talitha Dr Louisville, KY | 3.0 | 2.0 | 1414 | $2,035 | $1.44 | 11d | 1 | 1.08mi |
| 10400 Pavilion Way Louisville, KY | 1.0–3.0 | 1.0–2.0 | 1010 | $1,869 | $1.85 | 3d | 20 | 1.20mi |
| 10012 Michaele Ln Louisville, KY | 2.0 | 2.0 | 1075 | $1,100 | $1.02 | 16d | 1 | 1.22mi |
| 10012 Michaele Ln Unit 7 Louisville, KY | 2.0 | 2.0 | 1075 | $1,100 | $1.02 | 23d | 1 | 1.22mi |
| 4006 Mimosa View Dr Louisville, KY | 3.0 | 2.5 | 1652 | $2,150 | $1.30 | 14d | 1 | 1.47mi |
| 4007 Mimosa View Dr Louisville, KY | 3.0 | 2.0 | 1720 | $2,100 | $1.22 | 23d | 1 | 1.49mi |
Listing history 3 events
-
2026-05-19status Pending
-
2026-05-04historical Active Under Contract
-
2026-04-29$210,000 Active
ⓘ Source: listings_history table (triggers on properties + properties_extension) + one-shot
backfill from property_details.listing_events for pre-trigger history.
Tax reassessment forecast KY · Resets to sale price
- Current annual tax
- $2,208 · $184/mo
- Projected year-2 tax
- $2,208 · $184/mo
- Expected delta
- $0/yr ($0/mo · 0.0%)
ⓘ Screening estimate from a state-policy table — verify with the county assessor before closing.
Climate risk First Street
- Flood 1/10 Low FEMA zone X (unshaded) · 0% chance over 30 yrs
- Wildfire 1/10 Low
- Heat 5/10 Major 7 d/yr ≥103°F today · 20 d/yr by 30 yrs out
- Wind 2/10 Low 3% chance of damaging wind over 30 yrs
- Air quality 3/10 Moderate 2 unhealthy d/yr today · 5 by 30 yrs out
Nearby sold comps map
Loading sold comps map…
Walkable amenities ~0.75 mi
Loading nearby amenities…
Taxation est. · year 1
- Rental income
- $21,153
- − Mortgage interest
- −$11,763
- − Property taxes
- −$2,208
- − Insurance
- −$1,050
- − Repairs & maintenance
- −$1,692
- − Management
- −$1,692
- − Depreciation
- −$6,109
- Taxable loss
- −$3,362
- Est. tax savings @ 24.0%
- +$807
- After-tax cash flow
- $1,044/yr
For passive investors: Depreciation is non-cash, so a rental often shows a tax loss while cash-flowing — sheltering income. Rental losses are passive: they offset passive income freely, and up to $25,000/yr can offset ordinary (W-2) income if you actively participate and your MAGI is under $100k (phasing out to $0 by $150k); unused losses carry forward. On sale, claimed depreciation is recaptured at up to 25%, and gains may owe capital-gains tax (a 1031 exchange can defer both). Figures are a year-1 estimate at your 24.0% rate — not tax advice; consult a CPA.
Schools (NCES district)
- District
- Jefferson County
- NCES district ID
- 2102990
- Math proficiency
- 19% ▼ -17.00%
- Reading proficiency
- 35% ▼ -11.00%
- Median HH income
- $47,885
- Composite
- 23.45/100
- National rank
- #7884
- State rank
- #121 of 165 in KY
Livability — Jeffersontown
- Score
- 81/100
- State rank
- #68
- US rank
- #1520
Category grades
Schools grade is shown separately in the Schools card above.
Census & demographics
- Census place
- Jeffersontown, KY
- County
- Jefferson County · 790,184 people
- Metro
- Louisville/Jefferson County, KY-IN
- Population (ZIP)
- 42,207
- Household income
- $89,440
- Rent vs Own
- Severe rent burden
- 887.0
Population outlook (Jefferson County) Hauer SSP2
- Today (2025)
- 823,112 people
- By 2030
- 849,343 · +3.2%
- By 2040
- 895,696 · +8.8%
- By 2050
- 933,630 · +13.4%
- By 2075
- 1,028,262 · +24.9%
- By 2100
- 1,072,675 · +30.3%
Race, ethnicity, and origin ACS 2023
- Neighborhood character
- Predominantly White (79%)
- Race & ethnicity
- White 79% Black 11% Two or more races 6% Hispanic / Latino 5% Asian 2%
- Common ancestry
- Romanian 2% Slovak 2% Italian 2%
- Foreign-born
- 7% · Canada, China, India
- Languages at home
- 91% English-only · Spanish 3% Other Indo-European 2% Russian/Polish/Slavic 1%
Political lean MEDSL · Jefferson
- 2024 margin
- D (+16.6) · D 57.4% · R 40.9% · Other 1.7%
- 2008→2024 swing
- +4.5pp toward D · 2008: 12.0pp · 2024: 16.6pp
- All cycles
- 2024: D+16.6 2020: D+20.1 2016: D+13.3 2012: D+11.1 2008: D+12.0
Not yet ingested
- Civics
- —
Market trends
- HPI YoY
- ▼ -259.19%
- Current HPI
- 220.9191
- Rent YoY
- ▲ 4.34%
- Metro
- Louisville/Jefferson County, KY-IN
- State GDP YoY
- ▲ 1.81%
- F500 in state
- 4
Industry mix (Fortune 500 HQ in KY)
| Industry | F500 HQs | Revenue |
|---|---|---|
| Healthcare | 1 | $118B |
|
||
| Food / Beverage | 1 | $7B |
|
||
Price history
3 events — show timeline
- 2026-05-19 Pending — Metro Search MLS
- 2026-05-04 Contingent — Metro Search MLS
- 2026-04-29 Listed $210,000 Metro Search MLS
Property tax history
+5.7%/yrLatest (2025): $2,208 · +0.5% YoY. Source: county tax records.
Cash-flow waterfall
monthlySold comps — $/sqft
last 12 mo · ≤1 miLoading sold comps…