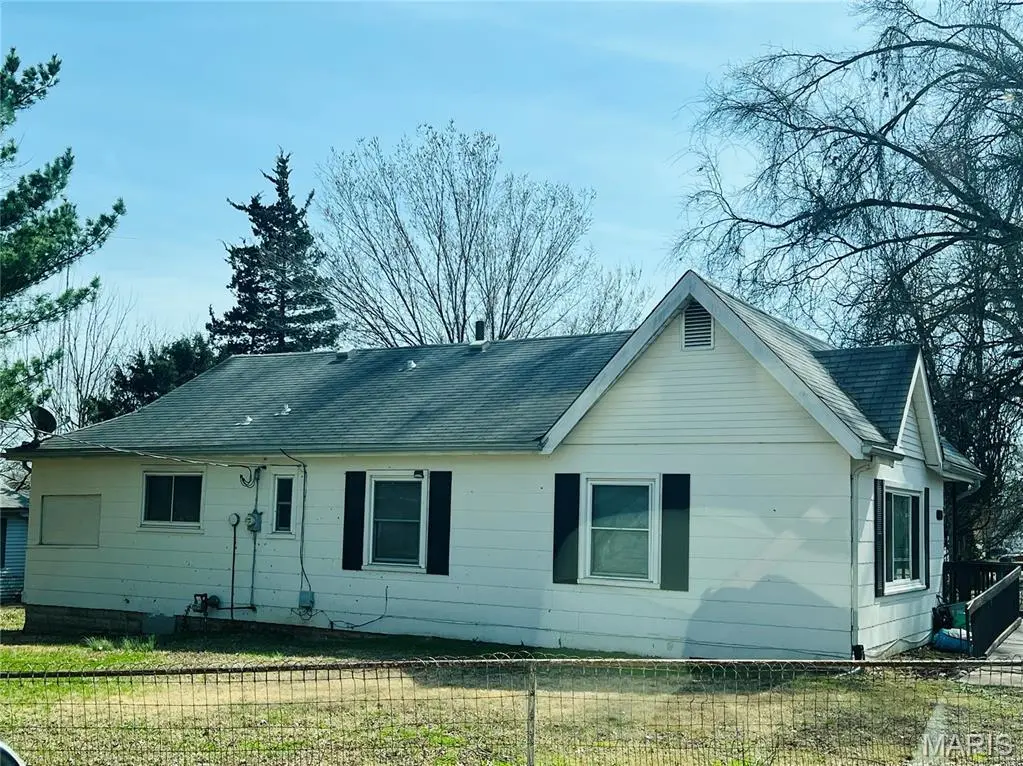
9758 Diamond Dr · Riverview, MO
Flood risk 1/10 · Minimal
- FEMA flood zone
- X (unshaded)
- Chance of flooding over 30 yrs
- 0.0%
- Est. flood insurance / yr
- $473 – $860
Fire risk 1/10 · Minimal
- Est. fire insurance / yr
- $1,054 – $1,958
Heat risk 5/10 · Moderate
- Hot days now (above 107°F)
- 7 days/yr
- Hot days in 30 yrs
- 21 days/yr
Wind risk 2/10 · Minimal
- Chance of severe wind over 30 yrs
- 1.0%
Air-quality risk 4/10 · Minor
- Unhealthy air days now
- 5 days/yr
- Unhealthy air days in 30 yrs
- 6 days/yr
Risk factors via First Street. Map © Google.
Why this score? — see what drove the C+ grade
The composite is a weighted blend of 9 inputs, each scored 0–100. Each bar is that input's sub-score; the figure is the points it added to the 100-point composite (weight × sub-score).
- Cash flow +27.7/30.0
- DSCR +9.8/10.0
- ARV discount +7.5/15.0
- 1% rule +7.1/10.0
- Rent growth +4.1/5.0
- Livability +2.9/5.0
- Condition / age +2.5/5.0
- Schools +0.4/10.0
- Appreciation +0.0/10.0
$110,000
🖨 Deal sheet (PDF) 📄 Offer letter ✓ Due diligence
Listing remarks MLS
Cash-flow opportunity with tenant in place! This 2-bedroom, 1-bath investment property is currently rented at $1,200/month, offering immediate income from day one. Property features a functional layout, off-street parking, and strong rental demand in the area. Ideal for investors looking to add to their portfolio or value-add buyers seeking to optimize performance over time. Tenant is in place—do not disturb. Showings with accepted contract or by appointment only.
Key facts
- Strong rental demand
- Functional layout
- Off-street parking
Tags
Neighborhood map
What this means for you Summary
Snapshot
- This is a 3-bed/1.0-bath single-family listed at $110k.
Deal economics
- At list price, monthly cash flow is $333 ($4k/yr) — positive.
- The deal already cash-flows at list — no discount required.
- Meets the 1% rule at list price ($1k rent vs $110k).
- Recommended offer: $103k (6.0% below list) — sets the bar for market timing.
- Cap rate 9.9% vs local median 13.2% in Riverview — below-typical yield; the buyer is paying a premium for something (appreciation thesis, condition, location) that the cap rate doesn't capture.
Location & tenants
- Location reads 58/100 on livability (#579 in MO) — a working-class tenant base; expect higher turnover. Strengths: cost of living A+, housing A+; Watch: employment D+, schools F, crime F.
- Riverview Gardens (suburban): math 2% / reading 9% proficiency, ranked #324 of 324 in MO (top 100%) — low school quality limits family demand, transient renter base, plan for 1-2y turnover; 90% free/reduced lunch — lower-income household profile, screen leases tightly.
- Market conditions: Rents rising fast (+6.6%/yr); 203 active listings in the ZIP; 40 comparable units currently listed for rent nearby; rentals at typical pace (median 25d on market — plan ~3-4 weeks tenant-placement turnaround); 40% of comp listings sitting > 30 days — soft ceiling on asking rent; lower-income renter base — watch delinquency; 920 units permitted in St. Louis County in 2024 (250 in 5+ unit buildings).
- This rent runs 37% of the median local income ($43k/yr) — at the standard rent-burdened threshold; future hikes will face affordability resistance.
Forward outlook
- Local home prices are declining (-3.0%/yr); year-one equity from $761 of loan paydown is wiped out by about $3k of value loss. Plan a longer hold.
- At projected returns (-3.0% appreciation + 6.6% rent growth), your $31k cash investment doubles in ~7 years — after that, you're playing with house money.
Negotiation context
- It's been on market 79 days — a 6% lower offer ($103k) is reasonable based on typical stale-listing flexibility.
- 5 sale attempts since 2y ago with the ask held roughly flat each time — persistent listings suggest the price (not the market) is what's stuck; bring a comps-based counter.
- Current owner paid $4k; list at $110k implies a 2344% gain — meaningful room to come down on a strong offer.
Risks & watch-outs
- Watch-outs: built in 1921 — expect roof / HVAC / electrical / plumbing capex.
- Climate carrying-cost: extreme-heat days projected 7→21/yr by 2055 (HVAC capex compounding) — expect insurance premiums to compound above CPI over the hold.
Questions for the listing agent
- It's been on market 79 days. Have you received any prior offers? Is the seller open to a 6% concession, seller financing, or rate buy-down credit?
- Built in 1921 — when were the roof, HVAC, electrical panel, plumbing, and water heater last replaced?
- Why hasn't it sold? Are there any deal-killer items the seller is aware of (foundation, flood, title, zoning, code violations)?
- Is there a deadline driving the sale (1031 exchange, divorce, estate, relocation)? That informs how much negotiation room exists.
- Schools are F-rated, which usually means shorter tenancies and higher turnover. Who's the typical renter profile here, and what's been the actual vacancy rate?
- Crime grade is F in this area — have there been break-ins, vandalism, or insurance claims at this property in the last 3 years? What carrier currently insures it and at what premium?
- What's the average days-on-market for RENTAL listings here right now (not sales)? A rising rental-DOM trend means longer vacancies and softer asking-rent achievability than the comps imply.
- What's the recent tenant-quality profile in this submarket — average credit score on applications, eviction rate, late-payment / NSF rate, and stable-employment percentage? A property-management company in the area should have these aggregated.
- How much new for-sale + rental construction is in the pipeline within 1–3 miles? Heavy new supply typically softens prices + rents 12–24 months out; constrained supply supports both.
Investment metrics
- 1% rule
- 1.21% ✓
- Cap rate
- 9.92%
- Cash-on-cash
- 12.96%
- DSCR
- 1.58
- GRM
- 6.9
CMA / ARV
- ARV (median comp)
- $61,675
- List price
- $110,000
- Delta
- 78.35%
- Verdict
- OVERPRICED
- Comps
- 20 within 1.0 mi
Show comp detail 12 sales within ~0.75 mi
| Address | Dist | Beds/Ba | Sqft | Sold | Price | $/sf | Match |
|---|---|---|---|---|---|---|---|
| 9846 Lilac Dr | 0.25mi | 3/1.0 | 1,116 (+0%) | 4mo | $55,000 | $49 | 84 |
| 343 Midridge Dr | 0.08mi | 3/1.5 | 1,058 (-5%) | 5mo | $52,000 | $49 | 82 |
| 435 Adrian Dr | 0.23mi | 3/2.0 | 1,100 (-1%) | 4mo | $45,000 | $41 | 81 |
| 356 Scenic Dr | 0.13mi | 4/2.0 (+1) | 1,252 (+13%) | 0mo | $39,900 | $32 | 64 |
| 10060 Valley Dr | 0.43mi | 2/1.0 (-1) | 1,056 (-5%) | 4mo | $59,900 | $57 | 63 |
| 122 Coburg Dr | 0.54mi | 3/1.5 | 1,188 (+7%) | 0mo | $10,000 | $8 | 61 |
| 9920 Diamond Dr | 0.24mi | 2/1.0 (-1) | 1,273 (+15%) | 3mo | $33,352 | $26 | 57 |
| 614 Ludlow Dr | 0.41mi | 3/1.0 | 960 (-14%) | 5mo | $109,900 | $114 | 54 |
| 10071 Diamond Dr | 0.48mi | 2/1.0 (-1) | 1,008 (-9%) | 5mo | $64,900 | $64 | 53 |
| 534 Alcove Ave | 0.61mi | 3/1.0 | 996 (-10%) | 3mo | $104,200 | $105 | 52 |
| 700 Chambers Rd | 0.57mi | 3/1.0 | 960 (-14%) | 5mo | $114,500 | $119 | 47 |
| 448 Lancashire Rd | 0.75mi | 3/1.0 | 1,234 (+11%) | 4mo | $149,000 | $121 | 43 |
Match score weights: distance 35% · size 25% · config 20% · recency 20%. Top-matched comps best support the ARV.
Projected returns pro-forma
-3.0% appreciation · 6.59% rent growth · sell at horizon
- IRR
- 6.7%
- Equity multiple
- 1.27×
- Total profit
- $8,326
- Equity at exit
- $16,401
- IRR
- 18.9%
- Equity multiple
- 2.83×
- Total profit
- $56,451
- Equity at exit
- $9,511
Cash invested: $30,800 (down + closing). Projections, not guarantees.
Landlord ↔ Tenant lean methodology
- Overall (STATE)
- 81 Strongly Landlord-Friendly
- State Missouri
- 81 Strongly Landlord-Friendly · R+10
- County
- — inherits STATE
- City
- — inherits STATE
ZIP-level market 63137
- Rents YoY
- 6.6%
- Active inventory
- 203
- Price-to-rent
- 6.9×
Monthly cashflow live
- Estimated rent
- $1,327 high interval (Pro) →
- Mortgage (P&I)
- −$577
- Tax from tax record
- −$93 /mo · $1,115/yr
- Insurance
- −$46
- HOA
- −$0
- Vacancy / Maint / Mgmt
- −$279
- Net cashflow
- $333
Break-even live
Sensitivity live
| Price | -10% $395 | -5% $364 | +0% $333 | +5% $302 | +10% $270 |
|---|---|---|---|---|---|
| Rent | -10% $228 | -5% $280 | +0% $333 | +5% $385 | +10% $438 |
| Rate | -1.0pp $388 | -0.5pp $361 | base $333 | +0.5pp $304 | +1.0pp $275 |
UW: 25.0% down · 7.5% · 30yr · 1.5% tax · 5.0% vac · 8.0% maint · 8.0% mgmt
Financing live
Cash to close
- Down payment
- $27,500
- Closing costs
- $3,300
- Reserves months
- —
- Total cash needed
- —
Loan-product check · same deal, 3 products live
Conventional
25% down · 7.5% · 30yr
- Down + closing
- —
- Monthly P&I
- —
- Monthly cashflow
- —
- DSCR
- —
- Eligible?
- —
Personal DTI + credit; lowest rate.
DSCR
20% down · 8.5% · 30yr
- Down + closing
- —
- Monthly P&I
- —
- Monthly cashflow
- —
- DSCR
- —
- Eligible?
- —
No personal income docs; deal must DSCR.
Hard money
10% down · 12.0% · 12mo
- Down + closing
- —
- Monthly P&I
- —
- Monthly cashflow
- —
- DSCR
- —
- Eligible?
- —
Short-term bridge; refi at stabilization.
Rent comps 40 comps
| Address | Beds | Baths | Sqft | Rent | $/sqft | DOM | Units | Dist |
|---|---|---|---|---|---|---|---|---|
| 344 Midridge Dr Saint Louis, MO | 2.0 | 1.0 | 810 | $1,053 | $1.30 | 44d | 1 | 0.05mi |
| 9746 Diamond Dr Saint Louis, MO | 3.0 | 2.0 | 910 | $1,275 | $1.40 | 44d | 1 | 0.05mi |
| 460 Bluff Dr Saint Louis, MO | 3.0 | 1.0 | 1002 | $1,300 | $1.30 | 44d | 1 | 0.25mi |
| 371 Adrian Dr Saint Louis, MO | 2.0 | 1.0 | 1337 | $1,200 | $0.90 | 44d | 1 | 0.25mi |
| 435 Adrian Dr Saint Louis, MO | 3.0 | 1.0 | 1100 | $950 | $0.86 | 21d | 1 | 0.26mi |
| 9640 Diamond Dr Saint Louis, MO | 1.0–2.0 | 1.0 | 625 | $800 | $1.28 | 15d | 3 | 0.28mi |
| 255 Chambers Rd St. Louis, MO | 2.0 | 1.0 | 700 | $850 | $1.21 | 44d | 1 | 0.29mi |
| 9811 Lilac Dr Unit I St. Louis, MO | 2.0 | 1.0 | 705 | $799 | $1.13 | 44d | 1 | 0.33mi |
| 9943 Lilac Dr Saint Louis, MO | 2.0 | 1.0 | 1086 | $1,000 | $0.92 | 44d | 1 | 0.36mi |
| 9924 Gloucester Dr Saint Louis, MO | 3.0 | 2.0 | 992 | $1,565 | $1.58 | 11d | 1 | 0.36mi |
| 10019 Northgate Dr Saint Louis, MO | 3.0 | 1.0 | 991 | $1,150 | $1.16 | 22d | 1 | 0.37mi |
| 10052 Diamond Dr Saint Louis, MO | 4.0 | 1.0 | 1181 | $1,495 | $1.27 | 13d | 1 | 0.43mi |
| 10063 Northgate Dr Saint Louis, MO | 2.0 | 1.0 | 1054 | $1,200 | $1.14 | 44d | 1 | 0.46mi |
| 623 Ludlow Dr Saint Louis, MO | 2.0 | 1.0 | 840 | $1,199 | $1.43 | 24d | 1 | 0.46mi |
| 637 Karess Dr Saint Louis, MO | 2.0 | 2.0 | 1190 | $1,525 | $1.28 | 13d | 1 | 0.46mi |
| 10052 Lilac Ave Saint Louis, MO | 3.0 | 1.5 | 1143 | $1,100 | $0.96 | 8d | 1 | 0.51mi |
| 10201 Gourock Dr Saint Louis, MO | 3.0 | 1.0 | 886 | $1,275 | $1.44 | 44d | 1 | 0.55mi |
| 10213 Durness Dr Saint Louis, MO | 2.0 | 1.0 | 932 | $1,225 | $1.31 | 44d | 1 | 0.56mi |
| 10327 Renfrew Dr Saint Louis, MO | 3.0 | 1.0 | 844 | $1,199 | $1.42 | 44d | 1 | 0.58mi |
| 416 Crawford Rd Saint Louis, MO | 3.0 | 1.0 | 844 | $1,499 | $1.78 | 24d | 1 | 0.58mi |
| 10309 Galloway Dr Saint Louis, MO | 3.0 | 1.0 | 892 | $1,295 | $1.45 | 13d | 1 | 0.59mi |
| 10066 Dorothy Ave Saint Louis, MO | 2.0 | 1.0 | 916 | $1,225 | $1.34 | 22d | 1 | 0.61mi |
| 317 Cameron Rd Saint Louis, MO | 3.0 | 1.0 | 854 | $1,350 | $1.58 | 24d | 1 | 0.70mi |
| 325 Caithness Rd Saint Louis, MO | 3.0 | 1.0 | 854 | $1,425 | $1.67 | 13d | 1 | 0.71mi |
| 325 Caithness Rd Saint Louis, MO | 3.0 | 1.0 | 854 | $1,540 | $1.80 | 44d | 1 | 0.71mi |
| 10401 Hobkirk Dr Saint Louis, MO | 3.0 | 1.0 | 1050 | $1,500 | $1.43 | 18d | 1 | 0.72mi |
| 308 Lanark Rd Saint Louis, MO | 3.0 | 1.0 | 1154 | $1,400 | $1.21 | 24d | 1 | 0.76mi |
| 437 Lancashire Rd Saint Louis, MO | 3.0 | 1.0 | 1082 | $1,395 | $1.29 | 44d | 1 | 0.76mi |
| 9517 West Ave Unit 1F St. Louis, MO | 3.0 | 1.0 | 1300 | $1,300 | $1.00 | 44d | 1 | 0.77mi |
| 400 Lancashire Rd Saint Louis, MO | 3.0 | 1.0 | 1200 | $1,095 | $0.91 | 44d | 1 | 0.77mi |
| 305 Lancashire Rd Saint Louis, MO | 3.0 | 1.0 | 854 | $1,100 | $1.29 | 18d | 1 | 0.79mi |
| 232 Cameron Rd Saint Louis, MO | 3.0 | 1.0 | 984 | $1,295 | $1.32 | 13d | 1 | 0.80mi |
| 432 Midlothian Rd Saint Louis, MO | 3.0 | 1.0 | 1120 | $1,350 | $1.21 | 11d | 1 | 0.82mi |
| 312 Banff Cir Saint Louis, MO | 3.0 | 1.0 | 854 | $1,175 | $1.38 | 24d | 1 | 0.84mi |
| 10432 Balmoral Dr Saint Louis, MO | 4.0 | 1.0 | 826 | $1,600 | $1.94 | 2d | 1 | 0.88mi |
| 743 Shepley Dr Saint Louis, MO | 3.0 | 1.0 | 932 | $1,025 | $1.10 | 8d | 1 | 0.88mi |
| 457 Shepley Dr Saint Louis, MO | 3.0 | 1.0 | 854 | $1,350 | $1.58 | 24d | 1 | 0.89mi |
| 329 Midlothian Rd Saint Louis, MO | 3.0 | 1.0 | 854 | $1,195 | $1.40 | 4d | 1 | 0.91mi |
| 10519 Renfrew Dr Saint Louis, MO | 3.0 | 1.5 | 982 | $1,399 | $1.42 | 44d | 1 | 0.92mi |
| 204 Tay Rd Saint Louis, MO | 4.0 | 1.5 | 854 | $1,500 | $1.76 | 18d | 1 | 0.92mi |
Listing history 27 events
-
2026-06-21days on market $110,000 Active 79 DOM
-
2026-06-18days on market $110,000 Active 76 DOM
-
2026-06-17days on market $110,000 Active 75 DOM
-
2026-06-16days on market $110,000 Active 74 DOM
-
2026-06-15days on market $110,000 Active 73 DOM
-
2026-06-13days on market $110,000 Active 71 DOM
-
2026-06-13days on market $110,000 Active 70 DOM
-
2026-06-09days on market $110,000 Active 67 DOM
-
2026-06-08days on market $110,000 Active 66 DOM
-
2026-06-07days on market $110,000 Active 65 DOM
-
2026-06-05days on market $110,000 Active 62 DOM
-
2026-06-03days on market $110,000 Active 61 DOM
-
2026-06-02days on market $110,000 Active 60 DOM
-
2026-06-01days on market $110,000 Active 59 DOM
-
2026-05-31days on market $110,000 Active 58 DOM
-
2026-04-03$110,000 Active 474-char remark
Show marketing remark (474 chars)
Cash-flow opportunity with tenant in place! This 2-bedroom, 1-bath investment property is currently rented at $1,200/month, offering immediate income from day one. Property features a functional layout, off-street parking, and strong rental demand in the area. Ideal for investors looking to add to their portfolio or value-add buyers seeking to optimize performance over time. Tenant is in place—do not disturb. Showings with accepted contract or by appointment only.
-
2025-12-29status Active
-
2025-09-23price $105,000
-
2025-06-23$110,000 Active
-
2024-07-08soldstatus Closed
-
2024-05-29status Pending
-
2024-05-29$100,000 Active
-
2024-04-06historical
-
2024-04-05$105,000 Active
-
2017-11-13soldstatus $4,500
-
1996-11-12soldstatus
-
1990-04-01soldstatus $35,000
ⓘ Source: listings_history table (triggers on properties + properties_extension) + one-shot
backfill from property_details.listing_events for pre-trigger history.
Tax reassessment forecast MO · Resets to sale price
- Current annual tax
- $1,115 · $93/mo
- Projected year-2 tax
- $1,115 · $93/mo
- Expected delta
- $0/yr ($0/mo · 0.0%)
ⓘ Screening estimate from a state-policy table — verify with the county assessor before closing.
Climate risk First Street
- Flood 1/10 Low FEMA zone X (unshaded) · 0% chance over 30 yrs
- Wildfire 1/10 Low
- Heat 5/10 Major 7 d/yr ≥107°F today · 21 d/yr by 30 yrs out
- Wind 2/10 Low 100% chance of damaging wind over 30 yrs
- Air quality 4/10 Moderate 5 unhealthy d/yr today · 6 by 30 yrs out
Nearby sold comps map
Loading sold comps map…
Walkable amenities ~0.75 mi
Loading nearby amenities…
Taxation est. · year 1
- Rental income
- $15,925
- − Mortgage interest
- −$6,162
- − Property taxes
- −$1,115
- − Insurance
- −$550
- − Repairs & maintenance
- −$1,274
- − Management
- −$1,274
- − Depreciation
- −$3,200
- Taxable income
- $2,350
- Est. tax owed @ 24.0%
- −$564
- After-tax cash flow
- $3,429/yr
For passive investors: Depreciation is non-cash, so a rental often shows a tax loss while cash-flowing — sheltering income. Rental losses are passive: they offset passive income freely, and up to $25,000/yr can offset ordinary (W-2) income if you actively participate and your MAGI is under $100k (phasing out to $0 by $150k); unused losses carry forward. On sale, claimed depreciation is recaptured at up to 25%, and gains may owe capital-gains tax (a 1031 exchange can defer both). Figures are a year-1 estimate at your 24.0% rate — not tax advice; consult a CPA.
Schools (NCES district)
- District
- Riverview Gardens
- NCES district ID
- 2926670
- Math proficiency
- 2% ▼ -6.00%
- Reading proficiency
- 9% ▼ -6.00%
- Median HH income
- $32,759
- Composite
- 4.22/100
- National rank
- #10058
- State rank
- #324 of 324 in MO
Livability — Riverview
- Score
- 58/100
- State rank
- #579
- US rank
- #20673
Category grades
Schools grade is shown separately in the Schools card above.
Census & demographics
- Census place
- Riverview, MO
- County
- Saint Louis County · 888,823 people
- City population
- 19,690
- Metro
- St. Louis, MO-IL
- Population (ZIP)
- 19,684
- Household income
- $43,422
- Rent vs Own
- Severe rent burden
- 1863.0
Population outlook (St. Louis County) Hauer SSP2
- Today (2025)
- 1,025,227 people
- By 2030
- 1,028,023 · +0.3%
- By 2040
- 1,020,940 · -0.4%
- By 2050
- 1,007,280 · -1.8%
- By 2075
- 987,277 · -3.7%
- By 2100
- 921,984 · -10.1%
Race, ethnicity, and origin ACS 2023
- Neighborhood character
- Predominantly Black (82%)
- Race & ethnicity
- Black 82% White 13% Two or more races 3%
- Common ancestry
- Romanian 1% Lithuanian 1% Italian 1%
- Foreign-born
- 1%
Political lean MEDSL · St. Louis
- 2024 margin
- Strong D (+23.4) · D 60.8% · R 37.4% · Other 1.7%
- 2008→2024 swing
- +3.5pp toward D · 2008: 19.9pp · 2024: 23.4pp
- All cycles
- 2024: D+23.4 2020: D+24.0 2016: D+16.2 2012: D+13.7 2008: D+19.9
Not yet ingested
- Civics
- —
Market trends
- HPI YoY
- ▼ -96.70%
- Current HPI
- 130.6765
- Rent YoY
- ▲ 6.59%
- Metro
- St. Louis, MO-IL
- State GDP YoY
- ▲ 1.84%
- F500 in state
- 20
Industry mix (Fortune 500 HQ in MO)
| Industry | F500 HQs | Revenue |
|---|---|---|
| Healthcare | 1 | $163B |
|
||
| Insurance | 1 | $21B |
|
||
| Industrial Technology | 1 | $17B |
|
||
| Retail | 1 | $16B |
|
||
| Industrial Distribution | 1 | $10B |
|
||
| Utilities | 1 | $9B |
|
||
Price history
+214.3% since first listed12 events — show timeline
- 2026-04-03 Listed $110,000 MARIS as Distributed by MLS Grid
- 2025-12-29 Relisted — MARIS as Distributed by MLS Grid
- 2025-09-23 Price Changed $105,000 MARIS as Distributed by MLS Grid
- 2025-06-23 Listed $110,000 MARIS as Distributed by MLS Grid
- 2024-07-08 Sold (MLS) — MARIS as Distributed by MLS Grid
- 2024-05-29 Pending — MARIS as Distributed by MLS Grid
- 2024-05-29 Listed $100,000 MARIS as Distributed by MLS Grid
- 2024-04-06 Delisted — MARIS as Distributed by MLS Grid
- 2024-04-05 Listed $105,000 MARIS as Distributed by MLS Grid
- 2017-11-13 Sold (Public Records) $4,500 Public Records
- 1996-11-12 Sold (Public Records) — Public Records
- 1990-04-01 Sold (Public Records) $35,000 Public Records
Property tax history
+2.9%/yrLatest (2022): $1,115 · +1.0% YoY. Source: county tax records.
Cash-flow waterfall
monthlySold comps — $/sqft
last 12 mo · ≤1 miLoading sold comps…