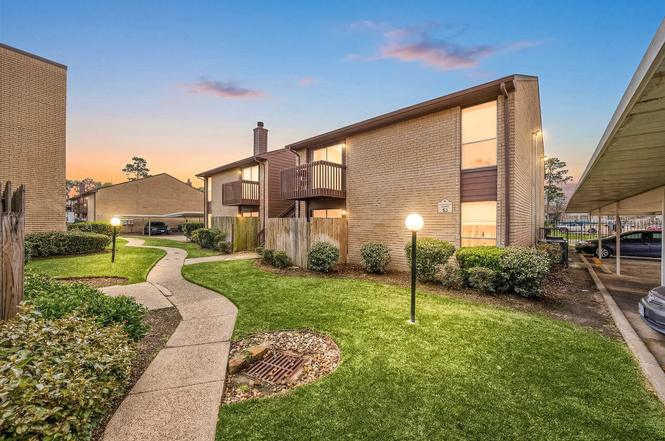
12905 Woodforest Blvd #406 · Houston, TX
Flood risk 1/10 · Minimal
- FEMA flood zone
- X (unshaded)
- Chance of flooding over 30 yrs
- 0.0%
- Est. flood insurance / yr
- $507 – $1,088
Fire risk 1/10 · Minimal
- Est. fire insurance / yr
- $1,222 – $2,270
Heat risk 10/10 · Severe
- Hot days now (above 109°F)
- 7 days/yr
- Hot days in 30 yrs
- 26 days/yr
Wind risk 9/10 · Severe
- Chance of severe wind over 30 yrs
- 99.0%
Air-quality risk 2/10 · Minimal
- Unhealthy air days now
- 2 days/yr
- Unhealthy air days in 30 yrs
- 2 days/yr
Risk factors via First Street. Map © Google.
Why this score? — see what drove the C- grade
The composite is a weighted blend of 9 inputs, each scored 0–100. Each bar is that input's sub-score; the figure is the points it added to the 100-point composite (weight × sub-score).
- Cash flow +19.4/30.0
- 1% rule +10.0/10.0
- ARV discount +7.5/15.0
- DSCR +6.1/10.0
- Livability +3.7/5.0
- Schools +2.8/10.0
- Condition / age +2.5/5.0
- Rent growth +2.3/5.0
- Appreciation +0.0/10.0
$57,000
🖨 Deal sheet 📄 Offer letter ✓ Due diligence
Listing remarks
Discover a bright, move-in ready Houston condo with fresh paint, modern flooring, updated countertops, and new insulation, plus a winterized A/C for year-round comfort. Designed for low-maintenance living in a quiet, secure community, this home makes everyday life effortless. Enjoy easy access to shopping, dining, and entertainment, with Beltway?8, I-10, and 610 nearby for fast commutes downtown or to Pasadena in under 15 minutes. Relax in a welcoming, comfortable space where convenience meets style, all in a clean, safe neighborhood. Perfect for buyers seeking a hassle-free home with modern upgrades and a prime location in one of Houston’s most accessible areas.
Key facts
- Modern flooring
- Updated countertops
- Secure community
Tags
Property features AI
Finance
- Other: Association fee amount reported monthly
- HOA & community: Prestige Management HOA; Monthly HOA fee; HOA covers common areas, water, sewer and trash
Exterior
- Parking: Carport; Additional parking
- Security: Guarded community
- Utilities: Public water; Public sewer
- Home design: Residential property; Single-story
- Construction: Built in 1982; Brick and cement siding exterior; Slab foundation
- Exterior features: Composition roof; Large lot (lot area reported); Community pool
Interior
- Kitchen: Electric cooktop; Electric oven; Microwave; Dishwasher; Breakfast bar; Pantry
- Bedrooms: Primary bedroom on the first floor (13 x 14)
- Flooring: Plank flooring; Tile; Vinyl
- Bathrooms: 1 full bathroom
- Heating & cooling: Central heating (electric); Central air conditioning (electric)
- Interior features: Breakfast bar; Pantry; Tub with shower; Ceiling fan(s); Kitchen/dining combo; One fireplace; Total of 4 rooms
- Laundry & utility: Washer and dryer included; Laundry in utility room; Electric dryer hookup
Neighborhood map
What this means for you Summary
Snapshot
- This is a 1-bed/1.0-bath condo listed at $57k.
Deal economics
- At list price, monthly cash flow is $64 ($765/yr) — positive.
- The deal already cash-flows at list — no discount required.
- Meets the 1% rule at list price ($1k rent vs $57k).
- Recommended offer: $55k (3.0% below list) — sets the bar for market timing.
- Cap rate 7.6% vs local median 3.2% in Houston — top-decile yield for the area; either an underpriced asset or a hidden risk that comps aren't pricing in. Stress-test before assuming the spread holds.
Location & tenants
- Location reads 74/100 on livability (#184 in TX, #4,771 nationally) — a middle-class / working-renter tenant base. Strengths: amenities A+, cost of living A+, housing A+; Watch: crime F.
- Galena Park ISD (suburban): math 32% / reading 33% proficiency, ranked #578 of 826 in TX (top 70%) — families likely to look elsewhere, expect single-tenant / working-renter base with shorter leases; 74% free/reduced lunch — lower-income household profile, screen leases tightly.
- Zoned schools: Normandy Crossing El (math 30% / reading 28%, grade F, #2,668 of 4,322 statewide, top 63%, 660 students, 90% FRL); Cunningham Middle (math 29% / reading 35%, grade F, #971 of 1,662 statewide, top 60%, 928 students, 89% FRL); North Shore Senior High (math 35% / reading 40%, grade F, #888 of 1,632 statewide, top 55%, 4,569 students, 86% FRL).
- Market conditions: Rents soft (-0.8%/yr); 162 active listings in the ZIP; 40 comparable units currently listed for rent nearby; rentals leasing fast (median 13d on market — plan ~1-2 weeks tenant-placement turnaround); 29,883 units permitted in Harris County in 2024 (8,621 in 5+ unit buildings).
Forward outlook
- Local home prices are declining (-3.0%/yr); year-one equity from $394 of loan paydown is wiped out by about $2k of value loss. Plan a longer hold.
- Harris County population projected at +47% by 2050 — long-run rental-demand tailwind backs the buy-and-hold thesis.
Negotiation context
- It's been on market 59 days — a 3% lower offer ($55k) is reasonable based on typical stale-listing flexibility.
- 9 sale attempts since 13y ago with the ask held roughly flat each time — persistent listings suggest the price (not the market) is what's stuck; bring a comps-based counter.
Risks & watch-outs
- Watch-outs: HOA is 30% of rent.
- Climate carrying-cost: severe wind risk, 99% chance of damaging wind over 30y; extreme-heat days projected 7→26/yr by 2055 (HVAC capex compounding) — expect insurance premiums to compound above CPI over the hold.
Questions for the listing agent
- It's been on market 59 days. Have you received any prior offers? Is the seller open to a 3% concession, seller financing, or rate buy-down credit?
- What does the HOA fee cover, when was the last increase, and are there any pending special assessments or reserve-fund shortfalls?
- Any open or pending special assessments — roof, HVAC, plumbing, elevator, façade? What's the per-unit balance and payoff schedule, and is the seller paying it off at close or rolling it to the buyer?
- Is there a deadline driving the sale (1031 exchange, divorce, estate, relocation)? That informs how much negotiation room exists.
- Schools are D-rated, which usually means shorter tenancies and higher turnover. Who's the typical renter profile here, and what's been the actual vacancy rate?
- Crime grade is F in this area — have there been break-ins, vandalism, or insurance claims at this property in the last 3 years? What carrier currently insures it and at what premium?
- What's the average days-on-market for RENTAL listings here right now (not sales)? A rising rental-DOM trend means longer vacancies and softer asking-rent achievability than the comps imply.
- What's the recent tenant-quality profile in this submarket — average credit score on applications, eviction rate, late-payment / NSF rate, and stable-employment percentage? A property-management company in the area should have these aggregated.
- How much new apartment / multifamily construction is in the pipeline within 1–3 miles? Heavy new supply (>2% of stock underway) typically softens rents 12–24 months out; light construction supports rent growth.
Investment metrics
- 1% rule
- 1.82% ✓
- Cap rate
- 7.64%
- Cash-on-cash
- 4.79%
- DSCR
- 1.21
- GRM
- 4.6
CMA / ARV
No comps found within radius.
Projected returns pro-forma
-3.0% appreciation · 0.0% rent growth · sell at horizon
- IRR
- -14.7%
- Equity multiple
- 0.50×
- Total profit
- $-7,973
- Equity at exit
- $8,499
- IRR
- -19.9%
- Equity multiple
- 0.22×
- Total profit
- $-12,476
- Equity at exit
- $4,928
Cash invested: $15,960 (down + closing). Projections, not guarantees.
Landlord ↔ Tenant lean methodology
- Overall (STATE)
- 87 Strongly Landlord-Friendly
- State Texas
- 87 Strongly Landlord-Friendly · R+5
- County
- — inherits STATE
- City
- — inherits STATE
ZIP-level market 77015
- Home prices YoY
- -10.8%
- Rents YoY
- -0.8%
- Active inventory
- 162
- Price-to-rent
- 4.6×
Monthly cashflow live
- Estimated rent
- $1,035 high interval (Pro) →
- Mortgage (P&I)
- −$299
- Tax from tax record
- −$116 /mo · $1,397/yr
- Insurance
- −$24
- HOA
- −$315
- Vacancy / Maint / Mgmt
- −$217
- Net cashflow
- $64
Break-even live
UW: 25.0% down · 7.5% · 30yr · 1.5% tax · 5.0% vac · 8.0% maint · 8.0% mgmt
Financing live
Cash to close
- Down payment
- $14,250
- Closing costs
- $1,710
- Reserves months
- —
- Total cash needed
- —
Loan-product check · same deal, 3 products live
Conventional
25% down · 7.5% · 30yr
- Down + closing
- —
- Monthly P&I
- —
- Monthly cashflow
- —
- DSCR
- —
- Eligible?
- —
Personal DTI + credit; lowest rate.
DSCR
20% down · 8.5% · 30yr
- Down + closing
- —
- Monthly P&I
- —
- Monthly cashflow
- —
- DSCR
- —
- Eligible?
- —
No personal income docs; deal must DSCR.
Hard money
10% down · 12.0% · 12mo
- Down + closing
- —
- Monthly P&I
- —
- Monthly cashflow
- —
- DSCR
- —
- Eligible?
- —
Short-term bridge; refi at stabilization.
Rent comps 40 comps
| Address | Beds | Baths | Sqft | Rent | $/sqft | DOM | Units | Dist |
|---|---|---|---|---|---|---|---|---|
| 12905 Woodforest Blvd Houston, TX | 2.0 | 1.0 | 886 | $1,098 | $1.24 | 20d | 2 | 0.03mi |
| 12955 Woodforest Blvd Unit 305 Houston, TX | 1.0 | 1.0 | 728 | $975 | $1.34 | 24d | 1 | 0.07mi |
| 12800 Woodforest Blvd Unit 12857 Houston, TX | 2.0 | 2.0 | 850 | $1,126 | $1.32 | 2d | 1 | 0.08mi |
| 456 Normandy St Houston, TX | 1.0 | 1.0 | 734 | $1,099 | $1.50 | 43d | 1 | 0.35mi |
| 13161 Woodforest Blvd Houston, TX | 2.0 | 2.0 | 965 | $1,058 | $1.10 | 43d | 1 | 0.36mi |
| 536 Normandy St Houston, TX | 2.0 | 2.0 | 860 | $1,144 | $1.33 | 43d | 1 | 0.44mi |
| 555 Normandy St Houston, TX | 1.0–2.0 | 1.0–2.0 | 745 | $818 | $1.10 | 1d | 23 | 0.50mi |
| 561 Normandy St Houston, TX | 2.0 | 2.0 | 940 | $1,200 | $1.28 | 21d | 1 | 0.51mi |
| 561 Normandy St Houston, TX | 1.0 | 1.0 | 680 | $999 | $1.47 | 24d | 1 | 0.51mi |
| 561 Normandy St Houston, TX | 2.0 | 2.0 | 940 | $1,200 | $1.28 | 43d | 1 | 0.51mi |
| 695 Normandy St Houston, TX | 1.0–2.0 | 1.0–2.0 | 788 | $899 | $1.14 | 12d | 30 | 0.58mi |
| 250 Uvalde Rd Houston, TX | 1.0–3.0 | 1.0–2.0 | 909 | $739 | $0.81 | 2d | 26 | 0.71mi |
| 13025 Joliet St Unit A Houston, TX | 1.0 | 1.0 | 842 | $925 | $1.10 | 24d | 1 | 0.72mi |
| 316 White Cedar St Houston, TX | 1.0 | 1.0 | 712 | $1,035 | $1.45 | 21d | 1 | 0.80mi |
| 316 White Cedar St Houston, TX | 2.0 | 2.0 | 1028 | $1,306 | $1.27 | 24d | 1 | 0.80mi |
| 316 White Cedar St Houston, TX | 1.0 | 1.0 | 712 | $1,035 | $1.45 | 19d | 1 | 0.80mi |
| 14340 Wallisville Rd Unit 2047 Houston, TX | 2.0 | 2.0 | 940 | $1,425 | $1.52 | 10d | 1 | 0.81mi |
| 14340 Wallisville Rd Unit 1162 Houston, TX | 1.0 | 1.0 | 670 | $1,080 | $1.61 | 5d | 1 | 0.81mi |
| 14340 Wallisville Rd Unit 2148 Houston, TX | 2.0 | 2.0 | 940 | $1,382 | $1.47 | 2d | 1 | 0.81mi |
| 14340 Wallisville Rd Unit 2162 Houston, TX | 2.0 | 2.0 | 940 | $1,390 | $1.48 | 5d | 1 | 0.81mi |
| 14340 Wallisville Rd Houston, TX | 1.0 | 1.0 | 670 | $1,069 | $1.60 | 12d | 1 | 0.81mi |
| 14340 Wallisville Rd Unit 325 Houston, TX | 1.0 | 1.0 | 670 | $1,077 | $1.61 | 2d | 1 | 0.81mi |
| 14346 Wallisville Rd Houston, TX | 2.0 | 2.0 | 936 | $1,360 | $1.45 | 43d | 1 | 0.81mi |
| 14340 Wallisville Rd Unit 14361 Houston, TX | 1.0 | 1.0 | 670 | $1,077 | $1.61 | 2d | 1 | 0.82mi |
| 14340 Wallisville Rd Unit 14397 Houston, TX | 2.0 | 2.0 | 936 | $1,410 | $1.51 | 43d | 1 | 0.82mi |
| 14340 Wallisville Rd Unit 14391 Houston, TX | 1.0 | 1.0 | 669 | $1,090 | $1.63 | 43d | 1 | 0.82mi |
| 14340 Wallisville Rd Unit 425 Houston, TX | 2.0 | 2.0 | 940 | $1,382 | $1.47 | 2d | 1 | 0.82mi |
| 14340 Wallisville Rd Unit 14361 Houston, TX | 1.0 | 1.0 | 669 | $1,095 | $1.64 | 12d | 1 | 0.82mi |
| 14340 Wallisville Rd Unit 14377 Houston, TX | 2.0 | 2.0 | 940 | $1,414 | $1.50 | 10d | 1 | 0.82mi |
| 353 Audrey Ln Unit 365 1/2 Houston, TX | 2.0 | 1.0 | 800 | $1,375 | $1.72 | 43d | 1 | 0.86mi |
| 14445 Wallisville Rd Houston, TX | 2.0 | 1.0–2.0 | 659 | $976 | $1.48 | 1d | 10 | 0.93mi |
| 5675 Purple Sage Rd Houston, TX | 1.0–2.0 | 1.0–2.0 | 782 | $1,039 | $1.33 | 3d | 18 | 0.93mi |
| 799 Normandy St Houston, TX | 1.0–2.0 | 1.0–2.0 | 843 | $929 | $1.10 | 1d | 13 | 0.94mi |
| 13502 N Thorntree Dr Unit 13523 Houston, TX | 1.0 | 1.0 | 635 | $869 | $1.37 | 12d | 1 | 0.97mi |
| 13502 N Thorntree Dr Unit 13553 Houston, TX | 1.0 | 1.0 | 635 | $864 | $1.36 | 43d | 1 | 0.97mi |
| 13502 N Thorntree Dr Unit 424 Houston, TX | 2.0 | 2.0 | 766 | $939 | $1.23 | 5d | 1 | 0.97mi |
| 13502 N Thorntree Dr Unit 425 Houston, TX | 2.0 | 2.0 | 766 | $963 | $1.26 | 10d | 1 | 0.97mi |
| 13502 N Thorntree Dr Unit 13523 Houston, TX | 1.0 | 1.0 | 583 | $781 | $1.34 | 2d | 1 | 0.97mi |
| 12516 Orleans St Houston, TX | 2.0 | 2.0 | 995 | $1,275 | $1.28 | 24d | 1 | 0.97mi |
| 13502 N Thorntree Dr Unit 1047 Houston, TX | 1.0 | 1.0 | 583 | $824 | $1.41 | 10d | 1 | 0.97mi |
HOA detail condo
- Monthly dues
- $315 · $3,780/yr
- Assessments
- None detected in remarks — confirm with the listing agent.
Listing history 33 events
-
2026-05-07status Pending
-
2026-04-29status Pending
-
2026-03-09$57,000 Active
-
2025-07-15historical
-
2025-04-16$78,900 Active
-
2024-06-14historical
-
2024-03-10$79,990 Active
-
2023-11-02historical
-
2023-09-05status Active
-
2023-09-05historical
-
2023-08-01price $87,000
-
2023-07-13$88,000 Active
-
2023-07-12historical
-
2022-07-01soldstatus
-
2022-06-30soldstatus Sold
-
2022-06-15status Pending
-
2022-06-10status Option Pending
-
2022-05-26$68,500 Active
-
2019-04-30soldstatus
-
2019-04-29soldstatus Sold
-
2019-04-21status Pending
-
2019-04-12status Option Pending
-
2019-03-29$48,000 Active
-
2014-10-09soldstatus
-
2014-10-08soldstatus Sold
-
2014-09-30status Pending
-
2014-09-22$23,000 Active
-
2014-01-13historical
-
2013-07-17$23,500 Active
-
2007-02-16soldstatus
-
2004-11-01soldstatus
-
2004-02-24soldstatus
-
2001-02-22soldstatus
ⓘ Source: listings_history table (triggers on properties + properties_extension) + one-shot
backfill from property_details.listing_events for pre-trigger history.
Tax reassessment forecast TX · Resets to sale price
- Current annual tax
- $1,397 · $116/mo
- Projected year-2 tax
- $1,397 · $116/mo
- Expected delta
- $0/yr ($0/mo · 0.0%)
ⓘ Screening estimate from a state-policy table — verify with the county assessor before closing.
Climate risk First Street
- Flood 1/10 Low FEMA zone X (unshaded) · 0% chance over 30 yrs
- Wildfire 1/10 Low
- Heat 10/10 Extreme 7 d/yr ≥109°F today · 26 d/yr by 30 yrs out
- Wind 9/10 Extreme 99% chance of damaging wind over 30 yrs
- Air quality 2/10 Low 2 unhealthy d/yr today · 2 by 30 yrs out
Nearby sold comps map
Loading sold comps map…
Walkable amenities ~0.75 mi
Loading nearby amenities…
Taxation est. · year 1
- Rental income
- $12,423
- − Mortgage interest
- −$3,193
- − Property taxes
- −$1,397
- − Insurance
- −$285
- − Repairs & maintenance
- −$994
- − Management
- −$994
- − HOA
- −$3,780
- − Depreciation
- −$1,658
- Taxable income
- $122
- Est. tax owed @ 24.0%
- −$29
- After-tax cash flow
- $736/yr
For passive investors: Depreciation is non-cash, so a rental often shows a tax loss while cash-flowing — sheltering income. Rental losses are passive: they offset passive income freely, and up to $25,000/yr can offset ordinary (W-2) income if you actively participate and your MAGI is under $100k (phasing out to $0 by $150k); unused losses carry forward. On sale, claimed depreciation is recaptured at up to 25%, and gains may owe capital-gains tax (a 1031 exchange can defer both). Figures are a year-1 estimate at your 24.0% rate — not tax advice; consult a CPA.
Schools (NCES district)
- District
- Galena Park ISD
- NCES district ID
- 4820250
- Math proficiency
- 32% ▼ -20.00%
- Reading proficiency
- 33% ▼ -7.00%
- Median HH income
- $43,158
- Composite
- 27.62/100
- National rank
- #6927
- State rank
- #578 of 826 in TX
Livability — Houston
- Score
- 74/100
- State rank
- #184
- US rank
- #4771
Category grades
Schools grade is shown separately in the Schools card above.
Census & demographics
- County
- Harris County · 4,702,590 people
- City population
- 3,226,434
- Metro
- Houston-The Woodlands-Sugar Land, TX
- Population (ZIP)
- 58,415
- Household income
- $57,753
- Rent vs Own
- Severe rent burden
- 1816.0
Population outlook (Harris County) Hauer SSP2
- Today (2025)
- 5,571,493 people
- By 2030
- 6,089,821 · +9.3%
- By 2040
- 7,142,806 · +28.2%
- By 2050
- 8,185,864 · +46.9%
- By 2075
- 10,574,329 · +89.8%
- By 2100
- 12,109,958 · +117.4%
Race, ethnicity, and origin ACS 2023
- Neighborhood character
- Predominantly Hispanic (77%)
- Race & ethnicity
- Hispanic / Latino 77% Two or more races 54% Black 14% White 6% Asian 1% Native American 1%
- Hispanic origin (detail)
- Mexican 60% Cuban 2%
- Foreign-born
- 33% · Canada, Vietnam
- Languages at home
- 31% English-only · Spanish 68% Vietnamese 1%
Political lean MEDSL · Harris
- 2024 margin
- Lean D (+5.5) · D 52.0% · R 46.4% · Other 1.6%
- 2008→2024 swing
- +3.9pp toward D · 2008: 1.6pp · 2024: 5.5pp
- All cycles
- 2024: D+5.5 2020: D+13.3 2016: D+12.4 2012: D+0.1 2008: D+1.6
Not yet ingested
- Civics
- —
Market trends
- HPI YoY
- ▼ -36.47%
- Current HPI
- 300.1821
- Rent YoY
- ▼ -0.83%
- Metro
- Houston-The Woodlands-Sugar Land, TX
- State GDP YoY
- ▲ 3.95%
- F500 in state
- 110
Industry mix (Fortune 500 HQ in TX)
| Industry | F500 HQs | Revenue |
|---|---|---|
| Energy | 16 | $1,198B |
|
||
| Technology | 5 | $198B |
|
||
| Engineering / Construction | 4 | $72B |
|
||
| Energy Services | 3 | $60B |
|
||
| Utilities | 3 | $41B |
|
||
| Healthcare | 2 | $330B |
|
||
Price history
+142.6% since first listed33 events — show timeline
- 2026-05-07 Pending — HARMLS
- 2026-04-29 Pending — HARMLS
- 2026-03-09 Listed $57,000 HARMLS
- 2025-07-15 Listing Removed — HARMLS
- 2025-04-16 Listed $78,900 HARMLS
- 2024-06-14 Listing Removed — HARMLS
- 2024-03-10 Listed $79,990 HARMLS
- 2023-11-02 Listing Removed — HARMLS
- 2023-09-05 Relisted — HARMLS
- 2023-09-05 Listing Removed — HARMLS
- 2023-08-01 Price Changed $87,000 HARMLS
- 2023-07-13 Listed $88,000 HARMLS
- 2023-07-12 Coming Soon — HARMLS
- 2022-07-01 Sold (Public Records) — Public Records
- 2022-06-30 Sold (MLS) — HARMLS
- 2022-06-15 Pending — HARMLS
- 2022-06-10 Pending — HARMLS
- 2022-05-26 Listed $68,500 HARMLS
- 2019-04-30 Sold (Public Records) — Public Records
- 2019-04-29 Sold (MLS) — HARMLS
- 2019-04-21 Pending — HARMLS
- 2019-04-12 Pending — HARMLS
- 2019-03-29 Listed $48,000 HARMLS
- 2014-10-09 Sold (Public Records) — Public Records
- 2014-10-08 Sold (MLS) — HARMLS
- 2014-09-30 Pending — HARMLS
- 2014-09-22 Listed $23,000 HARMLS
- 2014-01-13 Listing Removed — HARMLS
- 2013-07-17 Listed $23,500 HARMLS
- 2007-02-16 Sold (Public Records) — Public Records
- 2004-11-01 Sold (Public Records) — Public Records
- 2004-02-24 Sold (Public Records) — Public Records
- 2001-02-22 Sold (Public Records) — Public Records
Property tax history
+3.9%/yrLatest (2025): $1,397 · +14.5% YoY. Source: county tax records.
Cash-flow waterfall
monthlySold comps — $/sqft
last 12 mo · ≤1 miLoading sold comps…