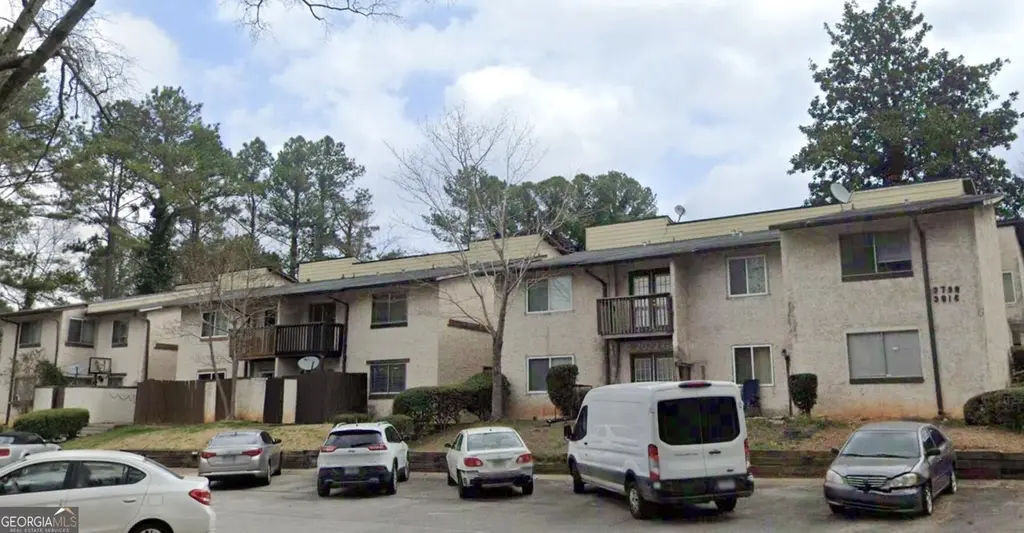
3834 Kensingwood Trce · Belvedere Park, GA
Flood risk 1/10 · Minimal
- FEMA flood zone
- X (unshaded)
- Chance of flooding over 30 yrs
- 0.0%
- Est. flood insurance / yr
- $507 – $1,088
Fire risk 1/10 · Minimal
- Est. fire insurance / yr
- $963 – $1,789
Heat risk 5/10 · Moderate
- Hot days now (above 104°F)
- 7 days/yr
- Hot days in 30 yrs
- 18 days/yr
Wind risk 4/10 · Minor
- Chance of severe wind over 30 yrs
- 24.0%
Air-quality risk 6/10 · Moderate
- Unhealthy air days now
- 8 days/yr
- Unhealthy air days in 30 yrs
- 11 days/yr
Risk factors via First Street. Map © Google.
Why this score? — see what drove the C grade
The composite is a weighted blend of 9 inputs, each scored 0–100. Each bar is that input's sub-score; the figure is the points it added to the 100-point composite (weight × sub-score).
- Cash flow +20.5/30.0
- ARV discount +14.9/15.0
- 1% rule +6.8/10.0
- DSCR +6.5/10.0
- Livability +3.4/5.0
- Rent growth +2.8/5.0
- Condition / age +2.5/5.0
- Schools +2.1/10.0
- Appreciation +0.0/10.0
$159,900
🖨 Deal sheet 📄 Offer letter ✓ Due diligence
Listing remarks MLS
TOWNHOME! FULLY FURNISHED! BRAND NEW FLOORS! THE BATHROOM AND KITCHEN HAS BEEN FULLY RENOVATED! UNIT HAS BEEN USED AS AN AIRBNB BRINGING IN $125 / DAY STEAL FOR $159,900 HOA IS $190/ MONTH RENTAL READY! FULLY FURNISHED
Key facts
- Fully renovated
- Brand new floors
- Fully furnished
Tags
Neighborhood map
What this means for you Summary
Snapshot
- This is a 3-bed/2.0-bath condo listed at $160k.
Deal economics
- At list price, monthly cash flow is $209 ($3k/yr) — positive.
- The deal already cash-flows at list — no discount required.
- Meets the 1% rule at list price ($2k rent vs $160k).
- Recommended offer: $141k (12.0% below list) — sets the bar for market timing.
- Cap rate 7.9% vs local median 3.8% in Belvedere Park — top-decile yield for the area; either an underpriced asset or a hidden risk that comps aren't pricing in. Stress-test before assuming the spread holds.
Location & tenants
- Location reads 68/100 on livability (#153 in GA) — a middle-class / working-renter tenant base. Strengths: cost of living A+, housing A+; Watch: schools F, amenities F, commute F.
- Dekalb County (suburban): math 19% / reading 28% proficiency, ranked #125 of 174 in GA (top 72%) — low school quality limits family demand, transient renter base, plan for 1-2y turnover; 68% free/reduced lunch — lower-income household profile, screen leases tightly.
- Market conditions: Rents rising (+1.3%/yr); 422 active listings in the ZIP; 40 comparable units currently listed for rent nearby; rentals lingering (median 44d on market — plan ~5-8 weeks vacancy on turnover, expect pricing pressure); 52% of comp listings sitting > 30 days — soft ceiling on asking rent; 1,240 units permitted in DeKalb County in 2024 (385 in 5+ unit buildings).
- This rent runs 36% of the median local income ($63k/yr) — at the standard rent-burdened threshold; future hikes will face affordability resistance.
Forward outlook
- Local home prices are declining (-3.0%/yr); year-one equity from $1k of loan paydown is wiped out by about $5k of value loss. Plan a longer hold.
- DeKalb County population projected at +28% by 2050 — long-run rental-demand tailwind backs the buy-and-hold thesis.
Negotiation context
- It's been on market 443 days — a 12% lower offer ($141k) is reasonable based on typical stale-listing flexibility.
- Current owner paid $100k; list at $160k implies a 60% gain — meaningful room to come down on a strong offer.
Risks & watch-outs
- Climate carrying-cost: extreme-heat days projected 7→18/yr by 2055 (HVAC capex compounding) — expect insurance premiums to compound above CPI over the hold.
Questions for the listing agent
- It's been on market 443 days. Have you received any prior offers? Is the seller open to a 12% concession, seller financing, or rate buy-down credit?
- Built in 1974 — when were the roof, HVAC, electrical panel, plumbing, and water heater last replaced?
- What does the HOA fee cover, when was the last increase, and are there any pending special assessments or reserve-fund shortfalls?
- Any open or pending special assessments — roof, HVAC, plumbing, elevator, façade? What's the per-unit balance and payoff schedule, and is the seller paying it off at close or rolling it to the buyer?
- Why hasn't it sold? Are there any deal-killer items the seller is aware of (foundation, flood, title, zoning, code violations)?
- Is there a deadline driving the sale (1031 exchange, divorce, estate, relocation)? That informs how much negotiation room exists.
- Schools are F-rated, which usually means shorter tenancies and higher turnover. Who's the typical renter profile here, and what's been the actual vacancy rate?
- What's the average days-on-market for RENTAL listings here right now (not sales)? A rising rental-DOM trend means longer vacancies and softer asking-rent achievability than the comps imply.
- What's the recent tenant-quality profile in this submarket — average credit score on applications, eviction rate, late-payment / NSF rate, and stable-employment percentage? A property-management company in the area should have these aggregated.
- How much new apartment / multifamily construction is in the pipeline within 1–3 miles? Heavy new supply (>2% of stock underway) typically softens rents 12–24 months out; light construction supports rent growth.
Investment metrics
- 1% rule
- 1.18% ✓
- Cap rate
- 7.86%
- Cash-on-cash
- 5.61%
- DSCR
- 1.25
- GRM
- 7.1
CMA / ARV
- ARV (median comp)
- $191,221
- List price
- $159,900
- Delta
- -16.38%
- Verdict
- UNDERPRICED
- Comps
- 20 within 1.0 mi
Projected returns pro-forma
-3.0% appreciation · 1.34% rent growth · sell at horizon
- IRR
- -9.7%
- Equity multiple
- 0.65×
- Total profit
- $-15,536
- Equity at exit
- $23,842
- IRR
- -2.9%
- Equity multiple
- 0.82×
- Total profit
- $-8,078
- Equity at exit
- $13,825
Cash invested: $44,772 (down + closing). Projections, not guarantees.
Landlord ↔ Tenant lean methodology
- Overall (STATE)
- 90 Strongly Landlord-Friendly
- State Georgia
- 90 Strongly Landlord-Friendly · R+3
- County
- — inherits STATE
- City
- — inherits STATE
ZIP-level market 30032
- Rents YoY
- 1.3%
- Active inventory
- 422
- Price-to-rent
- 7.1×
Monthly cashflow live
- Estimated rent
- $1,879 high interval (Pro) →
- Mortgage (P&I)
- −$839
- Tax from tax record
- −$180 /mo · $2,159/yr
- Insurance
- −$67
- HOA
- −$190
- Vacancy / Maint / Mgmt
- −$395
- Net cashflow
- $209
Break-even live
UW: 25.0% down · 7.5% · 30yr · 1.5% tax · 5.0% vac · 8.0% maint · 8.0% mgmt
Financing live
Cash to close
- Down payment
- $39,975
- Closing costs
- $4,797
- Reserves months
- —
- Total cash needed
- —
Loan-product check · same deal, 3 products live
Conventional
25% down · 7.5% · 30yr
- Down + closing
- —
- Monthly P&I
- —
- Monthly cashflow
- —
- DSCR
- —
- Eligible?
- —
Personal DTI + credit; lowest rate.
DSCR
20% down · 8.5% · 30yr
- Down + closing
- —
- Monthly P&I
- —
- Monthly cashflow
- —
- DSCR
- —
- Eligible?
- —
No personal income docs; deal must DSCR.
Hard money
10% down · 12.0% · 12mo
- Down + closing
- —
- Monthly P&I
- —
- Monthly cashflow
- —
- DSCR
- —
- Eligible?
- —
Short-term bridge; refi at stabilization.
Rent comps 40 comps
| Address | Beds | Baths | Sqft | Rent | $/sqft | DOM | Units | Dist |
|---|---|---|---|---|---|---|---|---|
| 3841 Kensington Rd Decatur, GA | 2.0–3.0 | 2.0 | 1220 | $1,800 | $1.48 | 1d | 14 | 0.06mi |
| 3893 Kensington Rd Decatur, GA | 2.0 | 2.0 | 930 | $1,299 | $1.40 | 43d | 1 | 0.12mi |
| 1055 Holcombe Rd Decatur, GA | 2.0–3.0 | 1.5 | 1157 | $1,459 | $1.26 | 2d | 6 | 0.17mi |
| 3960 Redan Rd Stone Mountain, GA | 1.0–3.0 | 1.0–2.0 | 1339 | $3,194 | $2.39 | 1d | 19 | 0.38mi |
| 3824 London Dr Decatur, GA | 3.0 | 2.5 | 1544 | $1,531 | $0.99 | 43d | 1 | 0.47mi |
| 3964 Carlinswood Way Stone Mountain, GA | 3.0 | 2.5 | 1681 | $2,000 | $1.19 | 43d | 1 | 0.48mi |
| 1081 Brittania Rd Unit 1 Stone Mountain, GA | 3.0 | 2.5 | 1866 | $1,950 | $1.05 | 43d | 1 | 0.49mi |
| 1081 Brittania Rd Stone Mountain, GA | 3.0 | 3.0 | 1866 | $1,950 | $1.05 | 43d | 1 | 0.49mi |
| 4011 Redan Rd #5 Stone Mountain, GA | 3.0 | 2.5 | 1400 | $2,040 | $1.46 | 43d | 1 | 0.53mi |
| 4011 Redan Rd #5 Stone Mountain, GA | 3.0 | 2.5 | 1426 | $2,040 | $1.43 | 18d | 1 | 0.53mi |
| 1023 Privy Ln Stone Mountain, GA | 3.0 | 2.5 | 1701 | $2,700 | $1.59 | 4d | 1 | 0.59mi |
| 3800 W Wood Path Stone Mountain, GA | 3.0 | 2.0 | 1344 | $2,500 | $1.86 | 43d | 1 | 0.72mi |
| 3465 Kensington Rd Decatur, GA | 1.0–2.0 | 1.0–1.5 | 850 | $1,650 | $1.94 | 17d | 1 | 0.72mi |
| 3961 Covington Hwy Decatur, GA | 2.0–3.0 | 1.0–1.5 | 1000 | $1,560 | $1.56 | 2d | 8 | 0.77mi |
| 1221 S Indian Creek Dr Stone Mountain, GA | 1.0–2.0 | 1.0–2.0 | 905 | $1,790 | $1.98 | 24d | 15 | 0.81mi |
| 4151 Memorial Dr Decatur, GA | 1.0–3.0 | 1.0–2.0 | 816 | $1,892 | $2.32 | 1d | 145 | 0.86mi |
| 3728 Loren Dr Decatur, GA | 3.0 | 1.5 | 1340 | $2,150 | $1.60 | 43d | 1 | 0.93mi |
| 3345 Kensington Rd Decatur, GA | 2.0 | 2.0 | 943 | $1,452 | $1.54 | 12d | 1 | 1.05mi |
| 3787 Redwing Cir Decatur, GA | 3.0 | 1.0 | 1220 | $1,495 | $1.23 | 43d | 1 | 1.10mi |
| 1423 Dennis Dr Decatur, GA | 3.0 | 1.0 | 1062 | $1,200 | $1.13 | 17d | 1 | 1.11mi |
| 750 Avondale Creek Dr Unit 144 Decatur, GA | 2.0 | 2.0 | 956 | $1,816 | $1.90 | 43d | 1 | 1.15mi |
| 750 Avondale Creek Dr Decatur, GA | 2.0 | 1.0–2.0 | 732 | $1,901 | $2.60 | 1d | 14 | 1.15mi |
| 260 Northern Ave Avondale Estates, GA | 1.0–3.0 | 1.0–2.0 | 1155 | $1,380 | $1.19 | 43d | 4 | 1.17mi |
| 3907 Redwing Cir Decatur, GA | 1.0–2.0 | 1.0–2.0 | 836 | $1,149 | $1.37 | 43d | 18 | 1.18mi |
| 3330 Mountain Dr Decatur, GA | 1.0–3.0 | 1.0–2.0 | 972 | $1,744 | $1.79 | 1d | 29 | 1.24mi |
| 1473 Hyatt Cir Decatur, GA | 3.0 | 2.5 | 1386 | $2,050 | $1.48 | 43d | 1 | 1.25mi |
| 3096 Calcutta St Decatur, GA | 3.0 | 2.5 | 1386 | $1,895 | $1.37 | 43d | 1 | 1.27mi |
| 3106 Calcutta St Decatur, GA | 3.0 | 2.5 | 1386 | $1,895 | $1.37 | 43d | 1 | 1.28mi |
| 3681 Pavilion Point Decatur, GA | 2.0–4.0 | 1.0–2.0 | 1355 | $1,700 | $1.25 | 43d | 1 | 1.28mi |
| 3121 Journal Ct Decatur, GA | 3.0 | 2.5 | 1386 | $1,895 | $1.37 | 19d | 1 | 1.29mi |
| 1502 Vernon Blvd Decatur, GA | 3.0 | 3.0 | 1515 | $2,050 | $1.35 | 24d | 1 | 1.29mi |
| 1150 Maple Walk Cir Decatur, GA | 2.0 | 2.0 | 1050 | $1,299 | $1.24 | 24d | 3 | 1.30mi |
| 3799 N Decatur Rd Decatur, GA | 1.0–3.0 | 1.0–2.0 | 1087 | $1,295 | $1.19 | 1d | 16 | 1.30mi |
| 3900 Memorial Dr Decatur, GA | 1.0–2.0 | 1.0–1.5 | 1050 | $1,275 | $1.21 | 12d | 4 | 1.39mi |
| 1428 David Cir Unit A11 Decatur, GA | 3.0 | 1.5 | 1362 | $1,830 | $1.34 | 43d | 1 | 1.41mi |
| 1387 Midview Dr Decatur, GA | 3.0 | 1.0 | 1026 | $1,750 | $1.71 | 43d | 1 | 1.42mi |
| 1683 Vernon Blvd Decatur, GA | 3.0 | 2.5 | 1515 | $1,840 | $1.21 | 18d | 1 | 1.42mi |
| 1368 Alverado Way Decatur, GA | 2.0 | 1.0 | 1088 | $1,523 | $1.40 | 43d | 1 | 1.43mi |
| 3235 Beech Dr Decatur, GA | 3.0 | 2.0 | 1264 | $2,400 | $1.90 | 43d | 1 | 1.44mi |
| 3184 Delancy St Decatur, GA | 3.0 | 2.5 | 1515 | $1,800 | $1.19 | 43d | 1 | 1.44mi |
HOA detail condo
- Monthly dues
- $190 · $2,280/yr
- Assessments
- None detected in remarks — confirm with the listing agent.
Listing history 18 events
-
2026-06-18days on market $159,900 Active 443 DOM
-
2026-06-17days on market $159,900 Active 442 DOM
-
2026-06-16days on market $159,900 Active 441 DOM
-
2026-06-15days on market $159,900 Active 440 DOM
-
2026-06-13days on market $159,900 Active 438 DOM
-
2026-06-09days on market $159,900 Active 434 DOM
-
2026-06-08days on market $159,900 Active 433 DOM
-
2026-06-07days on market $159,900 Active 432 DOM
-
2026-06-04days on market $159,900 Active 429 DOM
-
2026-06-03days on market $159,900 Active 428 DOM
-
2026-06-02days on market $159,900 Active 427 DOM
-
2026-06-01days on market $159,900 Active 426 DOM
-
2026-05-31days on market $159,900 Active 425 DOM
-
2025-04-01$159,900 New 242-char remark
Show marketing remark (242 chars)
TOWNHOME! FULLY FURNISHED! BRAND NEW FLOORS! THE BATHROOM AND KITCHEN HAS BEEN FULLY RENOVATED! UNIT HAS BEEN USED AS AN AIRBNB BRINGING IN $125 / DAY STEAL FOR $159,900 HOA IS $190/ MONTH RENTAL READY! FULLY FURNISHED
-
2021-11-03soldstatus $100,000
-
2002-01-07soldstatus $69,000
-
1995-04-28soldstatus $50,000
-
1992-09-28soldstatus $44,722
ⓘ Source: listings_history table (triggers on properties + properties_extension) + one-shot
backfill from property_details.listing_events for pre-trigger history.
Tax reassessment forecast GA · Resets to sale price
- Current annual tax
- $2,159 · $180/mo
- Projected year-2 tax
- $2,159 · $180/mo
- Expected delta
- $0/yr ($0/mo · 0.0%)
ⓘ Screening estimate from a state-policy table — verify with the county assessor before closing.
Climate risk First Street
- Flood 1/10 Low FEMA zone X (unshaded) · 0% chance over 30 yrs
- Wildfire 1/10 Low
- Heat 5/10 Major 7 d/yr ≥104°F today · 18 d/yr by 30 yrs out
- Wind 4/10 Moderate 24% chance of damaging wind over 30 yrs
- Air quality 6/10 Major 8 unhealthy d/yr today · 11 by 30 yrs out
Nearby sold comps map
Loading sold comps map…
Walkable amenities ~0.75 mi
Loading nearby amenities…
Taxation est. · year 1
- Rental income
- $22,548
- − Mortgage interest
- −$8,957
- − Property taxes
- −$2,159
- − Insurance
- −$800
- − Repairs & maintenance
- −$1,804
- − Management
- −$1,804
- − HOA
- −$2,280
- − Depreciation
- −$4,652
- Taxable income
- $93
- Est. tax owed @ 24.0%
- −$22
- After-tax cash flow
- $2,489/yr
For passive investors: Depreciation is non-cash, so a rental often shows a tax loss while cash-flowing — sheltering income. Rental losses are passive: they offset passive income freely, and up to $25,000/yr can offset ordinary (W-2) income if you actively participate and your MAGI is under $100k (phasing out to $0 by $150k); unused losses carry forward. On sale, claimed depreciation is recaptured at up to 25%, and gains may owe capital-gains tax (a 1031 exchange can defer both). Figures are a year-1 estimate at your 24.0% rate — not tax advice; consult a CPA.
Schools (NCES district)
- District
- Dekalb County
- NCES district ID
- 1301740
- Math proficiency
- 19% ▼ -12.00%
- Reading proficiency
- 28% ▼ -7.00%
- Median HH income
- $51,448
- Composite
- 20.92/100
- National rank
- #8482
- State rank
- #125 of 174 in GA
Livability — Belvedere Park
- Score
- 68/100
- State rank
- #153
- US rank
- #9886
Category grades
Schools grade is shown separately in the Schools card above.
Census & demographics
- County
- Dekalb County · 782,738 people
- City population
- 42,812
- Metro
- Atlanta-Sandy Springs-Alpharetta, GA
- Population (ZIP)
- 42,948
- Household income
- $62,765
- Rent vs Own
- Severe rent burden
- 2097.0
Population outlook (DeKalb County) Hauer SSP2
- Today (2025)
- 839,977 people
- By 2030
- 891,768 · +6.2%
- By 2040
- 988,894 · +17.7%
- By 2050
- 1,074,583 · +27.9%
- By 2075
- 1,245,026 · +48.2%
- By 2100
- 1,303,135 · +55.1%
Race, ethnicity, and origin ACS 2023
- Neighborhood character
- Predominantly Black (70%)
- Race & ethnicity
- Black 70% White 18% Two or more races 6% Hispanic / Latino 5% Asian 2%
- Hispanic origin (detail)
- Mexican 2%
- Common ancestry
- Slovak 1% Italian 1% Serbian 1%
- Foreign-born
- 7% · Canada, China, Guatemala
- Languages at home
- 91% English-only · Spanish 4% Arabic 1% Other Indo-European 0%
Political lean MEDSL · DeKalb
- 2024 margin
- Solid D (+64.8) · D 81.9% · R 17.1% · Other 1.0%
- 2008→2024 swing
- +6.1pp toward D · 2008: 58.6pp · 2024: 64.8pp
- All cycles
- 2024: D+64.8 2020: D+67.4 2016: D+64.8 2012: D+56.8 2008: D+58.6
Not yet ingested
- Civics
- —
Market trends
- HPI YoY
- ▼ -203.83%
- Current HPI
- 221.0467
- Rent YoY
- ▲ 1.34%
- Metro
- Atlanta-Sandy Springs-Alpharetta, GA
- State GDP YoY
- ▲ 2.66%
- F500 in state
- 28
Industry mix (Fortune 500 HQ in GA)
| Industry | F500 HQs | Revenue |
|---|---|---|
| Paper / Packaging | 2 | $29B |
|
||
| Retail | 1 | $160B |
|
||
| Transportation / Logistics | 1 | $91B |
|
||
| Airlines | 1 | $62B |
|
||
| Consumer Goods | 1 | $47B |
|
||
| Utilities | 1 | $25B |
|
||
Price history
+257.5% since first listed5 events — show timeline
- 2025-04-01 Listed $159,900 GAMLS
- 2021-11-03 Sold (Public Records) $100,000 Public Records
- 2002-01-07 Sold (Public Records) $69,000 Public Records
- 1995-04-28 Sold (Public Records) $50,000 Public Records
- 1992-09-28 Sold (Public Records) $44,722 Public Records
Property tax history
+3.3%/yrLatest (2025): $2,159 · -7.4% YoY. Source: county tax records.
Cash-flow waterfall
monthlySold comps — $/sqft
last 12 mo · ≤1 miLoading sold comps…