 Multi-family
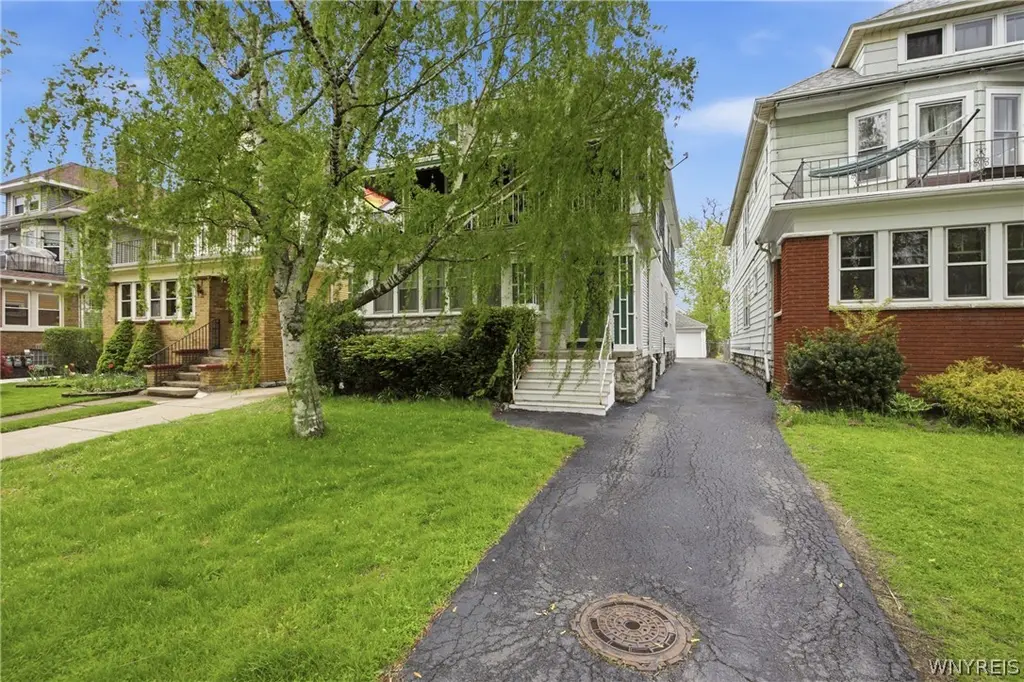
301 Colvin Ave · Buffalo, NY
Flood risk 1/10 · Minimal
- FEMA flood zone
- X (unshaded)
- Chance of flooding over 30 yrs
- 0.0%
- Est. flood insurance / yr
- $473 – $860
Fire risk 1/10 · Minimal
- Est. fire insurance / yr
- $691 – $1,283
Heat risk 3/10 · Minor
- Hot days now (above 92°F)
- 7 days/yr
- Hot days in 30 yrs
- 15 days/yr
Wind risk 1/10 · Minimal
- Chance of severe wind over 30 yrs
- —
Air-quality risk 4/10 · Minor
- Unhealthy air days now
- 4 days/yr
- Unhealthy air days in 30 yrs
- 9 days/yr
Risk factors via First Street. Map © Google.
Why this score? — see what drove the D+ grade
The composite is a weighted blend of 9 inputs, each scored 0–100. Each bar is that input's sub-score; the figure is the points it added to the 100-point composite (weight × sub-score).
- Cash flow +18.4/30.0
- ARV discount +7.5/15.0
- DSCR +5.8/10.0
- Livability +3.9/5.0
- 1% rule +3.7/10.0
- Rent growth +3.4/5.0
- Schools +3.3/10.0
- Condition / age +2.5/5.0
- Appreciation +0.0/10.0
$364,900
🖨 Deal sheet (PDF) 📄 Offer letter ✓ Due diligence
Multi-family units
County records classify this as Multi-Family (2-4 Unit). Listing-text estimate: 1 unit. estimate disagrees with records
Listing remarks
Turnkey Buffalo Double- Steps from Hertel Ave! Prime North Buffalo location just steps from everything Hertel Avenue has to offer- some of the best dining, shopping, and nightlife the city has to give! Proudly owned and lovingly maintained by the same family since it was built, this well-cared for income-producing double features two solid, reliable tenants already in place and a long list of meaningful updates, making it a true turnkey opportunity for investors or owner-occupants alike. The upper unit shines with refinished hardwood floors, a brand-new central A/C system an updated bathroom, and two private outdoor spaces-a charming covered front porch and a rear porch accessible directly
Key facts
- Renovated kitchen
- New drain tiles
- Bonus flex room
Tags
Property features AI
Finance
- Other: Lot is approximately 0.1339 acres
- Financial info: Multifamily property with 2 total units; Separate utility meters for each unit (2 gas, 2 electric); Operating expenses include maintenance and water/sewer; Owner pays trash collection and water; rent (where applicable) includes trash collection and water
Exterior
- Parking: Detached or attached garage with 2 spaces (garage present); Two or more parking spaces
- Utilities: Public water connected; Sewer connected
- Home design: Two-story building; Resale property; Wood siding construction; Rectangular residential lot on a city street (lot dimensions approx. 33 x 175)
- Construction: Wood siding; Existing structure (year built: existing); 2 stories total
- Exterior features: Awning(s); Balcony; Fence (partial); Covered porch
Interior
- Kitchen: Gas water heater (appliance listed)
- Bedrooms: 2-unit property (multifamily) — bedroom counts per unit not specified
- Flooring: Hardwood; Varies by area
- Bathrooms: 2 full bathrooms (total)
- Heating & cooling: Gas forced air heating; Central air and wall unit cooling
- Interior features: Natural woodwork; Hardwood and varied flooring; Full basement
- Laundry & utility: Separate gas and electric meters (one for each unit)
Neighborhood map
What this means for you Summary
Snapshot
- This is a 6-bed/2.5-bath multifamily listed at $365k.
Deal economics
- At list price, monthly cash flow is $339 ($4k/yr) — positive.
- The deal already cash-flows at list — no discount required.
- To meet the 1% rule (rent ≥ 1% of price), the offer needs to be $318k (12.9% below list).
- Recommended offer: $318k (12.9% below list) — sets the bar for 1% rule.
Location & tenants
- Location reads 77/100 on livability (#195 in NY, #3,011 nationally) — a middle-class / working-renter tenant base. Strengths: commute A+, housing A+, health & safety A+; Watch: crime F, employment D-.
- Buffalo City School District (urban): math 41% / reading 40% proficiency, ranked #535 of 590 in NY (top 91%) — families likely to look elsewhere, expect single-tenant / working-renter base with shorter leases; 75% free/reduced lunch — lower-income household profile, screen leases tightly.
- Zoned schools: International School (math 8% / reading 17%, grade F, #2,048 of 2,108 statewide, top 97%, 981 students, 92% FRL); Hutchinson Central Technical High School (math 96% / reading 32%, grade B-, #807 of 1,100 statewide, top 73%, 1,175 students, 78% FRL).
- Market conditions: Rents rising (+3.6%/yr); 91 active listings in the ZIP; 1,244 units permitted in Erie County in 2024 (563 in 5+ unit buildings).
- At $3,179/mo this rent would consume 55% of the median local household income ($70k/yr) (locally 1831% of renters already pay >50% of income on rent) — very limited rent-growth headroom before tenants either downsize or default.
Forward outlook
- Local home prices are declining (-3.0%/yr); year-one equity from $3k of loan paydown is wiped out by about $11k of value loss. Plan a longer hold.
Negotiation context
- Only 8 days on market — expect competitive offers; lowballing is unlikely to land.
Risks & watch-outs
- Watch-outs: built in 1921 — expect roof / HVAC / electrical / plumbing capex.
Questions for the listing agent
- Built in 1921 — when were the roof, HVAC, electrical panel, plumbing, and water heater last replaced?
- Is there a deadline driving the sale (1031 exchange, divorce, estate, relocation)? That informs how much negotiation room exists.
- Crime grade is F in this area — have there been break-ins, vandalism, or insurance claims at this property in the last 3 years? What carrier currently insures it and at what premium?
- The area grade is low — what's the realistic commute time and amenity access for the typical tenant pool here? Any planned neighborhood developments (good or bad) we should know about?
- What's the average days-on-market for RENTAL listings here right now (not sales)? A rising rental-DOM trend means longer vacancies and softer asking-rent achievability than the comps imply.
- What's the recent tenant-quality profile in this submarket — average credit score on applications, eviction rate, late-payment / NSF rate, and stable-employment percentage? A property-management company in the area should have these aggregated.
- How much new apartment / multifamily construction is in the pipeline within 1–3 miles? Heavy new supply (>2% of stock underway) typically softens rents 12–24 months out; light construction supports rent growth.
Investment metrics
- 1% rule
- 0.87% ✗
- Cap rate
- 7.41%
- Cash-on-cash
- 3.98%
- DSCR
- 1.18
- GRM
- 9.6
CMA / ARV
- ARV (median comp)
- $771,037
- List price
- $364,900
- Delta
- -52.67%
- Verdict
- UNDERPRICED
- Comps
- 20 within 1.0 mi
Show comp detail 12 sales within ~0.75 mi
| Address | Dist | Beds/Ba | Sqft | Sold | Price | $/sf | Match |
|---|---|---|---|---|---|---|---|
| 310 Colvin Ave | 0.04mi | 6/2.0 | 2,829 (+6%) | 1mo | $367,000 | $130 | 85 |
| 190 Commonwealth Ave | 0.20mi | 6/2.0 | 2,672 (+0%) | 4mo | $310,000 | $116 | 85 |
| 246 Crestwood Ave | 0.22mi | 6/3.0 | 2,665 (+0%) | 7mo | $430,000 | $161 | 82 |
| 24 Lovering Ave | 0.25mi | 6/2.0 | 2,716 (+2%) | 4mo | $340,000 | $125 | 79 |
| 415 Colvin Ave | 0.22mi | 6/2.0 | 2,738 (+3%) | 8mo | $360,000 | $131 | 77 |
| 32 Sterling Ave | 0.37mi | 6/3.0 | 2,662 (+0%) | 7mo | $470,300 | $177 | 75 |
| 1164 Hertel Ave | 0.34mi | 5/3.0 (-1) | 2,702 (+2%) | 2mo | $420,000 | $155 | 73 |
| 162 N Park Ave | 0.13mi | 6/2.0 | 2,876 (+8%) | 8mo | $407,500 | $142 | 72 |
| 12 Lovering Ave | 0.25mi | 6/2.0 | 2,876 (+8%) | 5mo | $294,000 | $102 | 69 |
| 131 Tacoma Ave | 0.49mi | 6/2.0 | 2,808 (+6%) | 3mo | $330,000 | $118 | 63 |
| 21 Sterling Ave | 0.40mi | 6/2.0 | 2,910 (+9%) | 2mo | $441,000 | $152 | 62 |
| 292 Hartwell Rd | 0.45mi | 6/2.0 | 2,446 (-8%) | 7mo | $355,000 | $145 | 58 |
Match score weights: distance 35% · size 25% · config 20% · recency 20%. Top-matched comps best support the ARV.
Projected returns pro-forma
-3.0% appreciation · 3.65% rent growth · sell at horizon
- IRR
- -9.5%
- Equity multiple
- 0.65×
- Total profit
- $-35,611
- Equity at exit
- $54,408
- IRR
- 0.7%
- Equity multiple
- 1.05×
- Total profit
- $4,817
- Equity at exit
- $31,550
Cash invested: $102,172 (down + closing). Projections, not guarantees.
Landlord ↔ Tenant lean methodology
- Overall (STATE)
- 15 Strongly Tenant-Friendly
- State New York
- 15 Strongly Tenant-Friendly · D+10
- County
- — inherits STATE
- City
- — inherits STATE
ZIP-level market 14216
- Rents YoY
- 3.6%
- Active inventory
- 91
- Price-to-rent
- 19.1×
Monthly cashflow live
- Estimated rent
- $3,179 high interval (Pro) →
- Mortgage (P&I)
- −$1,914
- Tax from tax record
- −$107 /mo · $1,281/yr
- Insurance
- −$152
- HOA
- −$0
- Vacancy / Maint / Mgmt
- −$668
- Net cashflow
- $339
Break-even live
Sensitivity live
| Price | -10% $546 | -5% $442 | +0% $339 | +5% $236 | +10% $132 |
|---|---|---|---|---|---|
| Rent | -10% $88 | -5% $213 | +0% $339 | +5% $465 | +10% $590 |
| Rate | -1.0pp $523 | -0.5pp $432 | base $339 | +0.5pp $244 | +1.0pp $148 |
2-unit breakdown (identical units grouped — click to expand)
| Units | Beds | Baths | Est. rent |
|---|---|---|---|
| 2× units | 2 | 1 | $3,178 |
| #1 | 2 | 1 | $1,589 |
| #2 | 2 | 1 | $1,589 |
| Total (2 units) | $3,179 | ||
UW: 25.0% down · 7.5% · 30yr · 1.5% tax · 5.0% vac · 8.0% maint · 8.0% mgmt
Financing live
Cash to close
- Down payment
- $91,225
- Closing costs
- $10,947
- Reserves months
- —
- Total cash needed
- —
Loan-product check · same deal, 3 products live
Conventional
25% down · 7.5% · 30yr
- Down + closing
- —
- Monthly P&I
- —
- Monthly cashflow
- —
- DSCR
- —
- Eligible?
- —
Personal DTI + credit; lowest rate.
DSCR
20% down · 8.5% · 30yr
- Down + closing
- —
- Monthly P&I
- —
- Monthly cashflow
- —
- DSCR
- —
- Eligible?
- —
No personal income docs; deal must DSCR.
Hard money
10% down · 12.0% · 12mo
- Down + closing
- —
- Monthly P&I
- —
- Monthly cashflow
- —
- DSCR
- —
- Eligible?
- —
Short-term bridge; refi at stabilization.
Listing history 1 events
-
2026-05-14$364,900 Active 1779-char remark
ⓘ Source: listings_history table (triggers on properties + properties_extension) + one-shot
backfill from property_details.listing_events for pre-trigger history.
Tax reassessment forecast NY · Partial reset (capped growth)
- Current annual tax
- $1,281 · $107/mo
- Projected year-2 tax
- $3,724 · $310/mo
- Expected delta
- +$2,443/yr (+$204/mo · 190.6%)
ⓘ Screening estimate from a state-policy table — verify with the county assessor before closing.
Climate risk First Street
- Flood 1/10 Low FEMA zone X (unshaded) · 0% chance over 30 yrs
- Wildfire 1/10 Low
- Heat 3/10 Moderate 7 d/yr ≥92°F today · 15 d/yr by 30 yrs out
- Wind 1/10 Low
- Air quality 4/10 Moderate 4 unhealthy d/yr today · 9 by 30 yrs out
Nearby sold comps map
Loading sold comps map…
Walkable amenities ~0.75 mi
Loading nearby amenities…
Taxation est. · year 1
- Rental income
- $38,148
- − Mortgage interest
- −$20,440
- − Property taxes
- −$1,281
- − Insurance
- −$1,824
- − Repairs & maintenance
- −$3,052
- − Management
- −$3,052
- − Depreciation
- −$10,615
- Taxable loss
- −$2,117
- Est. tax savings @ 24.0%
- +$508
- After-tax cash flow
- $4,576/yr
For passive investors: Depreciation is non-cash, so a rental often shows a tax loss while cash-flowing — sheltering income. Rental losses are passive: they offset passive income freely, and up to $25,000/yr can offset ordinary (W-2) income if you actively participate and your MAGI is under $100k (phasing out to $0 by $150k); unused losses carry forward. On sale, claimed depreciation is recaptured at up to 25%, and gains may owe capital-gains tax (a 1031 exchange can defer both). Figures are a year-1 estimate at your 24.0% rate — not tax advice; consult a CPA.
Schools (NCES district)
- District
- Buffalo City School District
- NCES district ID
- 3605850
- Math proficiency
- 41% ▲ 11.00%
- Reading proficiency
- 40% ▲ 7.00%
- Median HH income
- $31,665
- Composite
- 33.17/100
- National rank
- #5544
- State rank
- #535 of 590 in NY
Livability — Buffalo
- Score
- 77/100
- State rank
- #195
- US rank
- #3011
Category grades
Schools grade is shown separately in the Schools card above.
Census & demographics
- Census place
- Buffalo, NY
- County
- Erie County · 714,559 people
- City population
- 440,021
- Metro
- Buffalo-Cheektowaga, NY
- Population (ZIP)
- 22,849
- Household income
- $69,629
- Rent vs Own
- Severe rent burden
- 1831.0
Population outlook (Erie County) Hauer SSP2
- Today (2025)
- 933,037 people
- By 2030
- 935,181 · +0.2%
- By 2040
- 928,531 · -0.5%
- By 2050
- 905,725 · -2.9%
- By 2075
- 834,037 · -10.6%
- By 2100
- 708,033 · -24.1%
Race, ethnicity, and origin ACS 2023
- Neighborhood character
- Predominantly White (72%)
- Race & ethnicity
- White 72% Black 16% Hispanic / Latino 7% Two or more races 5% Asian 1%
- Hispanic origin (detail)
- Puerto Rican 5%
- Common ancestry
- Romanian 10% Iranian 2% Lithuanian 1%
- Foreign-born
- 5% · Canada, China
- Languages at home
- 90% English-only · Spanish 5% French/Haitian/Cajun 1% Other Indo-European 1%
Political lean MEDSL · Erie
- 2024 margin
- Lean D (+9.7) · D 54.8% · R 45.2%
- 2008→2024 swing
- -7.9pp toward R · 2008: 17.5pp · 2024: 9.7pp
- All cycles
- 2024: D+9.7 2020: D+14.7 2016: D+4.8 2012: D+15.6 2008: D+17.5
Not yet ingested
- Civics
- —
Market trends
- HPI YoY
- ▼ -264.53%
- Current HPI
- 421.1138
- Rent YoY
- ▲ 3.65%
- Metro
- Buffalo-Cheektowaga, NY
- State GDP YoY
- ▲ 2.60%
- F500 in state
- 92
Industry mix (Fortune 500 HQ in NY)
| Industry | F500 HQs | Revenue |
|---|---|---|
| Financial Services | 10 | $950B |
|
||
| Consumer Goods | 9 | $162B |
|
||
| Insurance | 4 | $225B |
|
||
| Telecommunications | 2 | $144B |
|
||
| Pharmaceuticals | 2 | $112B |
|
||
| Media / Entertainment | 2 | $69B |
|
||
Price history
2 events — show timeline
- 2026-05-22 Pending — WNYREIS
- 2026-05-14 Listed $364,900 WNYREIS
Property tax history
+6.3%/yrLatest (2025): $1,281 · +27.7% YoY. Source: county tax records.
Cash-flow waterfall
monthlySold comps — $/sqft
last 12 mo · ≤1 miLoading sold comps…