 🌊 Lakefront
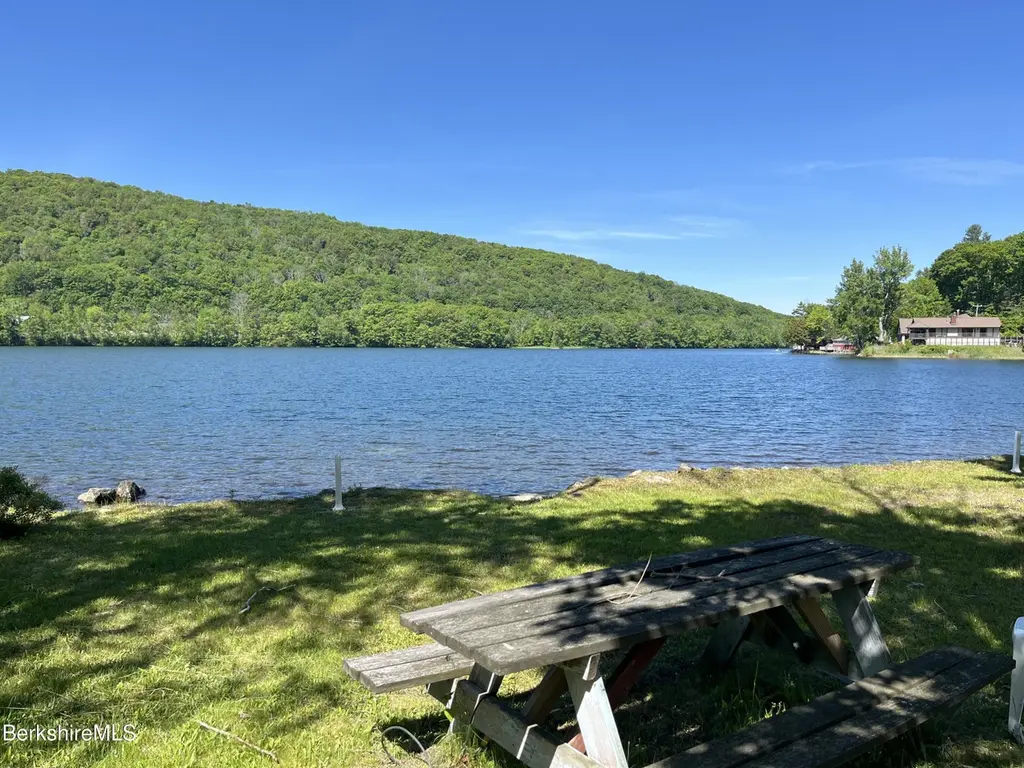
3664 Jacobs Ladder Rd · Lee, MA
Flood risk 10/10 · Severe
- FEMA flood zone
- X
- Chance of flooding over 30 yrs
- 1.0%
- Est. flood insurance / yr
- $507 – $1,088
Fire risk 2/10 · Minimal
- Est. fire insurance / yr
- $915 – $1,699
Heat risk 2/10 · Minimal
- Hot days now (above 89°F)
- 7 days/yr
- Hot days in 30 yrs
- 17 days/yr
Wind risk 4/10 · Minor
- Chance of severe wind over 30 yrs
- 13.0%
Air-quality risk 2/10 · Minimal
- Unhealthy air days now
- 1 days/yr
- Unhealthy air days in 30 yrs
- 1 days/yr
Risk factors via First Street. Map © Google.
Why this score? — see what drove the D grade
The composite is a weighted blend of 9 inputs, each scored 0–100. Each bar is that input's sub-score; the figure is the points it added to the 100-point composite (weight × sub-score).
- Appreciation +10.0/10.0
- Cash flow +8.0/30.0
- ARV discount +7.5/15.0
- Livability +3.7/5.0
- Schools +3.5/10.0
- Rent growth +2.5/5.0
- Condition / age +2.5/5.0
- DSCR +2.0/10.0
- 1% rule +1.7/10.0
$225,000
🖨 Deal sheet 📄 Offer letter ✓ Due diligence
Listing remarks
Enjoy life on Greenwater Pond in the Berkshires! The views, boating, fishing or just relax and at the end of the day watch the beautiful sunsets all from your little piece of lakefront heaven. I'll let the pictures speak for themselves. This property features a cottage with 3 Bedrooms, eat-in Kitchen and 1 full bath, a large barn and storage shed. Just about a 4 mile trip to the town of Lee and the entrance of the Mass Pike. Whether you're planning to move here or already call it home, you know why we love living in the Berkshires!
Key facts
- Lakefront
- Boating
- Cottage
Tags
Property features AI
Exterior
- Parking: Off-street parking
- Utilities: 100 Amp electric service with circuit breakers; Private sewer
- Home design: Fixer condition
- Construction: Metal roof; Total building area 1222
- Exterior features: Barn/Stable; Outbuilding; Frontage on water; Motorized vehicles allowed on waterfront
Interior
- Kitchen: Refrigerator
- Bedrooms: 5 total rooms (includes kitchen; specific bedroom locations not provided)
- Flooring: Carpet; Linoleum
- Bathrooms: 1 full bathroom; 0 half bathrooms
- Heating & cooling: Propane heating; Has heating
- Interior features: Bay/Bow window
- Laundry & utility: Washer; Dryer
Neighborhood map
What this means for you Summary
Snapshot
- This is a 2-bed/1.0-bath single-family listed at $225k.
Deal economics
- At list price, monthly cash flow is $-301 ($-4k/yr) — negative.
- To cash-flow at today's rent, offer at most $172k (23.6% below list).
- To meet the 1% rule (rent ≥ 1% of price), the offer needs to be $150k (33.2% below list).
- Recommended offer: $150k (33.2% below list) — sets the bar for 1% rule.
- Cap rate 5.0% vs local median 2.1% in Lee — top-decile yield for the area; either an underpriced asset or a hidden risk that comps aren't pricing in. Stress-test before assuming the spread holds.
Location & tenants
- Location reads 74/100 on livability (#88 in MA, #4,582 nationally) — a middle-class / working-renter tenant base. Strengths: housing A+, health & safety A+, crime B+; Watch: cost of living C-, amenities F.
- Central Berkshire (rural): math 32% / reading 47% proficiency, ranked #206 of 302 in MA (top 68%) — families likely to look elsewhere, expect single-tenant / working-renter base with shorter leases.
- Zoned schools: Becket Washington School (math 34% / reading 54%, grade F, #421 of 938 statewide, top 48%, 100 students, 0% FRL); Nessacus Regional Middle School (math 27% / reading 44%, grade F, #175 of 305 statewide, top 58%, 345 students, 0% FRL); Wahconah Regional High (math 47% / reading 62%, grade C-, #157 of 343 statewide, top 47%, 485 students, 0% FRL) — zoned schools average 0% FRL vs 26% district-wide (26 pts lower); this property's tenant base skews higher-income than the district average.
- Market conditions: 73 active listings in the ZIP; 130 units permitted in Berkshire County in 2024 (10 in 5+ unit buildings).
Forward outlook
- In year one you build about $24k of equity ($2k loan paydown + $22k appreciation (10.0% local appreciation)).
- Berkshire County population projected at -24% by 2050 — secular population decline; favor cash flow + early exit over multi-decade hold.
- By year 2, paydown + projected appreciation supports a ~$39k cash-out refi (75% LTV) — recoverable capital for the next deal without selling this one.
Negotiation context
- Only 1 days on market — expect competitive offers; lowballing is unlikely to land.
- 3 sale attempts since 19y ago with the ask held roughly flat each time — persistent listings suggest the price (not the market) is what's stuck; bring a comps-based counter.
Risks & watch-outs
- Watch-outs: flood insurance adds $66/mo.
- Climate carrying-cost: severe flood risk — expect insurance premiums to compound above CPI over the hold.
Questions for the listing agent
- What do current leases actually rent for vs. the listed asking? Can we see a recent rent roll and the last 12 months of T-12 income?
- Built in 1960 — when were the roof, HVAC, electrical panel, plumbing, and water heater last replaced?
- What's the actual annual flood-insurance premium (NFIP or private), and is the property in a SFHA with mandatory coverage?
- Is there a deadline driving the sale (1031 exchange, divorce, estate, relocation)? That informs how much negotiation room exists.
- The area grade is low — what's the realistic commute time and amenity access for the typical tenant pool here? Any planned neighborhood developments (good or bad) we should know about?
- This sits on a lake — are riparian / water-frontage rights deeded with the parcel? Any dock permits, shoreline easements, or HOA water-use restrictions?
- What's the documented flood / surge / shoreline-erosion history here (FEMA AND non-FEMA — e.g., storm surge, creek backup, septic-field saturation)?
- Any water-quality or seasonal algae-bloom issues that affect tenant satisfaction or short-term-rental demand?
- What's the average days-on-market for RENTAL listings here right now (not sales)? A rising rental-DOM trend means longer vacancies and softer asking-rent achievability than the comps imply.
- What's the recent tenant-quality profile in this submarket — average credit score on applications, eviction rate, late-payment / NSF rate, and stable-employment percentage? A property-management company in the area should have these aggregated.
- How much new for-sale + rental construction is in the pipeline within 1–3 miles? Heavy new supply typically softens prices + rents 12–24 months out; constrained supply supports both.
Investment metrics
- 1% rule
- 0.67% ✗
- Cap rate
- 5.04%
- Cash-on-cash
- -4.46%
- DSCR
- 0.80
- GRM
- 12.5
CMA / ARV
- ARV (on-the-fly)
- $43,992
- Comps found
- 1
Show comp detail 1 sale within ~0.75 mi
| Address | Dist | Beds/Ba | Sqft | Sold | Price | $/sf | Match |
|---|---|---|---|---|---|---|---|
| 3650 Jacobs Ladder Rd | 0.04mi | 3/1.0 (+1) | 1,176 (-4%) | 1mo | $42,500 | $36 | 86 |
Match score weights: distance 35% · size 25% · config 20% · recency 20%. Top-matched comps best support the ARV.
Projected returns pro-forma
10.0% appreciation · 3.0% rent growth · sell at horizon
- IRR
- 20.2%
- Equity multiple
- 2.64×
- Total profit
- $103,360
- Equity at exit
- $202,698
- IRR
- 18.5%
- Equity multiple
- 6.07×
- Total profit
- $319,411
- Equity at exit
- $437,126
Cash invested: $63,000 (down + closing). Projections, not guarantees.
Landlord ↔ Tenant lean methodology
- Overall (STATE)
- 20 Strongly Tenant-Friendly
- State Massachusetts
- 20 Strongly Tenant-Friendly · D+15
- County
- — inherits STATE
- City
- — inherits STATE
ZIP-level market 01223
- Home prices YoY
- 6.8%
- Active inventory
- 73
- Price-to-rent
- 12.5×
Monthly cashflow live
- Estimated rent
- $1,502 medium interval (Pro) →
- Mortgage (P&I)
- −$1,180
- Tax from tax record
- −$147 /mo · $1,769/yr
- Insurance
- −$94
- Flood insurance flood zone
- −$66 /mo · $798/yr
- HOA
- −$0
- Vacancy / Maint / Mgmt
- −$315
- Net cashflow
- $-301
Break-even live
UW: 25.0% down · 7.5% · 30yr · 1.5% tax · 5.0% vac · 8.0% maint · 8.0% mgmt
Financing live
Cash to close
- Down payment
- $56,250
- Closing costs
- $6,750
- Reserves months
- —
- Total cash needed
- —
Loan-product check · same deal, 3 products live
Conventional
25% down · 7.5% · 30yr
- Down + closing
- —
- Monthly P&I
- —
- Monthly cashflow
- —
- DSCR
- —
- Eligible?
- —
Personal DTI + credit; lowest rate.
DSCR
20% down · 8.5% · 30yr
- Down + closing
- —
- Monthly P&I
- —
- Monthly cashflow
- —
- DSCR
- —
- Eligible?
- —
No personal income docs; deal must DSCR.
Hard money
10% down · 12.0% · 12mo
- Down + closing
- —
- Monthly P&I
- —
- Monthly cashflow
- —
- DSCR
- —
- Eligible?
- —
Short-term bridge; refi at stabilization.
Listing history 2 events
-
2026-06-18remarks 537-char remark
-
2026-06-18$225,000 Active 1 DOM
ⓘ Source: listings_history table (triggers on properties + properties_extension) + one-shot
backfill from property_details.listing_events for pre-trigger history.
Tax reassessment forecast MA · Partial reset (capped growth)
- Current annual tax
- $1,769 · $147/mo
- Projected year-2 tax
- $2,268 · $189/mo
- Expected delta
- +$499/yr (+$42/mo · 28.2%)
ⓘ Screening estimate from a state-policy table — verify with the county assessor before closing.
Climate risk First Street
- Flood 10/10 Extreme FEMA zone X · 100% chance over 30 yrs
- Wildfire 2/10 Low
- Heat 2/10 Low 7 d/yr ≥89°F today · 17 d/yr by 30 yrs out
- Wind 4/10 Moderate 13% chance of damaging wind over 30 yrs
- Air quality 2/10 Low 1 unhealthy d/yr today · 1 by 30 yrs out
Nearby sold comps map
Loading sold comps map…
Walkable amenities ~0.75 mi
Loading nearby amenities…
Taxation est. · year 1
- Rental income
- $18,026
- − Mortgage interest
- −$12,603
- − Property taxes
- −$1,769
- − Insurance
- −$1,922
- − Repairs & maintenance
- −$1,442
- − Management
- −$1,442
- − Depreciation
- −$6,545
- Taxable loss
- −$7,699
- Est. tax savings @ 24.0%
- +$1,848
- After-tax cash flow
- $-1,763/yr
For passive investors: Depreciation is non-cash, so a rental often shows a tax loss while cash-flowing — sheltering income. Rental losses are passive: they offset passive income freely, and up to $25,000/yr can offset ordinary (W-2) income if you actively participate and your MAGI is under $100k (phasing out to $0 by $150k); unused losses carry forward. On sale, claimed depreciation is recaptured at up to 25%, and gains may owe capital-gains tax (a 1031 exchange can defer both). Figures are a year-1 estimate at your 24.0% rate — not tax advice; consult a CPA.
Schools (NCES district)
- District
- Central Berkshire
- NCES district ID
- 2503390
- Math proficiency
- 32% ▼ -13.00%
- Reading proficiency
- 47% ▲ 1.00%
- Median HH income
- $58,145
- Composite
- 34.8/100
- National rank
- #5108
- State rank
- #206 of 302 in MA
Livability — Lee
- Score
- 74/100
- State rank
- #88
- US rank
- #4582
Category grades
Schools grade is shown separately in the Schools card above.
Census & demographics
- Population (ZIP)
- 2,588
Population outlook (Berkshire County) Hauer SSP2
- Today (2025)
- 119,723 people
- By 2030
- 114,608 · -4.3%
- By 2040
- 102,806 · -14.1%
- By 2050
- 91,305 · -23.7%
- By 2075
- 71,517 · -40.3%
- By 2100
- 57,988 · -51.6%
Race, ethnicity, and origin ACS 2023
- Neighborhood character
- Predominantly White (91%)
- Race & ethnicity
- White 91% Two or more races 6% Hispanic / Latino 3% Asian 1%
- Common ancestry
- Lithuanian 10% Romanian 6% Slovak 2%
- Foreign-born
- 5%
- Languages at home
- 93% English-only · Russian/Polish/Slavic 2% Other Indo-European 1% Spanish 1%
Political lean MEDSL · Berkshire
- 2024 margin
- Solid D (+39.9) · D 68.9% · R 29.0% · Other 2.1%
- 2008→2024 swing
- -12.5pp toward R · 2008: 52.4pp · 2024: 39.9pp
- All cycles
- 2024: D+39.9 2020: D+47.1 2016: D+41.5 2012: D+53.7 2008: D+52.4
Not yet ingested
- Civics
- —
Market trends
- HPI YoY
- ▲ 19.33%
- Current HPI
- 305.8977
- Rent YoY
- —
- Metro
- —
- State GDP YoY
- ▲ 2.28%
- F500 in state
- 38
Industry mix (Fortune 500 HQ in MA)
| Industry | F500 HQs | Revenue |
|---|---|---|
| Technology | 3 | $17B |
|
||
| Insurance | 2 | $84B |
|
||
| Retail | 2 | $76B |
|
||
| Life Sciences | 1 | $43B |
|
||
| Energy Technology | 1 | $31B |
|
||
| Aerospace / Defense | 1 | $18B |
|
||
Price history
-16.6% since first listed5 events — show timeline
- 2026-06-11 Listed $225,000 BCMLS
- 2009-05-06 Listing Removed — BCMLS
- 2008-10-01 Listed $269,900 BCMLS
- 2008-09-04 Listing Removed — BCMLS
- 2007-10-04 Listed $269,900 BCMLS
Property tax history
+3.3%/yrLatest (2023): $1,769 · +35.7% YoY. Source: county tax records.
Cash-flow waterfall
monthlySold comps — $/sqft
last 12 mo · ≤1 miLoading sold comps…