26 10th St W #607 · St. Paul, MN
Flood risk 1/10 · Minimal
- FEMA flood zone
- X (unshaded)
- Chance of flooding over 30 yrs
- 0.0%
- Est. flood insurance / yr
- $473 – $860
Fire risk 1/10 · Minimal
- Est. fire insurance / yr
- $888 – $1,650
Heat risk 2/10 · Minimal
- Hot days now (above 99°F)
- 7 days/yr
- Hot days in 30 yrs
- 14 days/yr
Wind risk 2/10 · Minimal
- Chance of severe wind over 30 yrs
- —
Air-quality risk 2/10 · Minimal
- Unhealthy air days now
- 1 days/yr
- Unhealthy air days in 30 yrs
- 1 days/yr
Risk factors via First Street. Map © Google.
Why this score? — see what drove the C grade
The composite is a weighted blend of 9 inputs, each scored 0–100. Each bar is that input's sub-score; the figure is the points it added to the 100-point composite (weight × sub-score).
- Cash flow +22.8/30.0
- 1% rule +10.0/10.0
- ARV discount +7.5/15.0
- DSCR +7.3/10.0
- Rent growth +2.9/5.0
- Livability +2.5/5.0
- Condition / age +2.5/5.0
- Schools +2.4/10.0
- Appreciation +0.0/10.0
$135,000
🖨 Deal sheet 📄 Offer letter ✓ Due diligence
Listing remarks MLS
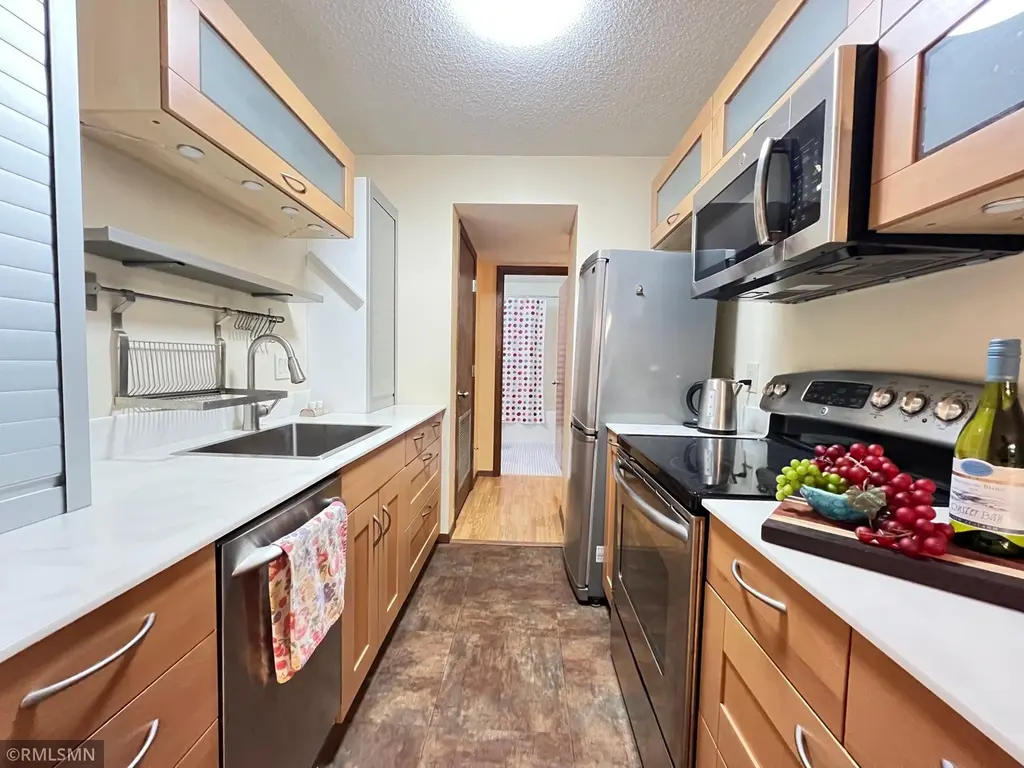
Wonderful unit in Gallery Towers. Private balcony, tasteful decor, well-maintained unit. Building offers spa, sauna, gym, party room and contract underground parking.
Key facts
- $721 HOA
- Garage
- Built 1980
Property features AI
Finance
- Other: Lot size approximately 0.526 acres (common/parcel info)
- Financial info: Association fee amount provided monthly
- HOA & community: HOA managed by Cedar Management; Monthly association fee; Association amenities include elevator(s), controlled access, fire sprinkler system, shared amenities, snow removal, professional management; Association fee covers air conditioning, heating, cable TV, sewer, hazard insurance, beach access, and more
Exterior
- Parking: Attached garage; Parking garage; Additional onsite paid parking; Underground parking; Unassigned parking
- Security: Controlled access (association amenity); Fire sprinkler system (association amenity)
- Utilities: City water connected; City sewer connected; Fuel: Other
- Home design: Attached residential property; One level; Unit in a multi-story building (unit #607); Accessible design features
- Construction: Concrete construction elements (association/common areas)
- Exterior features: Stone exterior; City street frontage; Publicly maintained road access; Balcony with city view
Interior
- Kitchen: Dishwasher; Microwave; Refrigerator
- Bedrooms: 2 bedrooms (both on the main level)
- Flooring: Concrete floors and walls in common/association areas
- Bathrooms: 1 full bathroom (main floor)
- Heating & cooling: Forced air heating; Central air conditioning
- Interior features: Balcony with city view; Accessible elevator installed; Wide hallways (42"+); No exterior stairs; No interior stairs; Informal dining area; Dishwasher; Microwave; Refrigerator; Forced air heating; Central air conditioning
- Laundry & utility: No specific laundry details provided
Neighborhood map
What this means for you Summary
Snapshot
- This is a 2-bed/1.0-bath condo listed at $135k.
Deal economics
- At list price, monthly cash flow is $234 ($3k/yr) — positive.
- The deal already cash-flows at list — no discount required.
- Meets the 1% rule at list price ($2k rent vs $135k).
- Recommended offer: $131k (3.0% below list) — sets the bar for market timing.
Location & tenants
- Location reads: area grade C — affects rentability + tenant quality, not the cash-flow math above.
- St. Paul Public School District (urban): math 21% / reading 33% proficiency, ranked #270 of 301 in MN (top 90%) — low school quality limits family demand, transient renter base, plan for 1-2y turnover; 64% free/reduced lunch — lower-income household profile, screen leases tightly.
- Market conditions: Rents rising (+1.6%/yr); 145 active listings in the ZIP; 11 comparable units currently listed for rent nearby; rentals leasing fast (median 3d on market — plan ~1-2 weeks tenant-placement turnaround); solid renter incomes; 1,202 units permitted in Ramsey County in 2024 (880 in 5+ unit buildings).
- This rent runs 38% of the median local income ($76k/yr) — at the standard rent-burdened threshold; future hikes will face affordability resistance.
Forward outlook
- Local home prices are declining (-3.0%/yr); year-one equity from $933 of loan paydown is wiped out by about $4k of value loss. Plan a longer hold.
- Ramsey County population projected at +27% by 2050 — long-run rental-demand tailwind backs the buy-and-hold thesis.
Negotiation context
- It's been on market 44 days — a 3% lower offer ($131k) is reasonable based on typical stale-listing flexibility.
- 7 sale attempts since 24y ago with the ask held roughly flat each time — persistent listings suggest the price (not the market) is what's stuck; bring a comps-based counter.
- Current owner paid $46k; list at $135k implies a 196% gain — meaningful room to come down on a strong offer.
Risks & watch-outs
- Watch-outs: HOA is 30% of rent.
Questions for the listing agent
- It's been on market 44 days. Have you received any prior offers? Is the seller open to a 3% concession, seller financing, or rate buy-down credit?
- What does the HOA fee cover, when was the last increase, and are there any pending special assessments or reserve-fund shortfalls?
- Any open or pending special assessments — roof, HVAC, plumbing, elevator, façade? What's the per-unit balance and payoff schedule, and is the seller paying it off at close or rolling it to the buyer?
- Is there a deadline driving the sale (1031 exchange, divorce, estate, relocation)? That informs how much negotiation room exists.
- What's the average days-on-market for RENTAL listings here right now (not sales)? A rising rental-DOM trend means longer vacancies and softer asking-rent achievability than the comps imply.
- What's the recent tenant-quality profile in this submarket — average credit score on applications, eviction rate, late-payment / NSF rate, and stable-employment percentage? A property-management company in the area should have these aggregated.
- How much new apartment / multifamily construction is in the pipeline within 1–3 miles? Heavy new supply (>2% of stock underway) typically softens rents 12–24 months out; light construction supports rent growth.
Investment metrics
- 1% rule
- 1.79% ✓
- Cap rate
- 8.37%
- Cash-on-cash
- 7.42%
- DSCR
- 1.33
- GRM
- 4.7
CMA / ARV
No comps found within radius.
Projected returns pro-forma
-3.0% appreciation · 1.6% rent growth · sell at horizon
- IRR
- -7.2%
- Equity multiple
- 0.74×
- Total profit
- $-9,858
- Equity at exit
- $20,129
- IRR
- -0.3%
- Equity multiple
- 0.98×
- Total profit
- $-809
- Equity at exit
- $11,672
Cash invested: $37,800 (down + closing). Projections, not guarantees.
Landlord ↔ Tenant lean methodology
- Overall (STATE)
- 46 Balanced
- State Minnesota
- 46 Balanced · D+2
- County
- — inherits STATE
- City
- — inherits STATE
ZIP-level market 55102
- Rents YoY
- 1.6%
- Active inventory
- 145
- Price-to-rent
- 4.7×
Monthly cashflow live
- Estimated rent
- $2,415 high interval (Pro) →
- Mortgage (P&I)
- −$708
- Tax from tax record
- −$189 /mo · $2,272/yr
- Insurance
- −$56
- HOA
- −$721
- Vacancy / Maint / Mgmt
- −$507
- Net cashflow
- $234
Break-even live
UW: 25.0% down · 7.5% · 30yr · 1.5% tax · 5.0% vac · 8.0% maint · 8.0% mgmt
Financing live
Cash to close
- Down payment
- $33,750
- Closing costs
- $4,050
- Reserves months
- —
- Total cash needed
- —
Loan-product check · same deal, 3 products live
Conventional
25% down · 7.5% · 30yr
- Down + closing
- —
- Monthly P&I
- —
- Monthly cashflow
- —
- DSCR
- —
- Eligible?
- —
Personal DTI + credit; lowest rate.
DSCR
20% down · 8.5% · 30yr
- Down + closing
- —
- Monthly P&I
- —
- Monthly cashflow
- —
- DSCR
- —
- Eligible?
- —
No personal income docs; deal must DSCR.
Hard money
10% down · 12.0% · 12mo
- Down + closing
- —
- Monthly P&I
- —
- Monthly cashflow
- —
- DSCR
- —
- Eligible?
- —
Short-term bridge; refi at stabilization.
Rent comps 11 comps
| Address | Beds | Baths | Sqft | Rent | $/sqft | DOM | Units | Dist |
|---|---|---|---|---|---|---|---|---|
| 101 10th St E Saint Paul, MN | 3.0 | 1.0–2.0 | 887 | $2,051 | $2.31 | 2d | 25 | 0.24mi |
| 253 Kellogg Blvd W Saint Paul, MN | 2.0 | 1.0–2.0 | 1208 | $3,198 | $2.65 | 3d | 12 | 0.29mi |
| 141 4th St E Saint Paul, MN | 2.0 | 1.0–2.0 | 811 | $2,420 | $2.98 | 20d | 20 | 0.48mi |
| 111 Kellogg Blvd E Saint Paul, MN | 3.0 | 1.0–2.0 | 1000 | $2,266 | $2.27 | 2d | 20 | 0.50mi |
| 333 Sibley St Saint Paul, MN | 3.0 | 1.0–2.0 | 1358 | $2,577 | $1.90 | 10d | 10 | 0.53mi |
| 240 5th St E St Paul, MN | 2.0 | 1.0–2.0 | 949 | $2,770 | $2.92 | 2d | 10 | 0.58mi |
| 250 6th St E St Paul, MN | 2.0 | 1.0–2.0 | 980 | $2,868 | $2.93 | 2d | 16 | 0.58mi |
| 180 E Kellogg Blvd St Paul, MN | 3.0 | 1.0–2.5 | 1436 | $3,467 | $2.41 | 2d | 22 | 0.61mi |
| 330 9th St E St Paul, MN | 1.0–2.0 | 1.0 | 978 | $2,495 | $2.55 | 3d | 3 | 0.64mi |
| 255 Western Ave N Saint Paul, MN | 3.0 | 1.0–2.0 | 1049 | $2,940 | $2.80 | 2d | 23 | 0.87mi |
| 400 Spring St Saint Paul, MN | 1.0–2.0 | 1.0–2.0 | 1205 | $3,275 | $2.72 | 3d | 31 | 0.93mi |
HOA detail condo
- Monthly dues
- $721 · $8,652/yr
- Likely covers
- gym
- Assessments
- None detected in remarks — confirm with the listing agent.
Listing history 31 events
-
2026-06-18days on market $135,000 Active 44 DOM
-
2026-06-17days on market $135,000 Active 43 DOM
-
2026-06-16days on market $135,000 Active 42 DOM
-
2026-06-15days on market $135,000 Active 41 DOM
-
2026-06-13days on market $135,000 Active 39 DOM
-
2026-06-09days on market $135,000 Active 35 DOM
-
2026-06-08days on market $135,000 Active 34 DOM
-
2026-06-07days on market $135,000 Active 33 DOM
-
2026-06-04days on market $135,000 Active 30 DOM
-
2026-06-03days on market $135,000 Active 29 DOM
-
2026-06-02days on market $135,000 Active 28 DOM
-
2026-06-01days on market $135,000 Active 27 DOM
-
2026-05-31days on market $135,000 Active 26 DOM
-
2026-05-02$135,000 Active 839-char remark
-
2025-03-01historical
-
2025-01-13price $144,000
-
2024-09-11$149,000 Active
-
2011-06-08soldstatus $45,675
Show marketing remark (166 chars)
Wonderful unit in Gallery Towers. Private balcony, tasteful decor, well-maintained unit. Building offers spa, sauna, gym, party room and contract underground parking.
-
2011-05-26historical
Show marketing remark (166 chars)
Wonderful unit in Gallery Towers. Private balcony, tasteful decor, well-maintained unit. Building offers spa, sauna, gym, party room and contract underground parking.
-
2011-01-31$54,000
Show marketing remark (166 chars)
Wonderful unit in Gallery Towers. Private balcony, tasteful decor, well-maintained unit. Building offers spa, sauna, gym, party room and contract underground parking.
-
2010-11-30historical
-
2010-01-13$79,900
-
2004-06-02historical
-
2003-12-02$123,500
-
2003-11-30historical
-
2003-07-23$127,500
-
2002-11-08soldstatus $117,000
-
2002-10-11soldstatus $117,000
-
2002-09-21historical
-
2002-05-17$117,000
-
1998-02-26soldstatus $36,000
ⓘ Source: listings_history table (triggers on properties + properties_extension) + one-shot
backfill from property_details.listing_events for pre-trigger history.
Tax reassessment forecast MN · Partial reset (capped growth)
- Current annual tax
- $2,272 · $189/mo
- Projected year-2 tax
- $2,272 · $189/mo
- Expected delta
- $0/yr ($0/mo · 0.0%)
ⓘ Screening estimate from a state-policy table — verify with the county assessor before closing.
Climate risk First Street
- Flood 1/10 Low FEMA zone X (unshaded) · 0% chance over 30 yrs
- Wildfire 1/10 Low
- Heat 2/10 Low 7 d/yr ≥99°F today · 14 d/yr by 30 yrs out
- Wind 2/10 Low
- Air quality 2/10 Low 1 unhealthy d/yr today · 1 by 30 yrs out
Nearby sold comps map
Loading sold comps map…
Walkable amenities ~0.75 mi
Loading nearby amenities…
Taxation est. · year 1
- Rental income
- $28,985
- − Mortgage interest
- −$7,562
- − Property taxes
- −$2,272
- − Insurance
- −$675
- − Repairs & maintenance
- −$2,319
- − Management
- −$2,319
- − HOA
- −$8,652
- − Depreciation
- −$3,927
- Taxable income
- $1,259
- Est. tax owed @ 24.0%
- −$302
- After-tax cash flow
- $2,502/yr
For passive investors: Depreciation is non-cash, so a rental often shows a tax loss while cash-flowing — sheltering income. Rental losses are passive: they offset passive income freely, and up to $25,000/yr can offset ordinary (W-2) income if you actively participate and your MAGI is under $100k (phasing out to $0 by $150k); unused losses carry forward. On sale, claimed depreciation is recaptured at up to 25%, and gains may owe capital-gains tax (a 1031 exchange can defer both). Figures are a year-1 estimate at your 24.0% rate — not tax advice; consult a CPA.
Schools (NCES district)
- District
- St. Paul Public School District
- NCES district ID
- 2733840
- Math proficiency
- 21% ▼ -11.00%
- Reading proficiency
- 33% ▼ -7.00%
- Median HH income
- $48,316
- Composite
- 23.51/100
- National rank
- #7868
- State rank
- #270 of 301 in MN
Livability — St. Paul
No livability data for this city. (Only ~50 U.S. cities are tracked.)
Census & demographics
- Census place
- St. Paul, MN
- County
- Ramsey County · 542,837 people
- City population
- 280,599
- Metro
- Minneapolis-St. Paul-Bloomington, MN-WI
- Population (ZIP)
- 19,630
- Household income
- $76,406
- Rent vs Own
- Severe rent burden
- 1116.0
Population outlook (Ramsey County) Hauer SSP2
- Today (2025)
- 603,431 people
- By 2030
- 636,459 · +5.5%
- By 2040
- 700,596 · +16.1%
- By 2050
- 765,819 · +26.9%
- By 2075
- 929,297 · +54.0%
- By 2100
- 1,053,924 · +74.7%
Race, ethnicity, and origin ACS 2023
- Neighborhood character
- Predominantly White (77%)
- Race & ethnicity
- White 77% Black 10% Two or more races 6% Hispanic / Latino 5% Asian 3%
- Hispanic origin (detail)
- Mexican 4%
- Common ancestry
- Portuguese 10% Lithuanian 5% Romanian 3%
- Foreign-born
- 9% · Canada, South Korea
- Languages at home
- 87% English-only · Spanish 4% Other Indo-European 1% German/W. Germanic 1%
Political lean MEDSL · Ramsey
- 2024 margin
- Solid D (+43.3) · D 70.5% · R 27.2% · Other 2.3%
- 2008→2024 swing
- +9.4pp toward D · 2008: 33.9pp · 2024: 43.3pp
- All cycles
- 2024: D+43.3 2020: D+45.4 2016: D+39.4 2012: D+35.3 2008: D+33.9
Not yet ingested
- Civics
- —
Market trends
- HPI YoY
- ▼ -217.83%
- Current HPI
- 241.7112
- Rent YoY
- ▲ 1.60%
- Metro
- Minneapolis-St. Paul-Bloomington, MN-WI
- State GDP YoY
- ▲ 2.41%
- F500 in state
- 34
Industry mix (Fortune 500 HQ in MN)
| Industry | F500 HQs | Revenue |
|---|---|---|
| Healthcare | 2 | $407B |
|
||
| Retail | 2 | $150B |
|
||
| Consumer Goods | 2 | $32B |
|
||
| Industrial Machinery | 2 | $6B |
|
||
| Agriculture | 1 | $40B |
|
||
| Healthcare / Medical Devices | 1 | $32B |
|
||
Price history
+275.0% since first listed18 events — show timeline
- 2026-05-02 Listed $135,000 NORTHSTARMLS as Distributed by MLS Grid
- 2025-03-01 Listing Removed — NORTHSTARMLS as Distributed by MLS Grid
- 2025-01-13 Price Changed $144,000 NORTHSTARMLS as Distributed by MLS Grid
- 2024-09-11 Listed $149,000 NORTHSTARMLS as Distributed by MLS Grid
- 2011-06-08 Sold (MLS) $45,675 NORTHSTARMLS as Distributed by MLS Grid
- 2011-05-26 Listing Removed — NORTHSTARMLS as Distributed by MLS Grid
- 2011-01-31 Listed $54,000 NORTHSTARMLS as Distributed by MLS Grid
- 2010-11-30 Listing Removed — NORTHSTARMLS as Distributed by MLS Grid
- 2010-01-13 Listed $79,900 NORTHSTARMLS as Distributed by MLS Grid
- 2004-06-02 Listing Removed — NORTHSTARMLS as Distributed by MLS Grid
- 2003-12-02 Listed $123,500 NORTHSTARMLS as Distributed by MLS Grid
- 2003-11-30 Listing Removed — NORTHSTARMLS as Distributed by MLS Grid
- 2003-07-23 Listed $127,500 NORTHSTARMLS as Distributed by MLS Grid
- 2002-11-08 Sold (Public Records) $117,000 Public Records
- 2002-10-11 Sold (MLS) $117,000 NORTHSTARMLS as Distributed by MLS Grid
- 2002-09-21 Listing Removed — NORTHSTARMLS as Distributed by MLS Grid
- 2002-05-17 Listed $117,000 NORTHSTARMLS as Distributed by MLS Grid
- 1998-02-26 Sold (Public Records) $36,000 Public Records
Property tax history
+5.2%/yrLatest (2025): $2,272 · +33.0% YoY. Source: county tax records.
Cash-flow waterfall
monthlySold comps — $/sqft
last 12 mo · ≤1 miLoading sold comps…