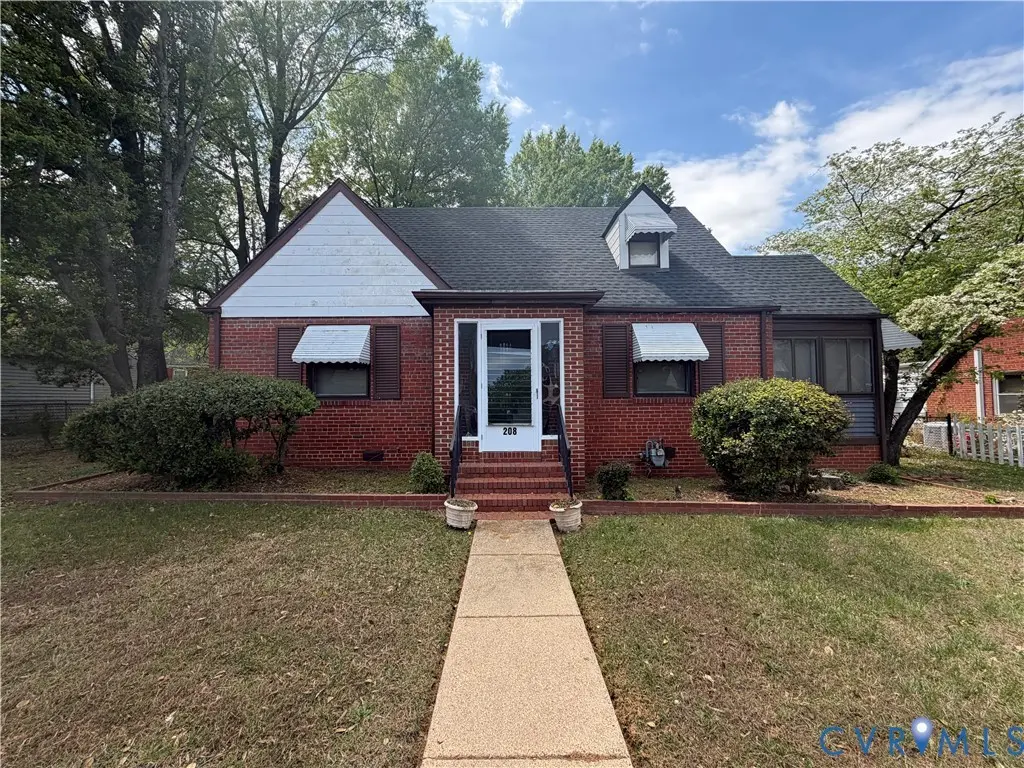
208 Winber Dr · Richmond, VA
Flood risk 1/10 · Minimal
- FEMA flood zone
- X (unshaded)
- Chance of flooding over 30 yrs
- 0.0%
- Est. flood insurance / yr
- $507 – $1,088
Fire risk 1/10 · Minimal
- Est. fire insurance / yr
- $666 – $1,236
Heat risk 7/10 · Major
- Hot days now (above 105°F)
- 7 days/yr
- Hot days in 30 yrs
- 16 days/yr
Wind risk 6/10 · Moderate
- Chance of severe wind over 30 yrs
- 27.0%
Air-quality risk 2/10 · Minimal
- Unhealthy air days now
- 1 days/yr
- Unhealthy air days in 30 yrs
- 1 days/yr
Risk factors via First Street. Map © Google.
Why this score? — see what drove the C+ grade
The composite is a weighted blend of 9 inputs, each scored 0–100. Each bar is that input's sub-score; the figure is the points it added to the 100-point composite (weight × sub-score).
- Cash flow +27.1/30.0
- DSCR +9.4/10.0
- ARV discount +7.5/15.0
- 1% rule +7.0/10.0
- Livability +4.2/5.0
- Rent growth +3.6/5.0
- Schools +3.3/10.0
- Condition / age +2.5/5.0
- Appreciation +0.0/10.0
$170,000
🖨 Deal sheet 📄 Offer letter ✓ Due diligence
Listing remarks
This property is for the INVESTORS!! This solid all brick 1955 sqft, 3 bedrooms, 1 full bathroom with 2 half bathrooms. This home will not past for FHA or a conventional loan. Seeking cash buyers and willing to close fast. The ARV is around $335K so will meet the needs if you are trying to flip or hold. Book a tour today!
Key facts
- 7,026 sq ft lot
- Built 1946
- Listed 7 days
Property features AI
Exterior
- Parking: Off-street parking; On-street parking
- Utilities: Public water; Public sewer
- Home design: Brick and frame construction; Composition roof; Single-story (total 1 story); Entry level is 2
- Construction: Brick and frame construction; Composition roof
- Exterior features: Full fenced yard
Interior
- Bedrooms: Total of 8 rooms (bedrooms and living spaces combined)
- Flooring: Carpet; Wood
- Bathrooms: One full bathroom; Two half bathrooms (one on first level, one on second level)
- Heating & cooling: Electric heating; Electric cooling
- Interior features: Carpet and wood flooring; Tub & shower in full bathroom
- Laundry & utility: Electric water heater
Neighborhood map
What this means for you Summary
Snapshot
- This is a 3-bed/1.5-bath single-family listed at $170k.
Deal economics
- At list price, monthly cash flow is $484 ($6k/yr) — positive.
- The deal already cash-flows at list — no discount required.
- Meets the 1% rule at list price ($2k rent vs $170k).
- Cap rate 9.7% vs local median 3.3% in Richmond — top-decile yield for the area; either an underpriced asset or a hidden risk that comps aren't pricing in. Stress-test before assuming the spread holds.
Location & tenants
- Location reads 84/100 on livability (#33 in VA, #793 nationally) — a professional / high-income tenant draw. Strengths: amenities A+, commute A+, health & safety A+; Watch: crime D-.
- Richmond City Public School District (urban): math 32% / reading 47% proficiency, ranked #123 of 131 in VA (top 94%) — families likely to look elsewhere, expect single-tenant / working-renter base with shorter leases; 74% free/reduced lunch — lower-income household profile, screen leases tightly.
- Market conditions: Rents rising fast (+4.5%/yr); 173 active listings in the ZIP; 14 comparable units currently listed for rent nearby; rentals at typical pace (median 24d on market — plan ~3-4 weeks tenant-placement turnaround); 2,540 units permitted in Richmond city in 2024 (2,077 in 5+ unit buildings).
- At $2,044/mo this rent would consume 49% of the median local household income ($50k/yr) (locally 3584% of renters already pay >50% of income on rent) — very limited rent-growth headroom before tenants either downsize or default.
Forward outlook
- Local home prices are declining (-3.0%/yr); year-one equity from $1k of loan paydown is wiped out by about $5k of value loss. Plan a longer hold.
- Richmond County population projected at +40% by 2050 — long-run rental-demand tailwind backs the buy-and-hold thesis.
- At projected returns (-3.0% appreciation + 4.5% rent growth), your $48k cash investment doubles in ~9 years — after that, you're playing with house money.
Negotiation context
- Only 7 days on market — expect competitive offers; lowballing is unlikely to land.
- Current owner paid $14k; list at $170k implies a 1072% gain — meaningful room to come down on a strong offer.
Risks & watch-outs
- Watch-outs: built in 1946 — expect roof / HVAC / electrical / plumbing capex.
- Climate carrying-cost: major wind risk, 27% chance of damaging wind over 30y; extreme-heat days projected 7→16/yr by 2055 (HVAC capex compounding) — expect insurance premiums to compound above CPI over the hold.
Questions for the listing agent
- Built in 1946 — when were the roof, HVAC, electrical panel, plumbing, and water heater last replaced?
- Is there a deadline driving the sale (1031 exchange, divorce, estate, relocation)? That informs how much negotiation room exists.
- Schools are A-rated — typically a magnet for longer-tenancy family renters. What's the average tenant stay here, and is there a school-zone premium baked into asking?
- Crime grade is D in this area — have there been break-ins, vandalism, or insurance claims at this property in the last 3 years? What carrier currently insures it and at what premium?
- What's the average days-on-market for RENTAL listings here right now (not sales)? A rising rental-DOM trend means longer vacancies and softer asking-rent achievability than the comps imply.
- What's the recent tenant-quality profile in this submarket — average credit score on applications, eviction rate, late-payment / NSF rate, and stable-employment percentage? A property-management company in the area should have these aggregated.
- How much new for-sale + rental construction is in the pipeline within 1–3 miles? Heavy new supply typically softens prices + rents 12–24 months out; constrained supply supports both.
Investment metrics
- 1% rule
- 1.20% ✓
- Cap rate
- 9.71%
- Cash-on-cash
- 12.20%
- DSCR
- 1.54
- GRM
- 6.9
CMA / ARV
- ARV (on-the-fly)
- $346,035
- Comps found
- 12
Show comp detail 12 sales within ~0.75 mi
| Address | Dist | Beds/Ba | Sqft | Sold | Price | $/sf | Match |
|---|---|---|---|---|---|---|---|
| 102 E 33rd St | 0.32mi | 4/2.0 (+1) | 1,804 (-8%) | 3mo | $265,000 | $147 | 62 |
| 3006 Midlothian Tpke | 0.66mi | 4/2.5 (+1) | 1,936 (-1%) | 1mo | $325,000 | $168 | 58 |
| 1008 E Belt Blvd | 0.48mi | 4/2.0 (+1) | 1,824 (-7%) | 5mo | $185,000 | $101 | 56 |
| 2904 Hull St | 0.71mi | 4/3.0 (+1) | 1,964 (+0%) | 0mo | $348,250 | $177 | 55 |
| 17 E Blake Ln | 0.48mi | 3/2.5 | 1,818 (-7%) | 8mo | $303,000 | $167 | 55 |
| 3105 1/2 Logandale Ave | 0.58mi | 3/2.5 | 1,815 (-7%) | 8mo | $380,000 | $209 | 50 |
| 1237 Greystone Ave | 0.64mi | 3/1.5 | 1,778 (-9%) | 6mo | $185,000 | $104 | 50 |
| 4009 Dunston Ave | 0.71mi | 4/2.5 (+1) | 2,038 (+4%) | 3mo | $675,000 | $331 | 48 |
| 2908 Lawson St | 0.68mi | 3/2.5 | 1,748 (-11%) | 2mo | $335,000 | $192 | 45 |
| 405 W 34th St | 0.68mi | 4/1.5 (+1) | 1,730 (-12%) | 0mo | $474,000 | $274 | 44 |
| 4004 Forest Hill Ave | 0.71mi | 3/2.5 | 2,203 (+13%) | 3mo | $545,000 | $247 | 39 |
| 3055 Midlothian Tpke | 0.63mi | 4/1.0 (+1) | 1,696 (-13%) | 8mo | $170,000 | $100 | 35 |
Match score weights: distance 35% · size 25% · config 20% · recency 20%. Top-matched comps best support the ARV.
Projected returns pro-forma
-3.0% appreciation · 4.55% rent growth · sell at horizon
- IRR
- 3.5%
- Equity multiple
- 1.14×
- Total profit
- $6,506
- Equity at exit
- $25,348
- IRR
- 14.4%
- Equity multiple
- 2.24×
- Total profit
- $59,069
- Equity at exit
- $14,698
Cash invested: $47,600 (down + closing). Projections, not guarantees.
Landlord ↔ Tenant lean methodology
- Overall (STATE)
- 55 Moderately Landlord-Leaning
- State Virginia
- 55 Moderately Landlord-Leaning · D+2
- County
- — inherits STATE
- City
- — inherits STATE
ZIP-level market 23224
- Rents YoY
- 4.5%
- Active inventory
- 173
- Price-to-rent
- 6.9×
Monthly cashflow live
- Estimated rent
- $2,044 high interval (Pro) →
- Mortgage (P&I)
- −$891
- Tax from tax record
- −$169 /mo · $2,028/yr
- Insurance
- −$71
- HOA
- −$0
- Vacancy / Maint / Mgmt
- −$429
- Net cashflow
- $484
Break-even live
UW: 25.0% down · 7.5% · 30yr · 1.5% tax · 5.0% vac · 8.0% maint · 8.0% mgmt
Financing live
Cash to close
- Down payment
- $42,500
- Closing costs
- $5,100
- Reserves months
- —
- Total cash needed
- —
Loan-product check · same deal, 3 products live
Conventional
25% down · 7.5% · 30yr
- Down + closing
- —
- Monthly P&I
- —
- Monthly cashflow
- —
- DSCR
- —
- Eligible?
- —
Personal DTI + credit; lowest rate.
DSCR
20% down · 8.5% · 30yr
- Down + closing
- —
- Monthly P&I
- —
- Monthly cashflow
- —
- DSCR
- —
- Eligible?
- —
No personal income docs; deal must DSCR.
Hard money
10% down · 12.0% · 12mo
- Down + closing
- —
- Monthly P&I
- —
- Monthly cashflow
- —
- DSCR
- —
- Eligible?
- —
Short-term bridge; refi at stabilization.
Rent comps 14 comps
| Address | Beds | Baths | Sqft | Rent | $/sqft | DOM | Units | Dist |
|---|---|---|---|---|---|---|---|---|
| 100 Mardick Rd Richmond, VA | 4.0 | 2.0 | 1254 | $2,250 | $1.79 | 23d | 1 | 0.29mi |
| 3314 Decatur St Richmond, VA | 2.0 | 1.5 | 1640 | $1,800 | $1.10 | 43d | 1 | 0.34mi |
| 3 E Blake Ln Richmond, VA | 3.0 | 1.5 | 2065 | $2,000 | $0.97 | 3d | 1 | 0.49mi |
| 216 Brandon Rd Richmond, VA | 3.0 | 1.0 | 1237 | $1,800 | $1.46 | 23d | 1 | 0.64mi |
| 152 Brandon Rd Richmond, VA | 3.0 | 1.0 | 1237 | $2,109 | $1.70 | 23d | 1 | 0.70mi |
| 1200 Southwood Pkwy Richmond, VA | 1.0–2.0 | 1.0–2.0 | 916 | $1,605 | $1.75 | 43d | 11 | 1.03mi |
| 2522 Porter St Richmond, VA | 3.0 | 2.5 | 1390 | $1,800 | $1.29 | 43d | 1 | 1.08mi |
| 1100 Richmond Hwy Richmond, VA | 1.0–3.0 | 1.0–2.0 | 1062 | $2,345 | $2.21 | 1d | 16 | 1.30mi |
| 2143 S Kinsley Ave Richmond, VA | 4.0 | 1.0 | 1297 | $1,550 | $1.20 | 43d | 1 | 1.31mi |
| 2117 Old Manchester St Richmond, VA | 3.0 | 4.0 | 1960 | $2,695 | $1.38 | 10d | 1 | 1.39mi |
| 2104 Boro Ridge St Richmond, VA | 3.0 | 2.5 | 1916 | $2,775 | $1.45 | 43d | 1 | 1.42mi |
| 1912 Porter St Richmond, VA | 3.0 | 1.5 | 1415 | $1,950 | $1.38 | 23d | 1 | 1.43mi |
| 1840 Powell Rd Richmond, VA | 2.0 | 1.0 | 1228 | $1,695 | $1.38 | 16d | 1 | 1.49mi |
| 4901 Warwick Rd Richmond, VA | 4.0 | 2.5 | 2540 | $2,750 | $1.08 | 20d | 1 | 1.49mi |
Listing history 3 events
-
2026-04-30status Pending
-
2026-04-23$170,000 Active
-
1967-01-04soldstatus $14,500
ⓘ Source: listings_history table (triggers on properties + properties_extension) + one-shot
backfill from property_details.listing_events for pre-trigger history.
Tax reassessment forecast VA · Resets to sale price
- Current annual tax
- $2,028 · $169/mo
- Projected year-2 tax
- $2,028 · $169/mo
- Expected delta
- $0/yr ($0/mo · 0.0%)
ⓘ Screening estimate from a state-policy table — verify with the county assessor before closing.
Climate risk First Street
- Flood 1/10 Low FEMA zone X (unshaded) · 0% chance over 30 yrs
- Wildfire 1/10 Low
- Heat 7/10 Severe 7 d/yr ≥105°F today · 16 d/yr by 30 yrs out
- Wind 6/10 Major 27% chance of damaging wind over 30 yrs
- Air quality 2/10 Low 1 unhealthy d/yr today · 1 by 30 yrs out
Nearby sold comps map
Loading sold comps map…
Walkable amenities ~0.75 mi
Loading nearby amenities…
Taxation est. · year 1
- Rental income
- $24,533
- − Mortgage interest
- −$9,523
- − Property taxes
- −$2,028
- − Insurance
- −$850
- − Repairs & maintenance
- −$1,963
- − Management
- −$1,963
- − Depreciation
- −$4,945
- Taxable income
- $3,262
- Est. tax owed @ 24.0%
- −$783
- After-tax cash flow
- $5,022/yr
For passive investors: Depreciation is non-cash, so a rental often shows a tax loss while cash-flowing — sheltering income. Rental losses are passive: they offset passive income freely, and up to $25,000/yr can offset ordinary (W-2) income if you actively participate and your MAGI is under $100k (phasing out to $0 by $150k); unused losses carry forward. On sale, claimed depreciation is recaptured at up to 25%, and gains may owe capital-gains tax (a 1031 exchange can defer both). Figures are a year-1 estimate at your 24.0% rate — not tax advice; consult a CPA.
Schools (NCES district)
- District
- Richmond City Public School District
- NCES district ID
- 5103240
- Math proficiency
- 32% ▼ -24.00%
- Reading proficiency
- 47% ▼ -9.00%
- Median HH income
- $40,276
- Composite
- 33.09/100
- National rank
- #5564
- State rank
- #123 of 131 in VA
Livability — Richmond
- Score
- 84/100
- State rank
- #33
- US rank
- #793
Category grades
Schools grade is shown separately in the Schools card above.
Census & demographics
- Census place
- Richmond, VA
- County
- Richmond City · 178,280 people
- City population
- 287,109
- Metro
- Richmond, VA
- Population (ZIP)
- 40,575
- Household income
- $50,475
- Rent vs Own
- Severe rent burden
- 3584.0
Population outlook (Richmond County) Hauer SSP2
- Today (2025)
- 262,263 people
- By 2030
- 284,503 · +8.5%
- By 2040
- 327,353 · +24.8%
- By 2050
- 367,946 · +40.3%
- By 2075
- 449,560 · +71.4%
- By 2100
- 500,301 · +90.8%
Race, ethnicity, and origin ACS 2023
- Neighborhood character
- Diverse neighborhood (Simpson 0.58)
- Race & ethnicity
- Black 59% Hispanic / Latino 22% White 15% Two or more races 6%
- Hispanic origin (detail)
- Mexican 5% Puerto Rican 2%
- Common ancestry
- Romanian 1% Lithuanian 1% Serbian 1%
- Foreign-born
- 17% · Canada
- Languages at home
- 78% English-only · Spanish 19% French/Haitian/Cajun 1%
Political lean MEDSL · Richmond
- 2024 margin
- Solid D (+66.3) · D 82.0% · R 15.8% · Other 2.2%
- 2008→2024 swing
- +7.2pp toward D · 2008: 59.1pp · 2024: 66.3pp
- All cycles
- 2024: D+66.3 2020: D+68.0 2016: D+63.8 2012: D+55.7 2008: D+59.1
Not yet ingested
- Civics
- —
Market trends
- HPI YoY
- ▼ -283.99%
- Current HPI
- 336.9345
- Rent YoY
- ▲ 4.55%
- Metro
- Richmond, VA
- State GDP YoY
- ▲ 2.40%
- F500 in state
- 50
Industry mix (Fortune 500 HQ in VA)
| Industry | F500 HQs | Revenue |
|---|---|---|
| Aerospace / Defense | 4 | $236B |
|
||
| Technology / Defense | 3 | $32B |
|
||
| Financial Services | 2 | $176B |
|
||
| Utilities | 2 | $27B |
|
||
| Insurance | 2 | $25B |
|
||
| Technology | 2 | $15B |
|
||
Price history
+1072.4% since first listed3 events — show timeline
- 2026-04-30 Pending — CVRMLS
- 2026-04-23 Listed $170,000 CVRMLS
- 1967-01-04 Sold (Public Records) $14,500 Public Records
Property tax history
+6.6%/yrLatest (2022): $2,028 · +60.6% YoY. Source: county tax records.
Cash-flow waterfall
monthlySold comps — $/sqft
last 12 mo · ≤1 miLoading sold comps…