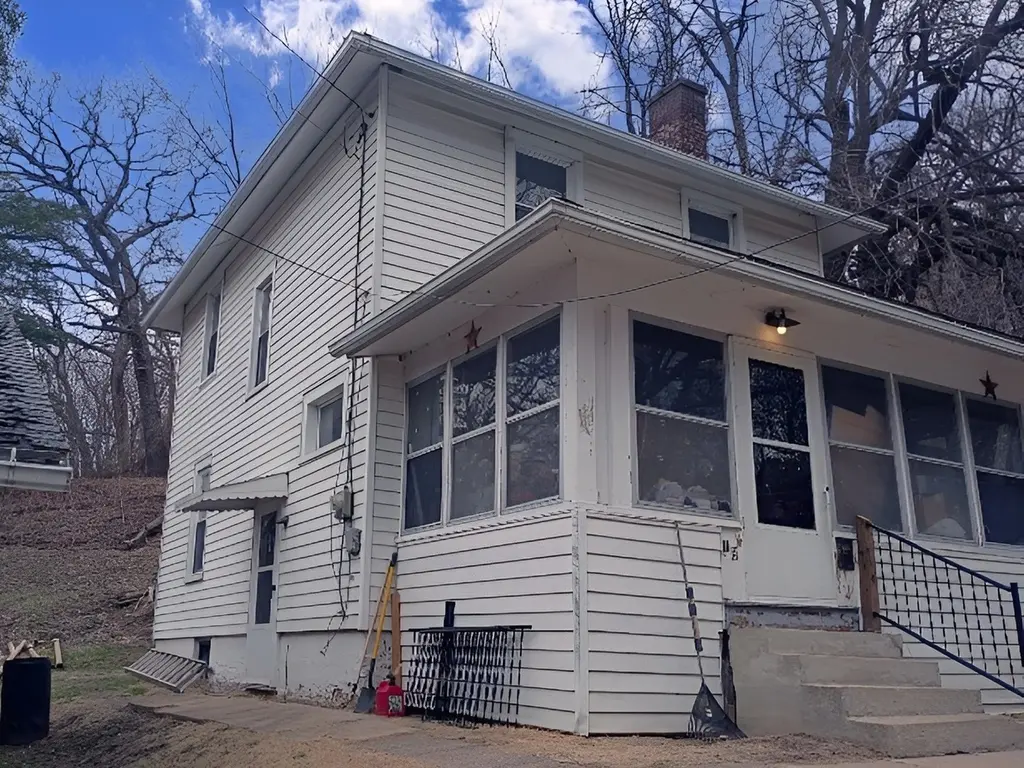
18 Walnut St · Savanna, IL
Flood risk 1/10 · Minimal
- FEMA flood zone
- X (unshaded)
- Chance of flooding over 30 yrs
- 0.0%
- Est. flood insurance / yr
- $473 – $860
Fire risk 2/10 · Minimal
- Est. fire insurance / yr
- $804 – $1,492
Heat risk 3/10 · Minor
- Hot days now (above 102°F)
- 7 days/yr
- Hot days in 30 yrs
- 16 days/yr
Wind risk 2/10 · Minimal
- Chance of severe wind over 30 yrs
- —
Air-quality risk 2/10 · Minimal
- Unhealthy air days now
- 2 days/yr
- Unhealthy air days in 30 yrs
- 2 days/yr
Risk factors via First Street. Map © Google.
Why this score? — see what drove the C+ grade
The composite is a weighted blend of 9 inputs, each scored 0–100. Each bar is that input's sub-score; the figure is the points it added to the 100-point composite (weight × sub-score).
- Cash flow +27.0/30.0
- DSCR +9.3/10.0
- 1% rule +8.3/10.0
- ARV discount +7.5/15.0
- Livability +3.2/5.0
- Rent growth +2.5/5.0
- Condition / age +2.5/5.0
- Schools +1.4/10.0
- Appreciation +0.0/10.0
$60,000
🖨 Deal sheet 📄 Offer letter ✓ Due diligence
Listing remarks
Charming single-family home located at 18 Walnut St, Savanna, IL 61074. Built in 1916, this inviting property offers 1,092 sq. ft. of living space with timeless character and classic architectural details. Situated on a 4,328 sq. ft. lot, the home blends historic charm with comfortable living potential. A great opportunity for homeowners, investors, or buyers looking for a property with unique appeal in a desirable Savanna neighborhood.
Key facts
- 3,484 sq ft lot
- Built 1916
- Listed 10 days
Property features AI
Finance
- Other: Lot dimensions approximately 35 x 100 (less than 0.25 acre)
- Financial info: Special service area: No; Homeowner tax exemption
- HOA & community: No master association fee required; Subdivision: Fawn Valley Estates
Exterior
- Parking: Asphalt parking
- Utilities: Public water; Public sewer (and other sewer); Public power
- Home design: Detached single-family home; 1.5-story design; Fee simple ownership; Property over 100 years old; Not currently leased
- Construction: Aluminum siding; Asphalt roof; Other foundation; Approx. total finished area 1,638 (including 546 below-grade finished area)
- Exterior features: Other exterior features; Curb, sidewalk, street lights, and paved streets
Interior
- Kitchen: Range; Microwave; Dishwasher; Range hood; Eating area/table space (kitchen approx. 13 x 11) with vinyl flooring and blinds
- Bedrooms: Master bedroom on the main level (12 x 11) with blinds and hardwood flooring; Bedroom 2 on the main level (11 x 10) with blinds and hardwood flooring; Bedroom 3 on the main level (10 x 9) with blinds and hardwood flooring
- Flooring: Hardwood flooring in living areas and bedrooms; Vinyl flooring in the kitchen; Other flooring in the lower-level laundry
- Bathrooms: 1 full bathroom
- Heating & cooling: Central air; Other heating type
- Interior features: Built-in features; Finished partial basement
- Laundry & utility: Lower-level laundry room (approx. 14 x 10)
Neighborhood map
What this means for you Summary
Snapshot
- This is a 3-bed/1.0-bath other listed at $60k.
Deal economics
- At list price, monthly cash flow is $167 ($2k/yr) — positive.
- The deal already cash-flows at list — no discount required.
- Meets the 1% rule at list price ($800 rent vs $60k).
- Cap rate 9.6% vs local median 6.4% in Savanna — top-decile yield for the area; either an underpriced asset or a hidden risk that comps aren't pricing in. Stress-test before assuming the spread holds.
Location & tenants
- Location reads 64/100 on livability (#684 in IL) — a middle-class / working-renter tenant base. Strengths: cost of living A+, housing A+, crime A; Watch: amenities F, commute F, employment F.
- West Carroll CUSD 314 (rural): math 12% / reading 20% proficiency, ranked #498 of 620 in IL (top 80%) — low school quality limits family demand, transient renter base, plan for 1-2y turnover.
- Zoned schools: West Carroll Primary (math 12% / reading 17%, grade F, #1,278 of 2,056 statewide, top 65%, 416 students, 0% FRL); West Carroll Middle School (math 10% / reading 24%, grade F, #460 of 665 statewide, top 72%, 193 students, 0% FRL); West Carroll High School (math 15% / reading 15%, grade F, #462 of 693 statewide, top 68%, 286 students, 0% FRL) — zoned schools average 0% FRL vs 50% district-wide (50 pts lower); this property's tenant base skews higher-income than the district average.
- Market conditions: 38 active listings in the ZIP; 2 comparable units currently listed for rent nearby; 23 units permitted in Carroll County in 2024 (0 in 5+ unit buildings).
Forward outlook
- Local home prices are declining (-3.0%/yr); year-one equity from $415 of loan paydown is wiped out by about $2k of value loss. Plan a longer hold.
- Carroll County population projected at -30% by 2050 — secular population decline; favor cash flow + early exit over multi-decade hold.
- At projected returns (-3.0% appreciation + 3.0% rent growth), your $17k cash investment doubles in ~10 years — after that, you're playing with house money.
Negotiation context
- Only 11 days on market — expect competitive offers; lowballing is unlikely to land.
Risks & watch-outs
- Watch-outs: built in 1916 — expect roof / HVAC / electrical / plumbing capex.
Questions for the listing agent
- Built in 1916 — when were the roof, HVAC, electrical panel, plumbing, and water heater last replaced?
- Is there a deadline driving the sale (1031 exchange, divorce, estate, relocation)? That informs how much negotiation room exists.
- Schools are F-rated, which usually means shorter tenancies and higher turnover. Who's the typical renter profile here, and what's been the actual vacancy rate?
- What's the average days-on-market for RENTAL listings here right now (not sales)? A rising rental-DOM trend means longer vacancies and softer asking-rent achievability than the comps imply.
- What's the recent tenant-quality profile in this submarket — average credit score on applications, eviction rate, late-payment / NSF rate, and stable-employment percentage? A property-management company in the area should have these aggregated.
- How much new for-sale + rental construction is in the pipeline within 1–3 miles? Heavy new supply typically softens prices + rents 12–24 months out; constrained supply supports both.
Investment metrics
- 1% rule
- 1.33% ✓
- Cap rate
- 9.64%
- Cash-on-cash
- 11.96%
- DSCR
- 1.53
- GRM
- 6.2
CMA / ARV
No comps found within radius.
Projected returns pro-forma
-3.0% appreciation · 3.0% rent growth · sell at horizon
- IRR
- 1.5%
- Equity multiple
- 1.06×
- Total profit
- $982
- Equity at exit
- $8,946
- IRR
- 11.2%
- Equity multiple
- 1.88×
- Total profit
- $14,758
- Equity at exit
- $5,188
Cash invested: $16,800 (down + closing). Projections, not guarantees.
Landlord ↔ Tenant lean methodology
- Overall (STATE)
- 43 Moderately Tenant-Leaning
- State Illinois
- 43 Moderately Tenant-Leaning · D+7
- County
- — inherits STATE
- City
- — inherits STATE
ZIP-level market 61074
- Home prices YoY
- -14.6%
- Active inventory
- 38
- Price-to-rent
- 6.2×
Monthly cashflow live
- Estimated rent
- $800 medium interval (Pro) →
- Mortgage (P&I)
- −$315
- Tax from tax record
- −$125 /mo · $1,499/yr
- Insurance
- −$25
- HOA
- −$0
- Vacancy / Maint / Mgmt
- −$168
- Net cashflow
- $167
Break-even live
UW: 25.0% down · 7.5% · 30yr · 1.5% tax · 5.0% vac · 8.0% maint · 8.0% mgmt
Financing live
Cash to close
- Down payment
- $15,000
- Closing costs
- $1,800
- Reserves months
- —
- Total cash needed
- —
Loan-product check · same deal, 3 products live
Conventional
25% down · 7.5% · 30yr
- Down + closing
- —
- Monthly P&I
- —
- Monthly cashflow
- —
- DSCR
- —
- Eligible?
- —
Personal DTI + credit; lowest rate.
DSCR
20% down · 8.5% · 30yr
- Down + closing
- —
- Monthly P&I
- —
- Monthly cashflow
- —
- DSCR
- —
- Eligible?
- —
No personal income docs; deal must DSCR.
Hard money
10% down · 12.0% · 12mo
- Down + closing
- —
- Monthly P&I
- —
- Monthly cashflow
- —
- DSCR
- —
- Eligible?
- —
Short-term bridge; refi at stabilization.
Rent comps 2 comps
| Address | Beds | Baths | Sqft | Rent | $/sqft | DOM | Units | Dist |
|---|---|---|---|---|---|---|---|---|
| 512-514 Chicago Ave Savanna, IL | 3.0 | 1.0 | 1435 | $800 | $0.56 | 44d | 1 | 0.27mi |
| 512 Chicago Ave Unit 1 Savanna, IL | 3.0 | 1.5 | 1435 | $800 | $0.56 | 44d | 1 | 0.28mi |
Listing history 9 events
-
2026-06-19days on market $60,000 Active 11 DOM
-
2026-06-18days on market $60,000 Active 10 DOM
-
2026-06-17days on market $60,000 Active 9 DOM
-
2026-06-16days on market $60,000 Active 8 DOM
-
2026-06-15days on market $60,000 Active 7 DOM
-
2026-06-14days on market $60,000 Active 5 DOM
-
2026-06-12days on market $60,000 Active 4 DOM
-
2026-06-09remarks 440-char remark
-
2026-06-09$60,000 Active 1 DOM
ⓘ Source: listings_history table (triggers on properties + properties_extension) + one-shot
backfill from property_details.listing_events for pre-trigger history.
Tax reassessment forecast IL · Partial reset (capped growth)
- Current annual tax
- $1,499 · $125/mo
- Projected year-2 tax
- $1,499 · $125/mo
- Expected delta
- $0/yr ($0/mo · 0.0%)
ⓘ Screening estimate from a state-policy table — verify with the county assessor before closing.
Climate risk First Street
- Flood 1/10 Low FEMA zone X (unshaded) · 0% chance over 30 yrs
- Wildfire 2/10 Low
- Heat 3/10 Moderate 7 d/yr ≥102°F today · 16 d/yr by 30 yrs out
- Wind 2/10 Low
- Air quality 2/10 Low 2 unhealthy d/yr today · 2 by 30 yrs out
Nearby sold comps map
Loading sold comps map…
Walkable amenities ~0.75 mi
Loading nearby amenities…
Taxation est. · year 1
- Rental income
- $9,600
- − Mortgage interest
- −$3,361
- − Property taxes
- −$1,499
- − Insurance
- −$300
- − Repairs & maintenance
- −$768
- − Management
- −$768
- − Depreciation
- −$1,745
- Taxable income
- $1,158
- Est. tax owed @ 24.0%
- −$278
- After-tax cash flow
- $1,731/yr
For passive investors: Depreciation is non-cash, so a rental often shows a tax loss while cash-flowing — sheltering income. Rental losses are passive: they offset passive income freely, and up to $25,000/yr can offset ordinary (W-2) income if you actively participate and your MAGI is under $100k (phasing out to $0 by $150k); unused losses carry forward. On sale, claimed depreciation is recaptured at up to 25%, and gains may owe capital-gains tax (a 1031 exchange can defer both). Figures are a year-1 estimate at your 24.0% rate — not tax advice; consult a CPA.
Schools (NCES district)
- District
- West Carroll CUSD 314
- NCES district ID
- 1700310
- Math proficiency
- 12% ▼ -5.00%
- Reading proficiency
- 20% ▼ -3.00%
- Median HH income
- $43,090
- Composite
- 13.91/100
- National rank
- #9483
- State rank
- #498 of 620 in IL
Livability — Savanna
- Score
- 64/100
- State rank
- #684
- US rank
- #13971
Category grades
Schools grade is shown separately in the Schools card above.
Census & demographics
- Census place
- Savanna, IL
- Population (ZIP)
- 4,009
Population outlook (Carroll County) Hauer SSP2
- Today (2025)
- 13,010 people
- By 2030
- 12,150 · -6.6%
- By 2040
- 10,462 · -19.6%
- By 2050
- 9,078 · -30.2%
- By 2075
- 6,704 · -48.5%
- By 2100
- 5,004 · -61.5%
Race, ethnicity, and origin ACS 2023
- Neighborhood character
- Predominantly White (91%)
- Race & ethnicity
- White 91% Hispanic / Latino 6% Two or more races 5%
- Hispanic origin (detail)
- Mexican 4%
- Common ancestry
- Iranian 5% Romanian 3% Slovak 2%
- Foreign-born
- 2% · Canada, Jamaica
- Languages at home
- 96% English-only · Spanish 3% German/W. Germanic 1%
Political lean MEDSL · Carroll
- 2024 margin
- Solid R (+31.7) · D 33.2% · R 64.8% · Other 2.0%
- 2008→2024 swing
- -36.5pp toward R · 2008: 4.8pp · 2024: -31.7pp
- All cycles
- 2024: R+31.7 2020: R+29.4 2016: R+27.1 2012: D+1.4 2008: D+4.8
Not yet ingested
- Civics
- —
Market trends
- HPI YoY
- ▼ -24.68%
- Current HPI
- 144.9327
- Rent YoY
- —
- Metro
- —
- State GDP YoY
- ▲ 1.59%
- F500 in state
- 60
Industry mix (Fortune 500 HQ in IL)
| Industry | F500 HQs | Revenue |
|---|---|---|
| Insurance | 4 | $201B |
|
||
| Consumer Goods | 4 | $87B |
|
||
| Industrial Machinery | 3 | $64B |
|
||
| Healthcare | 2 | $55B |
|
||
| Retail / Pharmacy | 1 | $148B |
|
||
| Agriculture / Food | 1 | $86B |
|
||
Price history
+57.9% since first listed2 events — show timeline
- 2026-06-08 Listed $60,000 MRED as Distributed by MLS Grid
- 2025-01-15 Price Changed $38,000 NWIAR
Property tax history
+15.4%/yrLatest (2024): $1,499 · +8.0% YoY. Source: county tax records.
Cash-flow waterfall
monthlySold comps — $/sqft
last 12 mo · ≤1 miLoading sold comps…