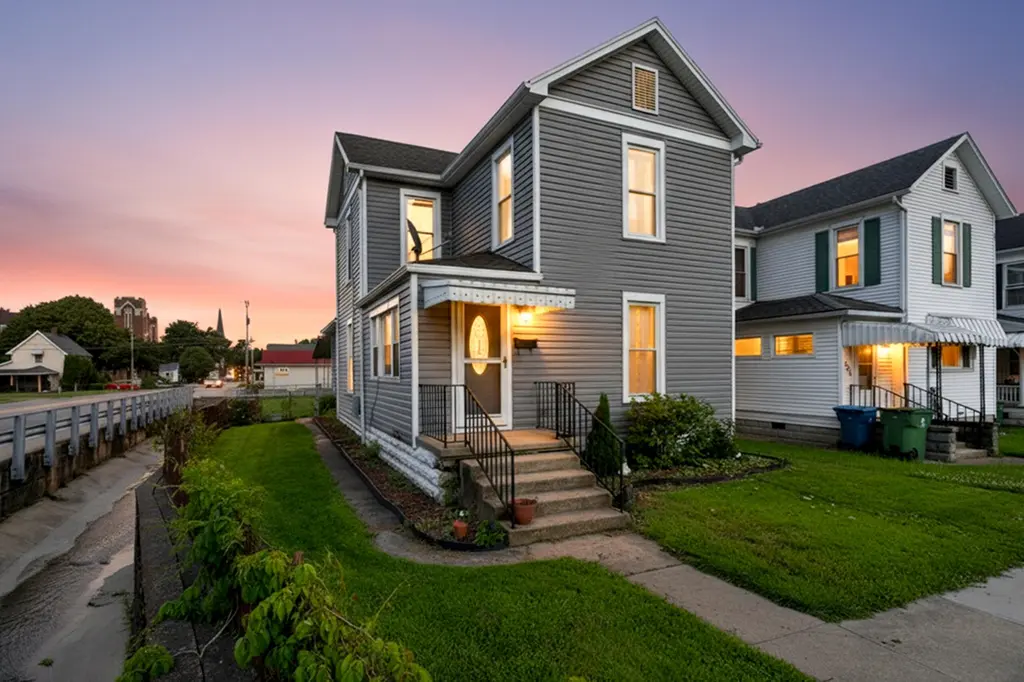
402 Franklin Ave · Sidney, OH
Flood risk 1/10 · Minimal
- FEMA flood zone
- X (unshaded)
- Chance of flooding over 30 yrs
- 0.0%
- Est. flood insurance / yr
- $473 – $860
Fire risk 1/10 · Minimal
- Est. fire insurance / yr
- $713 – $1,323
Heat risk 3/10 · Minor
- Hot days now (above 100°F)
- 7 days/yr
- Hot days in 30 yrs
- 18 days/yr
Wind risk 2/10 · Minimal
- Chance of severe wind over 30 yrs
- —
Air-quality risk 2/10 · Minimal
- Unhealthy air days now
- 1 days/yr
- Unhealthy air days in 30 yrs
- 2 days/yr
Risk factors via First Street. Map © Google.
Why this score? — see what drove the C- grade
The composite is a weighted blend of 9 inputs, each scored 0–100. Each bar is that input's sub-score; the figure is the points it added to the 100-point composite (weight × sub-score).
- Cash flow +15.4/30.0
- ARV discount +13.9/15.0
- DSCR +4.7/10.0
- Schools +4.2/10.0
- Livability +3.8/5.0
- 1% rule +3.4/10.0
- Rent growth +2.5/5.0
- Condition / age +2.5/5.0
- Appreciation +0.0/10.0
$139,900
🖨 Deal sheet (PDF) 📄 Offer letter ✓ Due diligence
Listing remarks
This 3-bedroom, 1.5-bath home offers a great opportunity to make it your own. With many major updates already completed, it's a blank slate ready for its next owner. Recent improvements include - roof (2016), windows (2016), HVAC system (2019), and new siding with added insulation (2022). The I & I was completed and approved by the city in 2018. Outside, you'll find a fenced-in yard, offering space for pets, play, or outdoor entertaining. The seller is offering the home as-is.
Key facts
- Roof
- New siding
- Major updates
Tags
Property features AI
Exterior
- Utilities: Public sewer; Supplied water
- Home design: Single family residence; Residential property; Built in 1915; Corner lot (corner of Water St. and Franklin Ave.)
- Construction: Vinyl siding construction; Built in 1915
- Exterior features: Vinyl siding; Supplied water; Residential lot
Interior
- Kitchen: Range; Refrigerator
- Bedrooms: Bedroom 1 (13 x 13); Bedroom 2 (13 x 9); Bedroom 3 (12 x 9)
- Bathrooms: 2 bathrooms total — 1 full, 1 half
- Heating & cooling: Central air conditioning; Forced air heating (natural gas)
- Interior features: 9 total rooms; Unfinished basement
Neighborhood map
What this means for you Summary
Snapshot
- This is a 3-bed/1.5-bath single-family listed at $140k.
Deal economics
- At list price, monthly cash flow is $53 ($639/yr) — positive.
- The deal already cash-flows at list — no discount required.
- To meet the 1% rule (rent ≥ 1% of price), the offer needs to be $117k (16.4% below list).
- Recommended offer: $117k (16.4% below list) — sets the bar for 1% rule.
- Cap rate 6.7% vs local median 4.0% in Sidney — top-decile yield for the area; either an underpriced asset or a hidden risk that comps aren't pricing in. Stress-test before assuming the spread holds.
Location & tenants
- Location reads 76/100 on livability (#220 in OH, #3,412 nationally) — a middle-class / working-renter tenant base. Strengths: cost of living A+, housing A+, health & safety A+; Watch: crime C-, employment C-, amenities D.
- Sidney City (town): math 46% / reading 52% proficiency, ranked #454 of 656 in OH (top 69%) — families likely to look elsewhere, expect single-tenant / working-renter base with shorter leases.
- Zoned schools: Emerson Primary School (328 students, 58% FRL); Sidney Middle School (math 46% / reading 53%, grade C, #421 of 654 statewide, top 65%, 840 students, 60% FRL); Sidney High School (math 31% / reading 56%, grade F, #493 of 781 statewide, top 63%, 826 students, 55% FRL).
- Market conditions: 145 active listings in the ZIP; 7 comparable units currently listed for rent nearby; rentals leasing fast (median 5d on market — plan ~1-2 weeks tenant-placement turnaround); 337 units permitted in Shelby County in 2024 (216 in 5+ unit buildings).
Forward outlook
- Local home prices are declining (-3.0%/yr); year-one equity from $967 of loan paydown is wiped out by about $4k of value loss. Plan a longer hold.
- Shelby County population projected at -18% by 2050 — secular population decline; favor cash flow + early exit over multi-decade hold.
Negotiation context
- It's been on market 26 days — a 2% lower offer ($138k) is reasonable based on typical stale-listing flexibility.
- 5 sale attempts since 18y ago; this cycle's ask has dropped $10k (7%) from the opening price — seller is motivated, your offer sets the floor, not the list.
- Current owner paid $59k; list at $140k implies a 137% gain — meaningful room to come down on a strong offer.
Risks & watch-outs
- Watch-outs: built in 1915 — expect roof / HVAC / electrical / plumbing capex.
Questions for the listing agent
- Built in 1915 — when were the roof, HVAC, electrical panel, plumbing, and water heater last replaced?
- Is there a deadline driving the sale (1031 exchange, divorce, estate, relocation)? That informs how much negotiation room exists.
- What's the average days-on-market for RENTAL listings here right now (not sales)? A rising rental-DOM trend means longer vacancies and softer asking-rent achievability than the comps imply.
- What's the recent tenant-quality profile in this submarket — average credit score on applications, eviction rate, late-payment / NSF rate, and stable-employment percentage? A property-management company in the area should have these aggregated.
- How much new for-sale + rental construction is in the pipeline within 1–3 miles? Heavy new supply typically softens prices + rents 12–24 months out; constrained supply supports both.
Investment metrics
- 1% rule
- 0.84% ✗
- Cap rate
- 6.75%
- Cash-on-cash
- 1.63%
- DSCR
- 1.07
- GRM
- 10.0
CMA / ARV
- ARV (on-the-fly)
- $163,056
- Comps found
- 12
Show comp detail 12 sales within ~0.75 mi
| Address | Dist | Beds/Ba | Sqft | Sold | Price | $/sf | Match |
|---|---|---|---|---|---|---|---|
| 413 E Poplar St | 0.49mi | 3/1.0 | 1,283 (+2%) | 5mo | $130,000 | $101 | 68 |
| 1116 Taft St | 0.70mi | 3/1.5 | 1,259 (-0%) | 2mo | $218,000 | $173 | 65 |
| 230 N Pomeroy Ave | 0.47mi | 3/1.0 | 1,188 (-6%) | 2mo | $148,000 | $125 | 64 |
| 613 S Highland Ave | 0.34mi | 3/2.0 | 1,360 (+8%) | 9mo | $174,900 | $129 | 62 |
| 830 Chestnut Ave | 0.40mi | 2/1.0 (-1) | 1,204 (-5%) | 8mo | $195,400 | $162 | 59 |
| 614 Michigan St | 0.55mi | 4/2.0 (+1) | 1,305 (+3%) | 4mo | $185,000 | $142 | 59 |
| 518 W North St | 0.42mi | 2/1.5 (-1) | 1,349 (+7%) | 10mo | $98,000 | $73 | 56 |
| 624 St Marys Ave | 0.68mi | 3/1.5 | 1,326 (+5%) | 7mo | $180,000 | $136 | 54 |
| 206 Charles Ave | 0.66mi | 3/2.0 | 1,382 (+9%) | 4mo | $224,000 | $162 | 48 |
| 305 Monroe St | 0.57mi | 3/1.0 | 1,130 (-11%) | 9mo | $69,600 | $62 | 46 |
| 912 Evergreen Dr | 0.75mi | 2/1.0 (-1) | 1,348 (+7%) | 8mo | $138,000 | $102 | 40 |
| 209 Pike St | 0.70mi | 2/1.0 (-1) | 1,120 (-11%) | 5mo | $105,000 | $94 | 38 |
Match score weights: distance 35% · size 25% · config 20% · recency 20%. Top-matched comps best support the ARV.
Projected returns pro-forma
-3.0% appreciation · 3.0% rent growth · sell at horizon
- IRR
- -13.7%
- Equity multiple
- 0.51×
- Total profit
- $-19,320
- Equity at exit
- $20,860
- IRR
- -4.9%
- Equity multiple
- 0.68×
- Total profit
- $-12,624
- Equity at exit
- $12,096
Cash invested: $39,172 (down + closing). Projections, not guarantees.
Landlord ↔ Tenant lean methodology
- Overall (STATE)
- 73 Landlord-Friendly
- State Ohio
- 73 Landlord-Friendly · R+6
- County
- — inherits STATE
- City
- — inherits STATE
ZIP-level market 45365
- Home prices YoY
- -20.1%
- Active inventory
- 145
- Price-to-rent
- 10.0×
Monthly cashflow live
- Estimated rent
- $1,170 high interval (Pro) →
- Mortgage (P&I)
- −$734
- Tax from tax record
- −$79 /mo · $947/yr
- Insurance
- −$58
- HOA
- −$0
- Vacancy / Maint / Mgmt
- −$246
- Net cashflow
- $53
Break-even live
Sensitivity live
| Price | -10% $132 | -5% $93 | +0% $53 | +5% $14 | +10% $-26 |
|---|---|---|---|---|---|
| Rent | -10% $-39 | -5% $7 | +0% $53 | +5% $99 | +10% $146 |
| Rate | -1.0pp $124 | -0.5pp $89 | base $53 | +0.5pp $17 | +1.0pp $-20 |
UW: 25.0% down · 7.5% · 30yr · 1.5% tax · 5.0% vac · 8.0% maint · 8.0% mgmt
Financing live
Cash to close
- Down payment
- $34,975
- Closing costs
- $4,197
- Reserves months
- —
- Total cash needed
- —
Loan-product check · same deal, 3 products live
Conventional
25% down · 7.5% · 30yr
- Down + closing
- —
- Monthly P&I
- —
- Monthly cashflow
- —
- DSCR
- —
- Eligible?
- —
Personal DTI + credit; lowest rate.
DSCR
20% down · 8.5% · 30yr
- Down + closing
- —
- Monthly P&I
- —
- Monthly cashflow
- —
- DSCR
- —
- Eligible?
- —
No personal income docs; deal must DSCR.
Hard money
10% down · 12.0% · 12mo
- Down + closing
- —
- Monthly P&I
- —
- Monthly cashflow
- —
- DSCR
- —
- Eligible?
- —
Short-term bridge; refi at stabilization.
Rent comps 7 comps
| Address | Beds | Baths | Sqft | Rent | $/sqft | DOM | Units | Dist |
|---|---|---|---|---|---|---|---|---|
| 314 Thompson St Sidney, OH | 3.0 | 1.0 | 1352 | $1,200 | $0.89 | 4d | 1 | 0.34mi |
| 803 S Main Ave Sidney, OH | 2.0 | 1.0 | 1104 | $1,030 | $0.93 | 4d | 1 | 0.37mi |
| 803 S Main Ave Sidney, OH | 2.0 | 1.0 | 1104 | $1,100 | $1.00 | 45d | 1 | 0.37mi |
| 805 S Main Ave Sidney, OH | 3.0 | 1.0 | 1423 | $1,400 | $0.98 | 23d | 1 | 0.37mi |
| 751 Campbell Rd Sidney, OH | 2.0 | 1.0 | 980 | $1,100 | $1.12 | 4d | 1 | 0.50mi |
| 776 Country Side Ln Sidney, OH | 3.0 | 1.0 | 1001 | $994 | $0.99 | 4d | 1 | 1.23mi |
| 1402 N Main Ave Sidney, OH | 3.0 | 1.0 | 1544 | $1,300 | $0.84 | 14d | 1 | 1.29mi |
Listing history 28 events
-
2026-06-21days on market $139,900 Active 26 DOM
-
2026-06-18days on market $139,900 Active 23 DOM
-
2026-06-17days on market $139,900 Active 22 DOM
-
2026-06-16pricedays on market $139,900 Active 21 DOM
-
2026-06-15days on market $149,900 Active 20 DOM
-
2026-06-14days on market $149,900 Active 18 DOM
-
2026-06-13days on market $149,900 Active 17 DOM
-
2026-06-10days on market $149,900 Active 15 DOM
-
2026-06-09days on market $149,900 Active 14 DOM
-
2026-06-08days on market $149,900 Active 13 DOM
-
2026-06-07days on market $149,900 Active 12 DOM
-
2026-06-03days on market $149,900 Active 8 DOM
-
2026-06-02days on market $149,900 Active 7 DOM
-
2026-06-01days on market $149,900 Active 6 DOM
-
2026-05-31days on market $149,900 Active 5 DOM
-
2026-05-31days on market $149,900 Active 4 DOM
-
2026-05-25$149,900 Active
-
2017-10-31soldstatus $59,000
-
2017-07-20historical
-
2016-10-20$64,500
-
2009-11-30historical
-
2009-08-29$82,900
-
2009-08-23historical
-
2009-02-23$82,900
-
2008-12-01historical
-
2008-05-01$82,900
-
1998-08-12soldstatus $50,000
-
1992-04-20soldstatus $42,500
ⓘ Source: listings_history table (triggers on properties + properties_extension) + one-shot
backfill from property_details.listing_events for pre-trigger history.
Tax reassessment forecast OH · Partial reset (capped growth)
- Current annual tax
- $947 · $79/mo
- Projected year-2 tax
- $1,565 · $130/mo
- Expected delta
- +$618/yr (+$51/mo · 65.3%)
ⓘ Screening estimate from a state-policy table — verify with the county assessor before closing.
Climate risk First Street
- Flood 1/10 Low FEMA zone X (unshaded) · 0% chance over 30 yrs
- Wildfire 1/10 Low
- Heat 3/10 Moderate 7 d/yr ≥100°F today · 18 d/yr by 30 yrs out
- Wind 2/10 Low
- Air quality 2/10 Low 1 unhealthy d/yr today · 2 by 30 yrs out
Nearby sold comps map
Loading sold comps map…
Walkable amenities ~0.75 mi
Loading nearby amenities…
Taxation est. · year 1
- Rental income
- $14,037
- − Mortgage interest
- −$7,837
- − Property taxes
- −$947
- − Insurance
- −$700
- − Repairs & maintenance
- −$1,123
- − Management
- −$1,123
- − Depreciation
- −$4,070
- Taxable loss
- −$1,762
- Est. tax savings @ 24.0%
- +$423
- After-tax cash flow
- $1,062/yr
For passive investors: Depreciation is non-cash, so a rental often shows a tax loss while cash-flowing — sheltering income. Rental losses are passive: they offset passive income freely, and up to $25,000/yr can offset ordinary (W-2) income if you actively participate and your MAGI is under $100k (phasing out to $0 by $150k); unused losses carry forward. On sale, claimed depreciation is recaptured at up to 25%, and gains may owe capital-gains tax (a 1031 exchange can defer both). Figures are a year-1 estimate at your 24.0% rate — not tax advice; consult a CPA.
Schools (NCES district)
- District
- Sidney City
- NCES district ID
- 3910003
- Math proficiency
- 46% ▼ -14.00%
- Reading proficiency
- 52% ▼ -6.00%
- Median HH income
- $45,974
- Composite
- 41.55/100
- National rank
- #3443
- State rank
- #454 of 656 in OH
Livability — Sidney
- Score
- 76/100
- State rank
- #220
- US rank
- #3412
Category grades
Schools grade is shown separately in the Schools card above.
Census & demographics
- Census place
- Sidney, OH
- County
- Shelby · 44,840 people
- City population
- 28,955
- Population (ZIP)
- 28,955
- Household income
- $66,044
- Rent vs Own
- Severe rent burden
- 5.7
Population outlook (Shelby County) Hauer SSP2
- Today (2025)
- 47,264 people
- By 2030
- 45,935 · -2.8%
- By 2040
- 42,786 · -9.5%
- By 2050
- 38,981 · -17.5%
- By 2075
- 30,225 · -36.1%
- By 2100
- 21,273 · -55.0%
Race, ethnicity, and origin ACS 2023
- Neighborhood character
- Predominantly White (90%)
- Race & ethnicity
- White 90% Two or more races 4% Black 3% Hispanic / Latino 2%
- Common ancestry
- Lithuanian 3% Slovak 1% Italian 1%
- Foreign-born
- 2% · Canada
- Languages at home
- 98% English-only · Spanish 1%
Political lean MEDSL · Shelby
- 2024 margin
- Solid R (+64.8) · D 17.2% · R 82.0%
- 2008→2024 swing
- -28.5pp toward R · 2008: -36.4pp · 2024: -64.8pp
- All cycles
- 2024: R+64.8 2020: R+63.2 2016: R+60.6 2012: R+46.0 2008: R+36.4
Not yet ingested
- Civics
- —
Market trends
- HPI YoY
- ▼ -66.62%
- Current HPI
- 264.4532
- Rent YoY
- —
- Metro
- —
- State GDP YoY
- ▲ 1.98%
- F500 in state
- 48
Industry mix (Fortune 500 HQ in OH)
| Industry | F500 HQs | Revenue |
|---|---|---|
| Insurance | 3 | $145B |
|
||
| Industrial Machinery | 3 | $49B |
|
||
| Financial Services | 3 | $24B |
|
||
| Consumer Goods | 2 | $93B |
|
||
| Aerospace / Defense | 2 | $47B |
|
||
| Utilities | 2 | $33B |
|
||
Price history
+252.7% since first listed12 events — show timeline
- 2026-05-25 Listed $149,900 WRIST
- 2017-10-31 Sold (Public Records) $59,000 Public Records
- 2017-07-20 Listing Removed — WRIST
- 2016-10-20 Listed $64,500 WRIST
- 2009-11-30 Listing Removed — WRIST
- 2009-08-29 Listed $82,900 WRIST
- 2009-08-23 Listing Removed — WRIST
- 2009-02-23 Listed $82,900 WRIST
- 2008-12-01 Listing Removed — WRIST
- 2008-05-01 Listed $82,900 WRIST
- 1998-08-12 Sold (Public Records) $50,000 Public Records
- 1992-04-20 Sold (Public Records) $42,500 Public Records
Property tax history
+4.0%/yrLatest (2025): $947 · -1.4% YoY. Source: county tax records.
Cash-flow waterfall
monthlySold comps — $/sqft
last 12 mo · ≤1 miLoading sold comps…