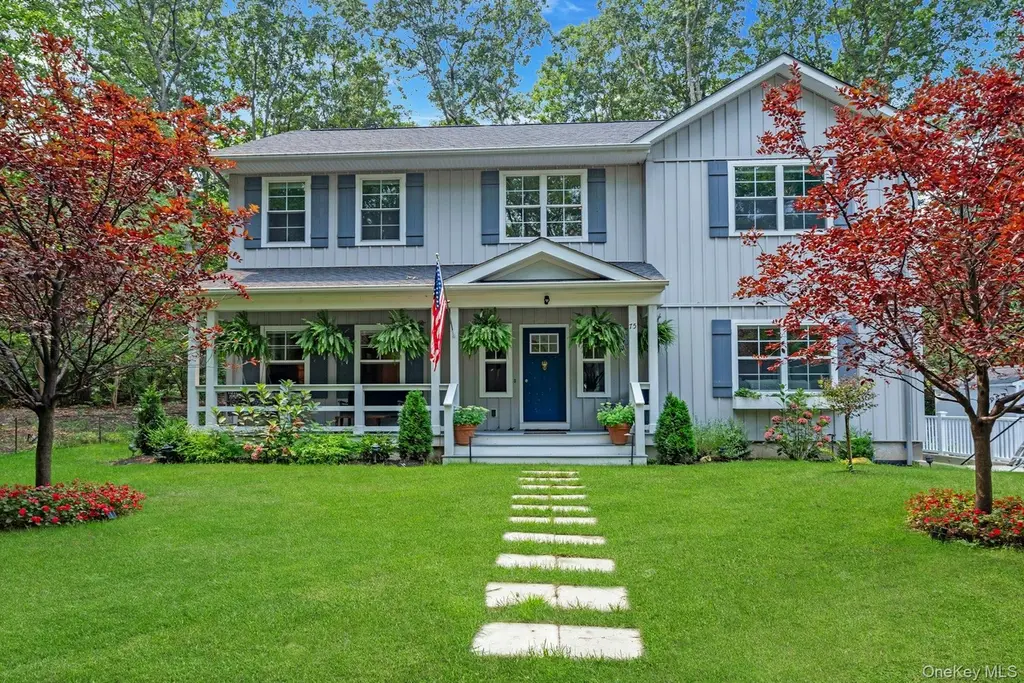
75 Birch Rd · Southold, NY
Flood risk 1/10 · Minimal
- FEMA flood zone
- X (unshaded)
- Chance of flooding over 30 yrs
- 0.0%
- Est. flood insurance / yr
- $507 – $1,088
Fire risk 3/10 · Minor
- Est. fire insurance / yr
- $691 – $1,283
Heat risk 4/10 · Minor
- Hot days now (above 90°F)
- 6 days/yr
- Hot days in 30 yrs
- 15 days/yr
Wind risk 8/10 · Major
- Chance of severe wind over 30 yrs
- 80.0%
Air-quality risk 3/10 · Minor
- Unhealthy air days now
- 3 days/yr
- Unhealthy air days in 30 yrs
- 4 days/yr
Risk factors via First Street. Map © Google.
Why this score? — see what drove the C grade
The composite is a weighted blend of 9 inputs, each scored 0–100. Each bar is that input's sub-score; the figure is the points it added to the 100-point composite (weight × sub-score).
- Cash flow +22.7/30.0
- ARV discount +9.3/15.0
- DSCR +7.3/10.0
- 1% rule +5.0/10.0
- Schools +4.8/10.0
- Livability +3.4/5.0
- Rent growth +2.5/5.0
- Condition / age +2.5/5.0
- Appreciation +0.0/10.0
$1,299,999
🖨 Deal sheet 📄 Offer letter ✓ Due diligence
Listing remarks MLS
Build Your Dream Home On This Beautiful Country Corner Lot On Quiet Street. Proximity To Kenney's Beach.
Key facts
- Custom cabinetry
- Landscaped property
- Quartz countertops
Tags
Property features AI
Exterior
- Parking: Driveway
- Utilities: Electricity connected (PSEG); Water connected; Septic tank
- Home design: Single-family residence; Actual property condition
- Construction: Frame construction
- Exterior features: Garden; Landscaped grounds; Private lot; Patio; Porch; Front-yard fencing; Irrigation equipment; Has spa
Interior
- Kitchen: Chef's kitchen with island; Breakfast bar; Dishwasher; Oven; Refrigerator
- Bedrooms: Total rooms: 8 (includes bedrooms and additional rooms)
- Flooring: Other
- Bathrooms: 3 full bathrooms; 1 half bathroom
- Heating & cooling: Forced air heating with propane; Central air conditioning; Gas fireplace (1)
- Interior features: First-floor bedroom; First-floor full bathroom; Breakfast bar; Chef's kitchen; Entrance foyer; Kitchen island; Open floor plan; Open kitchen; Primary bathroom; Master bedroom on main level; Walk-through kitchen; Walk-in closets; Home office; Full basement; Partial attic
- Laundry & utility: Washer; Dryer; Laundry inside
Neighborhood map
What this means for you Summary
Snapshot
- This is a 4-bed/3.5-bath single-family listed at $1.30M.
Deal economics
- At list price, monthly cash flow is $2k ($27k/yr) — positive.
- The deal already cash-flows at list — no discount required.
- To meet the 1% rule (rent ≥ 1% of price), the offer needs to be $1.29M (0.5% below list).
- Recommended offer: $1.26M (3.0% below list) — sets the bar for market timing.
- Cap rate 8.4% vs local median 6.9% in Southold — meaningfully above typical; check what's discounted (condition, days-on-market, listing class) to confirm the premium yield is real.
Location & tenants
- Location reads 67/100 on livability (#583 in NY) — a middle-class / working-renter tenant base. Strengths: crime A+, employment A+, health & safety B+; Watch: amenities F, commute F, cost of living F.
- Southold Union Free School District (town): math 46% / reading 59% proficiency, ranked #298 of 590 in NY (top 50%) — acceptable for families but not a draw, mixed tenant base, ~2y average lease; only 17% free/reduced lunch — higher-income household profile.
- Zoned schools: Southold Elementary School (math 37% / reading 62%, grade D, #1,085 of 2,108 statewide, top 56%, 317 students, 35% FRL); Southold Junior-Senior High School (math 52% / reading 52%, grade D+, #946 of 1,100 statewide, top 88%, 380 students, 40% FRL) — zoned schools average 38% FRL vs 17% district-wide (21 pts higher); higher-poverty schools than district average — tighter screening recommended.
- Market conditions: 79 active listings in the ZIP; 6 comparable units currently listed for rent nearby; rentals lingering (median 44d on market — plan ~5-8 weeks vacancy on turnover, expect pricing pressure); 100% of comp listings sitting > 30 days — soft ceiling on asking rent; 1,366 units permitted in Suffolk County in 2024 (216 in 5+ unit buildings).
Forward outlook
- Local home prices are declining (-3.0%/yr); year-one equity from $9k of loan paydown is wiped out by about $39k of value loss. Plan a longer hold.
- Suffolk County population projected to shrink 5% by 2050 — rents likely to lag national; underwrite the cash flow, not the appreciation.
Negotiation context
- It's been on market 44 days — a 3% lower offer ($1.26M) is reasonable based on typical stale-listing flexibility.
- 3 sale attempts since 7y ago; this cycle's ask has dropped $100k (7%) from the opening price — seller is motivated, your offer sets the floor, not the list.
- Current owner paid $210k; list at $1.30M implies a 519% gain — meaningful room to come down on a strong offer.
Risks & watch-outs
- Climate carrying-cost: severe wind risk, 80% chance of damaging wind over 30y — expect insurance premiums to compound above CPI over the hold.
Questions for the listing agent
- It's been on market 44 days. Have you received any prior offers? Is the seller open to a 3% concession, seller financing, or rate buy-down credit?
- Is there a deadline driving the sale (1031 exchange, divorce, estate, relocation)? That informs how much negotiation room exists.
- Schools are A-rated — typically a magnet for longer-tenancy family renters. What's the average tenant stay here, and is there a school-zone premium baked into asking?
- What's the average days-on-market for RENTAL listings here right now (not sales)? A rising rental-DOM trend means longer vacancies and softer asking-rent achievability than the comps imply.
- What's the recent tenant-quality profile in this submarket — average credit score on applications, eviction rate, late-payment / NSF rate, and stable-employment percentage? A property-management company in the area should have these aggregated.
- How much new for-sale + rental construction is in the pipeline within 1–3 miles? Heavy new supply typically softens prices + rents 12–24 months out; constrained supply supports both.
Investment metrics
- 1% rule
- 1.00% ✗
- Cap rate
- 8.37%
- Cash-on-cash
- 7.40%
- DSCR
- 1.33
- GRM
- 8.4
CMA / ARV
- ARV (median comp)
- $1,355,431
- List price
- $1,299,999
- Delta
- -4.09%
- Verdict
- FAIR
- Comps
- 12 within 1.0 mi
Show comp detail 4 sales within ~0.75 mi
| Address | Dist | Beds/Ba | Sqft | Sold | Price | $/sf | Match |
|---|---|---|---|---|---|---|---|
| 380 Hickory Rd | 0.15mi | 4/2.5 | 2,600 (+1%) | 7mo | $1,055,000 | $406 | 82 |
| 12250 Soundview Ave | 0.48mi | 3/3.5 (-1) | 2,400 (-7%) | 2mo | $1,300,000 | $542 | 60 |
| 670 Kenneys Rd | 0.35mi | 4/2.5 | 2,417 (-6%) | 15mo | $1,900,000 | $786 | 56 |
| 2045 Lake Dr | 0.48mi | 3/2.0 (-1) | 2,300 (-11%) | 22mo | $1,325,000 | $576 | 30 |
Match score weights: distance 35% · size 25% · config 20% · recency 20%. Top-matched comps best support the ARV.
Projected returns pro-forma
-3.0% appreciation · 3.0% rent growth · sell at horizon
- IRR
- -5.0%
- Equity multiple
- 0.81×
- Total profit
- $-68,035
- Equity at exit
- $193,834
- IRR
- 4.6%
- Equity multiple
- 1.34×
- Total profit
- $123,225
- Equity at exit
- $112,400
Cash invested: $364,000 (down + closing). Projections, not guarantees.
Landlord ↔ Tenant lean methodology
- Overall (STATE)
- 15 Strongly Tenant-Friendly
- State New York
- 15 Strongly Tenant-Friendly · D+10
- County
- — inherits STATE
- City
- — inherits STATE
ZIP-level market 11971
- Home prices YoY
- -15.8%
- Active inventory
- 79
- Price-to-rent
- 8.4×
Monthly cashflow live
- Estimated rent
- $12,939 medium interval (Pro) →
- Mortgage (P&I)
- −$6,817
- Tax from tax record
- −$617 /mo · $7,404/yr
- Insurance
- −$542
- HOA
- −$0
- Vacancy / Maint / Mgmt
- −$2,717
- Net cashflow
- $2,246
Break-even live
UW: 25.0% down · 7.5% · 30yr · 1.5% tax · 5.0% vac · 8.0% maint · 8.0% mgmt
Financing live
Cash to close
- Down payment
- $325,000
- Closing costs
- $39,000
- Reserves months
- —
- Total cash needed
- —
Loan-product check · same deal, 3 products live
Conventional
25% down · 7.5% · 30yr
- Down + closing
- —
- Monthly P&I
- —
- Monthly cashflow
- —
- DSCR
- —
- Eligible?
- —
Personal DTI + credit; lowest rate.
DSCR
20% down · 8.5% · 30yr
- Down + closing
- —
- Monthly P&I
- —
- Monthly cashflow
- —
- DSCR
- —
- Eligible?
- —
No personal income docs; deal must DSCR.
Hard money
10% down · 12.0% · 12mo
- Down + closing
- —
- Monthly P&I
- —
- Monthly cashflow
- —
- DSCR
- —
- Eligible?
- —
Short-term bridge; refi at stabilization.
Rent comps 6 comps
| Address | Beds | Baths | Sqft | Rent | $/sqft | DOM | Units | Dist |
|---|---|---|---|---|---|---|---|---|
| 485 Pine Rd Southold, NY | 3.0 | 2.5 | 2000 | $12,000 | $6.00 | 43d | 1 | 0.16mi |
| 270 N Sea Dr Southold, NY | 4.0 | 3.0 | 1800 | $22,500 | $12.50 | 43d | 1 | 0.29mi |
| 6710 Soundview Ave Southold, NY | 4.0 | 2.0 | 2000 | $4,900 | $2.45 | 43d | 1 | 0.60mi |
| 3400 Youngs Ave Southold, NY | 4.0 | 2.0 | 2000 | $7,500 | $3.75 | 43d | 1 | 1.00mi |
| 590 Soundview Avenue Ext Southold, NY | 4.0 | 4.5 | 3100 | $27,000 | $8.71 | 43d | 1 | 1.13mi |
| 275 Maier Pl Southold, NY | 3.0 | 2.0 | 2000 | $10,000 | $5.00 | 43d | 1 | 1.36mi |
Listing history 20 events
-
2026-06-18days on market $1,299,999 Active 44 DOM
-
2026-06-17days on market $1,299,999 Active 43 DOM
-
2026-06-16days on market $1,299,999 Active 42 DOM
-
2026-06-15days on market $1,299,999 Active 41 DOM
-
2026-06-13days on market $1,299,999 Active 39 DOM
-
2026-06-12days on market $1,299,999 Active 38 DOM
-
2026-06-09days on market $1,299,999 Active 35 DOM
-
2026-06-08days on market $1,299,999 Active 34 DOM
-
2026-06-07days on market $1,299,999 Active 33 DOM
-
2026-06-07days on market $1,299,999 Active 32 DOM
-
2026-06-04days on market $1,299,999 Active 29 DOM
-
2026-06-02pricedays on market $1,299,999 Active 28 DOM
-
2026-06-01days on market $1,399,999 Active 27 DOM
-
2026-05-31days on market $1,399,999 Active 26 DOM
-
2026-04-21$1,399,999 Active 2505-char remark
-
2021-03-11soldstatus $210,000
-
2021-02-22soldstatus $210,000 Closed 107-char remark
Show marketing remark (107 chars)
Build Your Dream Home On This Beautiful Country Corner Lot On Quiet Street. Proximity To Kenney's Beach.
-
2020-07-16status Active 107-char remark
Show marketing remark (107 chars)
Build Your Dream Home On This Beautiful Country Corner Lot On Quiet Street. Proximity To Kenney's Beach.
-
2020-07-15historical 107-char remark
Show marketing remark (107 chars)
Build Your Dream Home On This Beautiful Country Corner Lot On Quiet Street. Proximity To Kenney's Beach.
-
2019-01-22$259,000 New 107-char remark
Show marketing remark (107 chars)
Build Your Dream Home On This Beautiful Country Corner Lot On Quiet Street. Proximity To Kenney's Beach.
ⓘ Source: listings_history table (triggers on properties + properties_extension) + one-shot
backfill from property_details.listing_events for pre-trigger history.
Tax reassessment forecast NY · Partial reset (capped growth)
- Current annual tax
- $7,404 · $617/mo
- Projected year-2 tax
- $14,687 · $1,224/mo
- Expected delta
- +$7,283/yr (+$607/mo · 98.4%)
ⓘ Screening estimate from a state-policy table — verify with the county assessor before closing.
Climate risk First Street
- Flood 1/10 Low FEMA zone X (unshaded) · 0% chance over 30 yrs
- Wildfire 3/10 Moderate
- Heat 4/10 Moderate 6 d/yr ≥90°F today · 15 d/yr by 30 yrs out
- Wind 8/10 Severe 80% chance of damaging wind over 30 yrs
- Air quality 3/10 Moderate 3 unhealthy d/yr today · 4 by 30 yrs out
Nearby sold comps map
Loading sold comps map…
Walkable amenities ~0.75 mi
Loading nearby amenities…
Taxation est. · year 1
- Rental income
- $155,269
- − Mortgage interest
- −$72,820
- − Property taxes
- −$7,404
- − Insurance
- −$6,500
- − Repairs & maintenance
- −$12,422
- − Management
- −$12,422
- − Depreciation
- −$37,818
- Taxable income
- $5,884
- Est. tax owed @ 24.0%
- −$1,412
- After-tax cash flow
- $25,539/yr
For passive investors: Depreciation is non-cash, so a rental often shows a tax loss while cash-flowing — sheltering income. Rental losses are passive: they offset passive income freely, and up to $25,000/yr can offset ordinary (W-2) income if you actively participate and your MAGI is under $100k (phasing out to $0 by $150k); unused losses carry forward. On sale, claimed depreciation is recaptured at up to 25%, and gains may owe capital-gains tax (a 1031 exchange can defer both). Figures are a year-1 estimate at your 24.0% rate — not tax advice; consult a CPA.
Schools (NCES district)
- District
- Southold Union Free School District
- NCES district ID
- 3627620
- Math proficiency
- 46% ▼ -10.00%
- Reading proficiency
- 59% ▲ 6.00%
- Median HH income
- $78,622
- Composite
- 47.54/100
- National rank
- #2269
- State rank
- #298 of 590 in NY
Livability — Southold
- Score
- 67/100
- State rank
- #583
- US rank
- #10545
Category grades
Schools grade is shown separately in the Schools card above.
Census & demographics
- Census place
- Southold, NY
- City population
- 6,507
- Population (ZIP)
- 6,507
Population outlook (Suffolk County) Hauer SSP2
- Today (2025)
- 1,505,262 people
- By 2030
- 1,498,318 · -0.5%
- By 2040
- 1,471,101 · -2.3%
- By 2050
- 1,424,848 · -5.3%
- By 2075
- 1,337,157 · -11.2%
- By 2100
- 1,217,720 · -19.1%
Race, ethnicity, and origin ACS 2023
- Neighborhood character
- Predominantly White (78%)
- Race & ethnicity
- White 78% Hispanic / Latino 14% Two or more races 5% Asian 4%
- Hispanic origin (detail)
- Mexican 3% Puerto Rican 1% Dominican 3%
- Common ancestry
- Romanian 6% Italian 2% Slovak 2%
- Foreign-born
- 14% · Canada, China, Dominican Republic
- Languages at home
- 83% English-only · Spanish 11% Russian/Polish/Slavic 2% Other Indo-European 2%
Political lean MEDSL · Suffolk
- 2024 margin
- Lean R (+10.0) · D 45.0% · R 55.0%
- 2008→2024 swing
- -16.0pp toward R · 2008: 6.0pp · 2024: -10.0pp
- All cycles
- 2024: R+10.0 2020: R+0.0 2016: R+8.2 2012: D+2.9 2008: D+6.0
Not yet ingested
- Civics
- —
Market trends
- HPI YoY
- ▼ -74.14%
- Current HPI
- 396.5481
- Rent YoY
- —
- Metro
- —
- State GDP YoY
- ▲ 2.60%
- F500 in state
- 92
Industry mix (Fortune 500 HQ in NY)
| Industry | F500 HQs | Revenue |
|---|---|---|
| Financial Services | 10 | $950B |
|
||
| Consumer Goods | 9 | $162B |
|
||
| Insurance | 4 | $225B |
|
||
| Telecommunications | 2 | $144B |
|
||
| Pharmaceuticals | 2 | $112B |
|
||
| Media / Entertainment | 2 | $69B |
|
||
Price history
+401.9% since first listed7 events — show timeline
- 2026-06-02 Price Changed $1,299,999 OneKey® MLS as Distributed by MLS Grid
- 2026-04-21 Listed $1,399,999 OneKey® MLS as Distributed by MLS Grid
- 2021-03-11 Sold (Public Records) $210,000 Public Records
- 2021-02-22 Sold (MLS) $210,000 OneKey® MLS as Distributed by MLS Grid
- 2020-07-16 Relisted — OneKey® MLS as Distributed by MLS Grid
- 2020-07-15 Listing Removed — OneKey® MLS as Distributed by MLS Grid
- 2019-01-22 Listed $259,000 OneKey® MLS as Distributed by MLS Grid
Property tax history
+17.9%/yrLatest (2025): $7,404 · +0.0% YoY. Source: county tax records.
Cash-flow waterfall
monthlySold comps — $/sqft
last 12 mo · ≤1 miLoading sold comps…