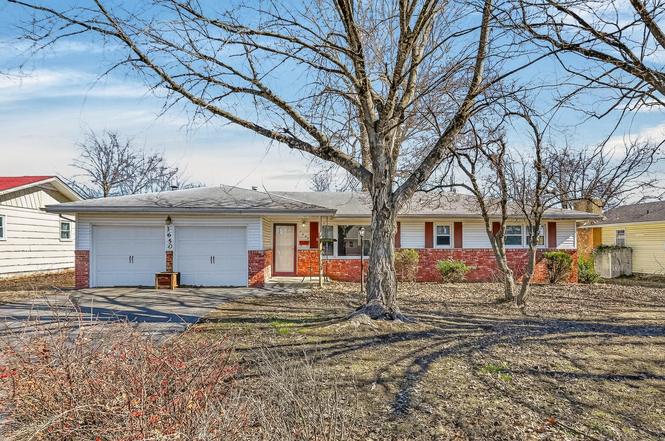
1650 S Saint Charles Ave · Springfield, MO
Flood risk 1/10 · Minimal
- FEMA flood zone
- X (unshaded)
- Chance of flooding over 30 yrs
- 0.0%
- Est. flood insurance / yr
- $507 – $1,088
Fire risk 3/10 · Minor
- Est. fire insurance / yr
- $1,054 – $1,958
Heat risk 5/10 · Moderate
- Hot days now (above 105°F)
- 7 days/yr
- Hot days in 30 yrs
- 19 days/yr
Wind risk 2/10 · Minimal
- Chance of severe wind over 30 yrs
- —
Air-quality risk 2/10 · Minimal
- Unhealthy air days now
- 2 days/yr
- Unhealthy air days in 30 yrs
- 2 days/yr
Risk factors via First Street. Map © Google.
Why this score? — see what drove the D- grade
The composite is a weighted blend of 9 inputs, each scored 0–100. Each bar is that input's sub-score; the figure is the points it added to the 100-point composite (weight × sub-score).
- Cash flow +11.1/30.0
- ARV discount +7.5/15.0
- Livability +3.8/5.0
- Rent growth +3.3/5.0
- DSCR +3.2/10.0
- Schools +3.2/10.0
- Condition / age +2.5/5.0
- 1% rule +2.2/10.0
- Appreciation +0.0/10.0
$214,900
🖨 Deal sheet (PDF) 📄 Offer letter ✓ Due diligence
Listing remarks MLS
This property is being offered ''as is'' Cash or conventional loan only. Buy it as an investment or enjoy it as your own home. Prime location just a block from East Sunshine for an easy commute. Boasting original hardwood floors, 2 living areas, spacious kitchen with granite counter tops, 2 full bathrooms, newer windows & sizeable fenced in yard with large deck. Storage shed remains with the home. Please note the ''4th Bedroom'' is nonconforming with no window. The walls could be removed to convert house back to 3 bedrooms and have a larger living room. The home is loaded with potential and this is a fantastic opportunity; call today for your showing or to submit an offer! Buyer and buyer's agent to do due diligence.
Key facts
- 0.26 acre lot
- 2 garage spots
- Built 1961
Neighborhood map
What this means for you Summary
Snapshot
- This is a 3-bed/2.0-bath single-family listed at $215k.
Deal economics
- At list price, monthly cash flow is $-86 ($-1k/yr) — negative.
- To cash-flow at today's rent, offer at most $200k (7.1% below list).
- To meet the 1% rule (rent ≥ 1% of price), the offer needs to be $155k (27.8% below list).
- Recommended offer: $155k (27.8% below list) — sets the bar for 1% rule.
- Cap rate 5.8% vs local median 4.6% in Springfield — meaningfully above typical; check what's discounted (condition, days-on-market, listing class) to confirm the premium yield is real.
Location & tenants
- Location reads 75/100 on livability (#57 in MO, #4,121 nationally) — a middle-class / working-renter tenant base. Strengths: commute A+, cost of living A+, housing A+; Watch: crime F, employment F.
- Springfield R-XII (urban): math 32% / reading 46% proficiency, ranked #174 of 324 in MO (top 54%) — families likely to look elsewhere, expect single-tenant / working-renter base with shorter leases.
- Zoned schools: Pittman Elem. (math 22% / reading 42%, grade F, #761 of 1,115 statewide, top 72%, 219 students, 66% FRL); Hickory Hills Middle (math 31% / reading 44%, grade F, #215 of 391 statewide, top 56%, 414 students, 46% FRL); Glendale High (math 21% / reading 55%, grade F, #290 of 521 statewide, top 56%, 1,307 students, 33% FRL) — zoned schools at 49% FRL track the district average.
- Market conditions: Rents rising (+3.2%/yr); 266 active listings in the ZIP; 24 comparable units currently listed for rent nearby; rentals at typical pace (median 26d on market — plan ~3-4 weeks tenant-placement turnaround); 1,302 units permitted in Greene County in 2024 (250 in 5+ unit buildings).
Forward outlook
- Local home prices are declining (-3.0%/yr); year-one equity from $1k of loan paydown is wiped out by about $6k of value loss. Plan a longer hold.
- Greene County population projected at +25% by 2050 — long-run rental-demand tailwind backs the buy-and-hold thesis.
Negotiation context
- It's been on market 69 days — a 6% lower offer ($202k) is reasonable based on typical stale-listing flexibility.
- 4 sale attempts since 9y ago with the ask held roughly flat each time — persistent listings suggest the price (not the market) is what's stuck; bring a comps-based counter.
Risks & watch-outs
- Climate carrying-cost: extreme-heat days projected 7→19/yr by 2055 (HVAC capex compounding) — expect insurance premiums to compound above CPI over the hold.
Questions for the listing agent
- What do current leases actually rent for vs. the listed asking? Can we see a recent rent roll and the last 12 months of T-12 income?
- It's been on market 69 days. Have you received any prior offers? Is the seller open to a 28% concession, seller financing, or rate buy-down credit?
- Built in 1961 — when were the roof, HVAC, electrical panel, plumbing, and water heater last replaced?
- Why hasn't it sold? Are there any deal-killer items the seller is aware of (foundation, flood, title, zoning, code violations)?
- Is there a deadline driving the sale (1031 exchange, divorce, estate, relocation)? That informs how much negotiation room exists.
- Crime grade is F in this area — have there been break-ins, vandalism, or insurance claims at this property in the last 3 years? What carrier currently insures it and at what premium?
- The area grade is low — what's the realistic commute time and amenity access for the typical tenant pool here? Any planned neighborhood developments (good or bad) we should know about?
- What's the average days-on-market for RENTAL listings here right now (not sales)? A rising rental-DOM trend means longer vacancies and softer asking-rent achievability than the comps imply.
- What's the recent tenant-quality profile in this submarket — average credit score on applications, eviction rate, late-payment / NSF rate, and stable-employment percentage? A property-management company in the area should have these aggregated.
- How much new for-sale + rental construction is in the pipeline within 1–3 miles? Heavy new supply typically softens prices + rents 12–24 months out; constrained supply supports both.
Investment metrics
- 1% rule
- 0.72% ✗
- Cap rate
- 5.81%
- Cash-on-cash
- -1.72%
- DSCR
- 0.92
- GRM
- 11.5
CMA / ARV
- ARV (on-the-fly)
- $214,848
- Comps found
- 12
Show comp detail 12 sales within ~0.75 mi
| Address | Dist | Beds/Ba | Sqft | Sold | Price | $/sf | Match |
|---|---|---|---|---|---|---|---|
| 1650 S Saint Charles Ave | 0.00mi | 4/2.0 (+1) | 1,492 (0%) | 0mo | $214,900 | $144 | 95 |
| 1634 S St Charles Ave | 0.03mi | 3/2.0 | 1,452 (-3%) | 0mo | $204,900 | $141 | 94 |
| 1503 S Sieger Dr | 0.30mi | 3/2.0 | 1,556 (+4%) | 4mo | $219,900 | $141 | 76 |
| 1650 S Sieger Dr | 0.12mi | 3/2.0 | 1,690 (+13%) | 0mo | $245,000 | $145 | 72 |
| 1357 S Catalina Ave | 0.44mi | 3/2.0 | 1,546 (+4%) | 4mo | $255,000 | $165 | 71 |
| 3321 E Whiteside St | 0.59mi | 3/2.0 | 1,540 (+3%) | 1mo | $249,000 | $162 | 66 |
| 2738 E Verona St | 0.70mi | 3/2.0 | 1,568 (+5%) | 1mo | $190,000 | $121 | 58 |
| 1927 S Plaza Ave | 0.39mi | 3/1.5 | 1,680 (+13%) | 4mo | $230,000 | $137 | 55 |
| 2917 E Portland St | 0.42mi | 3/1.5 | 1,696 (+14%) | 1mo | $245,000 | $144 | 54 |
| 1984 S Meadowview Ave | 0.58mi | 3/2.0 | 1,665 (+12%) | 4mo | $297,500 | $179 | 50 |
| 2648 E Portland St | 0.72mi | 3/1.5 | 1,620 (+9%) | 1mo | $219,000 | $135 | 50 |
| 3326 E Whiteside St | 0.62mi | 3/2.0 | 1,276 (-14%) | 0mo | $249,900 | $196 | 46 |
Match score weights: distance 35% · size 25% · config 20% · recency 20%. Top-matched comps best support the ARV.
Projected returns pro-forma
-3.0% appreciation · 3.23% rent growth · sell at horizon
- IRR
- -19.0%
- Equity multiple
- 0.33×
- Total profit
- $-40,031
- Equity at exit
- $32,042
- IRR
- -11.2%
- Equity multiple
- 0.32×
- Total profit
- $-40,775
- Equity at exit
- $18,581
Cash invested: $60,172 (down + closing). Projections, not guarantees.
Landlord ↔ Tenant lean methodology
- Overall (STATE)
- 81 Strongly Landlord-Friendly
- State Missouri
- 81 Strongly Landlord-Friendly · R+10
- County
- — inherits STATE
- City
- — inherits STATE
ZIP-level market 65804
- Rents YoY
- 3.2%
- Active inventory
- 266
- Price-to-rent
- 11.5×
Monthly cashflow live
- Estimated rent
- $1,552 high interval (Pro) →
- Mortgage (P&I)
- −$1,127
- Tax from tax record
- −$96 /mo · $1,146/yr
- Insurance
- −$90
- HOA
- −$0
- Vacancy / Maint / Mgmt
- −$326
- Net cashflow
- $-86
Break-even live
Sensitivity live
| Price | -10% $36 | -5% $-25 | +0% $-86 | +5% $-147 | +10% $-208 |
|---|---|---|---|---|---|
| Rent | -10% $-209 | -5% $-147 | +0% $-86 | +5% $-25 | +10% $36 |
| Rate | -1.0pp $22 | -0.5pp $-31 | base $-86 | +0.5pp $-142 | +1.0pp $-198 |
UW: 25.0% down · 7.5% · 30yr · 1.5% tax · 5.0% vac · 8.0% maint · 8.0% mgmt
Financing live
Cash to close
- Down payment
- $53,725
- Closing costs
- $6,447
- Reserves months
- —
- Total cash needed
- —
Loan-product check · same deal, 3 products live
Conventional
25% down · 7.5% · 30yr
- Down + closing
- —
- Monthly P&I
- —
- Monthly cashflow
- —
- DSCR
- —
- Eligible?
- —
Personal DTI + credit; lowest rate.
DSCR
20% down · 8.5% · 30yr
- Down + closing
- —
- Monthly P&I
- —
- Monthly cashflow
- —
- DSCR
- —
- Eligible?
- —
No personal income docs; deal must DSCR.
Hard money
10% down · 12.0% · 12mo
- Down + closing
- —
- Monthly P&I
- —
- Monthly cashflow
- —
- DSCR
- —
- Eligible?
- —
Short-term bridge; refi at stabilization.
Rent comps 24 comps
| Address | Beds | Baths | Sqft | Rent | $/sqft | DOM | Units | Dist |
|---|---|---|---|---|---|---|---|---|
| 1603 S Saint Charles Ave Springfield, MO | 3.0 | 2.0 | 1452 | $1,695 | $1.17 | 45d | 1 | 0.10mi |
| 1528 S Catalina Ave Springfield, MO | 3.0 | 1.0 | 1326 | $1,440 | $1.09 | 45d | 1 | 0.23mi |
| 1920 S Mayfair Ave Springfield, MO | 4.0 | 2.0 | 1440 | $1,895 | $1.32 | 25d | 1 | 0.23mi |
| 1940 S Ingram Mill Rd Springfield, MO | 2.0 | 1.0 | 900 | $875 | $0.97 | 15d | 1 | 0.42mi |
| 2831 E University St Springfield, MO | 2.0 | 1.0 | 975 | $1,095 | $1.12 | 25d | 1 | 0.48mi |
| 2831 E University St Springfield, MO | 2.0 | 1.0 | 950 | $1,195 | $1.26 | 15d | 1 | 0.48mi |
| 2848 E Eastmoor Dr Springfield, MO | 3.0 | 2.0 | 1564 | $1,725 | $1.10 | 15d | 1 | 0.50mi |
| 2804 E Linwood St Springfield, MO | 3.0 | 2.0 | 1400 | $1,650 | $1.18 | 15d | 1 | 0.55mi |
| 2122 S Barcliff Ave Springfield, MO | 2.0 | 1.5 | 900 | $1,095 | $1.22 | 15d | 3 | 0.57mi |
| 1225 S Ingram Mill Rd Springfield, MO | 1.0–2.0 | 1.0–2.0 | 1150 | $2,345 | $2.04 | 15d | 4 | 0.60mi |
| 2765 E Verona St Springfield, MO | 3.0 | 2.0 | 1244 | $1,600 | $1.29 | 45d | 1 | 0.65mi |
| 2641 E Verona St Springfield, MO | 3.0 | 2.0 | 1293 | $1,750 | $1.35 | 25d | 1 | 0.77mi |
| 2320 S Ingram Mill Rd Springfield, MO | 2.0 | 1.0–2.0 | 646 | $1,825 | $2.83 | 15d | 7 | 0.81mi |
| 3440 E Lombard St Unit 129 Springfield, MO | 2.0 | 1.5 | 900 | $875 | $0.97 | 25d | 1 | 0.98mi |
| 3440 E Lombard St Unit 110 Springfield, MO | 2.0 | 1.5 | 900 | $875 | $0.97 | 45d | 1 | 0.98mi |
| 3501 E Lombard St Springfield, MO | 1.0–3.0 | 1.0–2.0 | 800 | $1,065 | $1.33 | 45d | 1 | 1.08mi |
| 2546 S Ingram Mill Rd Springfield, MO | 1.0–2.0 | 1.0 | 787 | $925 | $1.17 | 15d | 4 | 1.10mi |
| 2559 S Linden Ave Springfield, MO | 2.0 | 2.0 | 960 | $850 | $0.89 | 25d | 1 | 1.11mi |
| 3353 E Sunset St Unit B Springfield, MO | 2.0 | 1.5 | 1008 | $900 | $0.89 | 15d | 1 | 1.11mi |
| 3421 E Sunset St Unit 3421 Sunset Springfield, MO | 3.0 | 2.0 | 1500 | $1,395 | $0.93 | 23d | 1 | 1.16mi |
| 3080 E Cherry St Unit F104-ADA Springfield, MO | 3.0 | 2.0 | 1030 | $1,500 | $1.46 | 25d | 1 | 1.28mi |
| 3080 E Cherry St Unit H104-ADA Springfield, MO | 3.0 | 2.0 | 1030 | $1,565 | $1.52 | 45d | 1 | 1.28mi |
| 2149 E Sunshine St Springfield, MO | 1.0–2.0 | 1.0–1.5 | 671 | $1,453 | $2.17 | 15d | 20 | 1.31mi |
| 2146 E Bennett St Unit 0 Springfield, MO | 2.0 | 1.0 | 1009 | $895 | $0.89 | 45d | 1 | 1.38mi |
Listing history 12 events
-
2026-04-21status Pending
-
2026-04-07price $214,900
-
2026-02-11$219,900 Active
-
2024-11-22historical $1,495
-
2024-11-12$1,495
-
2022-02-15price $1,350
-
2021-09-21soldstatus 732-char remark
Show marketing remark (732 chars)
This property is being offered ''as is'' Cash or conventional loan only. Buy it as an investment or enjoy it as your own home. Prime location just a block from East Sunshine for an easy commute. Boasting original hardwood floors, 2 living areas, spacious kitchen with granite counter tops, 2 full bathrooms, newer windows & sizeable fenced in yard with large deck. Storage shed remains with the home. Please note the ''4th Bedroom'' is nonconforming with no window. The walls could be removed to convert house back to 3 bedrooms and have a larger living room. The home is loaded with potential and this is a fantastic opportunity; call today for your showing or to submit an offer! Buyer and buyer's agent to do due diligence.
-
2021-08-27$160,000 732-char remark
Show marketing remark (732 chars)
This property is being offered ''as is'' Cash or conventional loan only. Buy it as an investment or enjoy it as your own home. Prime location just a block from East Sunshine for an easy commute. Boasting original hardwood floors, 2 living areas, spacious kitchen with granite counter tops, 2 full bathrooms, newer windows & sizeable fenced in yard with large deck. Storage shed remains with the home. Please note the ''4th Bedroom'' is nonconforming with no window. The walls could be removed to convert house back to 3 bedrooms and have a larger living room. The home is loaded with potential and this is a fantastic opportunity; call today for your showing or to submit an offer! Buyer and buyer's agent to do due diligence.
-
2017-06-02soldstatus 772-char remark
Show marketing remark (772 chars)
Located close to 65 and 44 for easy commuting, this welcoming 3 bed/2 bath home with 2 living areas is move-in ready! Walk into the living room with beautiful hardwoods. The spacious alley-style kitchen/dining combo features ample cabinets, vast granite counters, and flows seamlessly into the comfortable family room. Highlights of the family room include a stunning floor-to-ceiling brick fireplace and natural light. Hardwoods continue into the roomy bedrooms. Additional features of the home include new HVAC system installed in 2016 and newer roof installed in 2015. Outdoor living is relaxing and easy with large back deck and massive backyard w/ garden area and storage shed. This home has been well-loved and is ready for a new family to love it for years to come!
-
2017-06-01soldstatus
-
2017-04-05$114,000 772-char remark
Show marketing remark (772 chars)
Located close to 65 and 44 for easy commuting, this welcoming 3 bed/2 bath home with 2 living areas is move-in ready! Walk into the living room with beautiful hardwoods. The spacious alley-style kitchen/dining combo features ample cabinets, vast granite counters, and flows seamlessly into the comfortable family room. Highlights of the family room include a stunning floor-to-ceiling brick fireplace and natural light. Hardwoods continue into the roomy bedrooms. Additional features of the home include new HVAC system installed in 2016 and newer roof installed in 2015. Outdoor living is relaxing and easy with large back deck and massive backyard w/ garden area and storage shed. This home has been well-loved and is ready for a new family to love it for years to come!
-
2006-07-20soldstatus
ⓘ Source: listings_history table (triggers on properties + properties_extension) + one-shot
backfill from property_details.listing_events for pre-trigger history.
Tax reassessment forecast MO · Resets to sale price
- Current annual tax
- $1,146 · $96/mo
- Projected year-2 tax
- $2,085 · $174/mo
- Expected delta
- +$938/yr (+$78/mo · 81.8%)
ⓘ Screening estimate from a state-policy table — verify with the county assessor before closing.
Climate risk First Street
- Flood 1/10 Low FEMA zone X (unshaded) · 0% chance over 30 yrs
- Wildfire 3/10 Moderate
- Heat 5/10 Major 7 d/yr ≥105°F today · 19 d/yr by 30 yrs out
- Wind 2/10 Low
- Air quality 2/10 Low 2 unhealthy d/yr today · 2 by 30 yrs out
Nearby sold comps map
Loading sold comps map…
Walkable amenities ~0.75 mi
Loading nearby amenities…
Taxation est. · year 1
- Rental income
- $18,621
- − Mortgage interest
- −$12,038
- − Property taxes
- −$1,146
- − Insurance
- −$1,074
- − Repairs & maintenance
- −$1,490
- − Management
- −$1,490
- − Depreciation
- −$6,252
- Taxable loss
- −$4,868
- Est. tax savings @ 24.0%
- +$1,168
- After-tax cash flow
- $135/yr
For passive investors: Depreciation is non-cash, so a rental often shows a tax loss while cash-flowing — sheltering income. Rental losses are passive: they offset passive income freely, and up to $25,000/yr can offset ordinary (W-2) income if you actively participate and your MAGI is under $100k (phasing out to $0 by $150k); unused losses carry forward. On sale, claimed depreciation is recaptured at up to 25%, and gains may owe capital-gains tax (a 1031 exchange can defer both). Figures are a year-1 estimate at your 24.0% rate — not tax advice; consult a CPA.
Schools (NCES district)
- District
- Springfield R-XII
- NCES district ID
- 2928860
- Math proficiency
- 32% ▼ -2.00%
- Reading proficiency
- 46% ▼ -3.00%
- Median HH income
- $37,886
- Composite
- 32.45/100
- National rank
- #5717
- State rank
- #174 of 324 in MO
Livability — Springfield
- Score
- 75/100
- State rank
- #57
- US rank
- #4121
Category grades
Schools grade is shown separately in the Schools card above.
Census & demographics
- Census place
- Springfield, MO
- County
- Greene County · 244,327 people
- City population
- 223,044
- Metro
- Springfield, MO
- Population (ZIP)
- 40,935
- Household income
- $62,301
- Rent vs Own
- Severe rent burden
- 1412.0
Population outlook (Greene County) Hauer SSP2
- Today (2025)
- 319,054 people
- By 2030
- 335,135 · +5.0%
- By 2040
- 366,186 · +14.8%
- By 2050
- 397,431 · +24.6%
- By 2075
- 477,035 · +49.5%
- By 2100
- 520,828 · +63.2%
Race, ethnicity, and origin ACS 2023
- Neighborhood character
- Predominantly White (87%)
- Race & ethnicity
- White 87% Two or more races 5% Hispanic / Latino 4% Black 2% Asian 2%
- Common ancestry
- Italian 3% Lithuanian 3% Slovak 3%
- Foreign-born
- 3% · Canada, South Korea
- Languages at home
- 95% English-only · Spanish 2% Other Indo-European 1%
Political lean MEDSL · Greene
- 2024 margin
- Strong R (+20.8) · D 38.9% · R 59.7% · Other 1.4%
- 2008→2024 swing
- -5.0pp toward R · 2008: -15.8pp · 2024: -20.8pp
- All cycles
- 2024: R+20.8 2020: R+20.1 2016: R+27.4 2012: R+24.4 2008: R+15.8
Not yet ingested
- Civics
- —
Market trends
- HPI YoY
- ▼ -271.81%
- Current HPI
- 197.8418
- Rent YoY
- ▲ 3.23%
- Metro
- Springfield, MO
- State GDP YoY
- ▲ 1.84%
- F500 in state
- 20
Industry mix (Fortune 500 HQ in MO)
| Industry | F500 HQs | Revenue |
|---|---|---|
| Healthcare | 1 | $163B |
|
||
| Insurance | 1 | $21B |
|
||
| Industrial Technology | 1 | $17B |
|
||
| Retail | 1 | $16B |
|
||
| Industrial Distribution | 1 | $10B |
|
||
| Utilities | 1 | $9B |
|
||
Price history
+88.5% since first listed12 events — show timeline
- 2026-04-21 Pending — SOMO
- 2026-04-07 Price Changed $214,900 SOMO
- 2026-02-11 Listed $219,900 SOMO
- 2024-11-22 Rental Removed $1,495 APPFOLIO
- 2024-11-12 Listed for Rent $1,495 APPFOLIO
- 2022-02-15 Price Changed $1,350 RENT.
- 2021-09-21 Sold (MLS) — SOMO
- 2021-08-27 Listed $160,000 SOMO
- 2017-06-02 Sold (MLS) — SOMO
- 2017-06-01 Sold (Public Records) — Public Records
- 2017-04-05 Listed $114,000 SOMO
- 2006-07-20 Sold (Public Records) — Public Records
Property tax history
+4.6%/yrLatest (2025): $1,146 · +15.1% YoY. Source: county tax records.
Cash-flow waterfall
monthlySold comps — $/sqft
last 12 mo · ≤1 miLoading sold comps…