 🌊 Lakefront
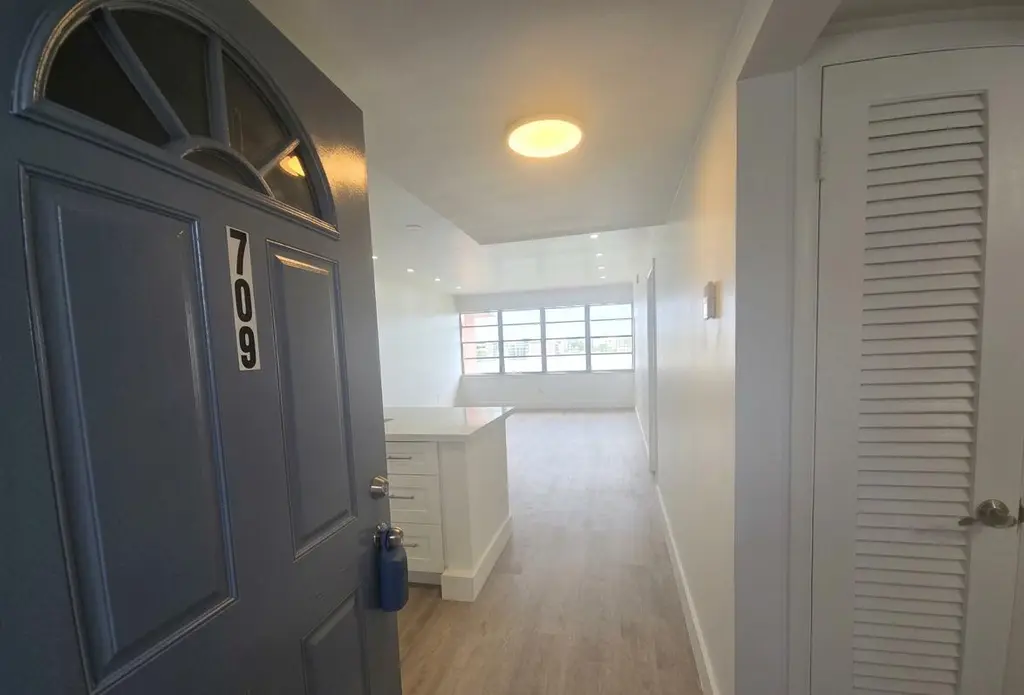
18555 NE 14th Ave #709 · Ojus, FL
Flood risk 6/10 · Moderate
- FEMA flood zone
- X (unshaded)
- Chance of flooding over 30 yrs
- 0.48%
- Est. flood insurance / yr
- $507 – $1,088
Fire risk 1/10 · Minimal
- Est. fire insurance / yr
- $947 – $1,759
Heat risk 10/10 · Severe
- Hot days now (above 104°F)
- 7 days/yr
- Hot days in 30 yrs
- 24 days/yr
Wind risk 10/10 · Severe
- Chance of severe wind over 30 yrs
- 99.0%
Air-quality risk 2/10 · Minimal
- Unhealthy air days now
- 1 days/yr
- Unhealthy air days in 30 yrs
- 2 days/yr
Risk factors via First Street. Map © Google.
Why this score? — see what drove the B grade
The composite is a weighted blend of 9 inputs, each scored 0–100. Each bar is that input's sub-score; the figure is the points it added to the 100-point composite (weight × sub-score).
- Cash flow +29.4/30.0
- 1% rule +10.0/10.0
- DSCR +10.0/10.0
- ARV discount +7.5/15.0
- Schools +4.2/10.0
- Livability +4.2/5.0
- Rent growth +2.6/5.0
- Condition / age +2.5/5.0
- Appreciation +0.0/10.0
$199,000
🖨 Deal sheet 📄 Offer letter ✓ Due diligence
Listing remarks
SELLER IS CONTRIBUTING $5,000 toward the buyer's closing costs. CORNER UNIT 1-bedroom, 1-bath in 55+ community, FULLY REMODELED AND BRIGHT SPACIOUS DESIGN with brand-new vinyl flooring, freshly painted interior, and an INCREDIBLE PANORAMIC SKY LAKE VIEW offering NATURAL LIGHT, SERENITY, AND TRANQUILITY. WAKE UP TO LAKE VIEWS EVERY DAY. MODERN OPEN-CONCEPT KITCHEN with STAINLESS STEEL APPLIANCES, large walk-in closet, assigned parking near elevator, and ample guest parking. WELL MAINTAINED BUILDING with great amenities including 2 pools (1 heated), gym, and library. PRIME LOCATION just minutes from Sky Lake shopping center, Expressway I-95, Biscayne Blvd, Aventura Mall, dining, and entertain
Key facts
- 2 pools
- Assigned parking
- $458 HOA
Tags
Property features AI
Finance
- Financial info: Pets not allowed
- HOA & community: Has association (Sixth Moorings); Monthly HOA fee; HOA includes sewer, trash, common areas, elevator, roof repairs, recreation facility, pool service; Association amenities: Elevator(s), Fitness Center, Laundry, Management, Parking, Pool, Manager On Site, Trash Chute, Community Room, Heated Pool, Library, Sidewalks, Street Lights, Maintenance, Recreation Facilities; Senior community
Exterior
- Parking: Assigned parking; Guest parking; Asphalt parking surface; 2 total parking spaces
- Security: Smoke detector(s)
- Utilities: Public water; Public sewer; Electricity connected (220 volts in kitchen); Water connected; Sewer available
- Home design: Condominium; Three or more levels; Updated/remodeled; Entry level: 3; Faces southeast
- Construction: Stucco and concrete block with stucco construction; Built-up/flat roof; Slab foundation; Originally built prior to current records (public records list living area)
- Exterior features: Sidewalks; Paved public road; No waterfront
Interior
- Kitchen: Dishwasher; Electric range; Microwave; Refrigerator; Disposal; Electric water heater
- Bedrooms: No main level bedrooms
- Flooring: Ceramic tile; Laminate; Wood
- Bathrooms: 1 full bathroom
- Heating & cooling: Central electric heat; Central air; Ceiling fan(s)
- Interior features: Walk-in closet(s); Blinds
- Laundry & utility: Common area laundry room
Neighborhood map
What this means for you Summary
Snapshot
- This is a 1-bed/1.0-bath condo listed at $199k.
Deal economics
- At list price, monthly cash flow is $708 ($8k/yr) — positive.
- The deal already cash-flows at list — no discount required.
- Meets the 1% rule at list price ($3k rent vs $199k).
- Recommended offer: $187k (6.0% below list) — sets the bar for market timing.
- Cap rate 10.6% vs local median 8.7% in Ojus — meaningfully above typical; check what's discounted (condition, days-on-market, listing class) to confirm the premium yield is real.
Location & tenants
- Location reads 83/100 on livability (#58 in FL, #1,031 nationally) — a professional / high-income tenant draw. Strengths: commute A+, housing A+, health & safety A+; Watch: amenities F.
- Miami-Dade (suburban): math 45% / reading 54% proficiency, ranked #40 of 73 in FL (top 55%) — families likely to look elsewhere, expect single-tenant / working-renter base with shorter leases; 64% free/reduced lunch — lower-income household profile, screen leases tightly.
- Zoned schools: Ojus Elementary School (math 56% / reading 59%, grade C+, #764 of 2,144 statewide, top 36%, 776 students, 63% FRL); Highland Oaks Middle School (math 28% / reading 51%, grade F, #373 of 571 statewide, top 66%, 774 students, 50% FRL); Dr. Michael M. Krop Senior High (math 21% / reading 46%, grade F, #400 of 667 statewide, top 61%, 2,235 students, 49% FRL).
- Market conditions: Rents flat; 572 active listings in the ZIP; 10,051 units permitted in Miami-Dade County in 2024 (7,758 in 5+ unit buildings).
- At $3,126/mo this rent would consume 58% of the median local household income ($65k/yr) (locally 3123% of renters already pay >50% of income on rent) — very limited rent-growth headroom before tenants either downsize or default.
Forward outlook
- Local home prices are declining (-3.0%/yr); year-one equity from $1k of loan paydown is wiped out by about $6k of value loss. Plan a longer hold.
- Miami-Dade County population projected at +28% by 2050 — long-run rental-demand tailwind backs the buy-and-hold thesis.
Negotiation context
- It's been on market 80 days — a 6% lower offer ($187k) is reasonable based on typical stale-listing flexibility.
- Current owner paid $77k; list at $199k implies a 159% gain — meaningful room to come down on a strong offer.
Risks & watch-outs
- Climate carrying-cost: major flood risk; severe wind risk, 99% chance of damaging wind over 30y; extreme-heat days projected 7→24/yr by 2055 (HVAC capex compounding) — expect insurance premiums to compound above CPI over the hold.
Questions for the listing agent
- It's been on market 80 days. Have you received any prior offers? Is the seller open to a 6% concession, seller financing, or rate buy-down credit?
- Built in 1967 — when were the roof, HVAC, electrical panel, plumbing, and water heater last replaced?
- What does the HOA fee cover, when was the last increase, and are there any pending special assessments or reserve-fund shortfalls?
- Any open or pending special assessments — roof, HVAC, plumbing, elevator, façade? What's the per-unit balance and payoff schedule, and is the seller paying it off at close or rolling it to the buyer?
- Why hasn't it sold? Are there any deal-killer items the seller is aware of (foundation, flood, title, zoning, code violations)?
- Is there a deadline driving the sale (1031 exchange, divorce, estate, relocation)? That informs how much negotiation room exists.
- Schools are D-rated, which usually means shorter tenancies and higher turnover. Who's the typical renter profile here, and what's been the actual vacancy rate?
- This sits on a lake — are riparian / water-frontage rights deeded with the parcel? Any dock permits, shoreline easements, or HOA water-use restrictions?
- What's the documented flood / surge / shoreline-erosion history here (FEMA AND non-FEMA — e.g., storm surge, creek backup, septic-field saturation)?
- Any water-quality or seasonal algae-bloom issues that affect tenant satisfaction or short-term-rental demand?
- What's the average days-on-market for RENTAL listings here right now (not sales)? A rising rental-DOM trend means longer vacancies and softer asking-rent achievability than the comps imply.
- What's the recent tenant-quality profile in this submarket — average credit score on applications, eviction rate, late-payment / NSF rate, and stable-employment percentage? A property-management company in the area should have these aggregated.
- How much new apartment / multifamily construction is in the pipeline within 1–3 miles? Heavy new supply (>2% of stock underway) typically softens rents 12–24 months out; light construction supports rent growth.
Investment metrics
- 1% rule
- 1.57% ✓
- Cap rate
- 10.56%
- Cash-on-cash
- 15.24%
- DSCR
- 1.68
- GRM
- 5.3
CMA / ARV
No comps found within radius.
Projected returns pro-forma
-3.0% appreciation · 0.22% rent growth · sell at horizon
- IRR
- 2.2%
- Equity multiple
- 1.08×
- Total profit
- $4,593
- Equity at exit
- $29,672
- IRR
- 8.3%
- Equity multiple
- 1.54×
- Total profit
- $30,163
- Equity at exit
- $17,206
Cash invested: $55,720 (down + closing). Projections, not guarantees.
Landlord ↔ Tenant lean methodology
- Overall (STATE)
- 87 Strongly Landlord-Friendly
- State Florida
- 87 Strongly Landlord-Friendly · R+3
- County
- — inherits STATE
- City
- — inherits STATE
ZIP-level market 33179
- Rents YoY
- 0.2%
- Active inventory
- 572
- Price-to-rent
- 5.3×
Monthly cashflow live
- Estimated rent
- $3,126 medium interval (Pro) →
- Mortgage (P&I)
- −$1,044
- Tax from tax record
- −$177 /mo · $2,127/yr
- Insurance
- −$83
- HOA
- −$458
- Vacancy / Maint / Mgmt
- −$656
- Net cashflow
- $708
Break-even live
UW: 25.0% down · 7.5% · 30yr · 1.5% tax · 5.0% vac · 8.0% maint · 8.0% mgmt
Financing live
Cash to close
- Down payment
- $49,750
- Closing costs
- $5,970
- Reserves months
- —
- Total cash needed
- —
Loan-product check · same deal, 3 products live
Conventional
25% down · 7.5% · 30yr
- Down + closing
- —
- Monthly P&I
- —
- Monthly cashflow
- —
- DSCR
- —
- Eligible?
- —
Personal DTI + credit; lowest rate.
DSCR
20% down · 8.5% · 30yr
- Down + closing
- —
- Monthly P&I
- —
- Monthly cashflow
- —
- DSCR
- —
- Eligible?
- —
No personal income docs; deal must DSCR.
Hard money
10% down · 12.0% · 12mo
- Down + closing
- —
- Monthly P&I
- —
- Monthly cashflow
- —
- DSCR
- —
- Eligible?
- —
Short-term bridge; refi at stabilization.
HOA detail condo
- Monthly dues
- $458 · $5,496/yr
- Likely covers
- poolgymparking
- Assessments
- None detected in remarks — confirm with the listing agent.
Listing history 16 events
-
2026-06-18days on market $199,000 Active 80 DOM
-
2026-06-17days on market $199,000 Active 79 DOM
-
2026-06-16days on market $199,000 Active 78 DOM
-
2026-06-15days on market $199,000 Active 77 DOM
-
2026-06-13days on market $199,000 Active 75 DOM
-
2026-06-09days on market $199,000 Active 71 DOM
-
2026-06-08days on market $199,000 Active 70 DOM
-
2026-06-07days on market $199,000 Active 69 DOM
-
2026-06-04days on market $199,000 Active 66 DOM
-
2026-06-03days on market $199,000 Active 65 DOM
-
2026-06-02days on market $199,000 Active 64 DOM
-
2026-06-01days on market $199,000 Active 63 DOM
-
2026-05-31days on market $199,000 Active 62 DOM
-
2026-03-27$199,000 Active
-
2004-10-14soldstatus $76,900
-
1998-11-24soldstatus $28,000
ⓘ Source: listings_history table (triggers on properties + properties_extension) + one-shot
backfill from property_details.listing_events for pre-trigger history.
Tax reassessment forecast FL · Resets to sale price
- Current annual tax
- $2,127 · $177/mo
- Projected year-2 tax
- $2,127 · $177/mo
- Expected delta
- $0/yr ($0/mo · 0.0%)
ⓘ Screening estimate from a state-policy table — verify with the county assessor before closing.
Climate risk First Street
- Flood 6/10 Major FEMA zone X (unshaded) · 48% chance over 30 yrs
- Wildfire 1/10 Low
- Heat 10/10 Extreme 7 d/yr ≥104°F today · 24 d/yr by 30 yrs out
- Wind 10/10 Extreme 99% chance of damaging wind over 30 yrs
- Air quality 2/10 Low 1 unhealthy d/yr today · 2 by 30 yrs out
Nearby sold comps map
Loading sold comps map…
Walkable amenities ~0.75 mi
Loading nearby amenities…
Taxation est. · year 1
- Rental income
- $37,507
- − Mortgage interest
- −$11,147
- − Property taxes
- −$2,127
- − Insurance
- −$995
- − Repairs & maintenance
- −$3,001
- − Management
- −$3,001
- − HOA
- −$5,496
- − Depreciation
- −$5,789
- Taxable income
- $5,952
- Est. tax owed @ 24.0%
- −$1,429
- After-tax cash flow
- $7,062/yr
For passive investors: Depreciation is non-cash, so a rental often shows a tax loss while cash-flowing — sheltering income. Rental losses are passive: they offset passive income freely, and up to $25,000/yr can offset ordinary (W-2) income if you actively participate and your MAGI is under $100k (phasing out to $0 by $150k); unused losses carry forward. On sale, claimed depreciation is recaptured at up to 25%, and gains may owe capital-gains tax (a 1031 exchange can defer both). Figures are a year-1 estimate at your 24.0% rate — not tax advice; consult a CPA.
Schools (NCES district)
- District
- Miami-Dade
- NCES district ID
- 1200390
- Math proficiency
- 45% ▼ -16.00%
- Reading proficiency
- 54% ▼ -5.00%
- Median HH income
- $43,928
- Composite
- 41.76/100
- National rank
- #3397
- State rank
- #40 of 73 in FL
Livability — Ojus
- Score
- 83/100
- State rank
- #58
- US rank
- #1031
Category grades
Schools grade is shown separately in the Schools card above.
Census & demographics
- Census place
- Ojus, FL
- County
- Miami-Dade County · 2,697,751 people
- Metro
- Miami-Fort Lauderdale-Pompano Beach, FL
- Population (ZIP)
- 51,591
- Household income
- $65,211
- Rent vs Own
- Severe rent burden
- 3123.0
Population outlook (Miami-Dade County) Hauer SSP2
- Today (2025)
- 3,126,439 people
- By 2030
- 3,325,765 · +6.4%
- By 2040
- 3,697,561 · +18.3%
- By 2050
- 4,012,134 · +28.3%
- By 2075
- 4,605,612 · +47.3%
- By 2100
- 4,866,598 · +55.7%
Race, ethnicity, and origin ACS 2023
- Neighborhood character
- Diverse neighborhood (Simpson 0.67)
- Race & ethnicity
- Black 39% Hispanic / Latino 38% Two or more races 23% White 19% Asian 1%
- Hispanic origin (detail)
- Mexican 1% Puerto Rican 2% Cuban 6% Dominican 3% Salvadoran 3%
- Common ancestry
- Hispanic 13% Scotch-Irish 2% Romanian 2%
- Foreign-born
- 48% · Canada, Jamaica, Dominican Republic
- Languages at home
- 42% English-only · Spanish 37% French/Haitian/Cajun 13% Other Indo-European 2%
Political lean MEDSL · Miami-Dade
- 2024 margin
- R (+11.4) · D 43.9% · R 55.4%
- 2008→2024 swing
- -27.6pp toward R · 2008: 16.1pp · 2024: -11.4pp
- All cycles
- 2024: R+11.4 2020: D+7.3 2016: D+29.6 2012: D+23.7 2008: D+16.1
Not yet ingested
- Civics
- —
Market trends
- HPI YoY
- ▼ -608.34%
- Current HPI
- 328.1733
- Rent YoY
- ▲ 0.22%
- Metro
- Miami-Fort Lauderdale-Pompano Beach, FL
- State GDP YoY
- ▲ 3.28%
- F500 in state
- 36
Industry mix (Fortune 500 HQ in FL)
| Industry | F500 HQs | Revenue |
|---|---|---|
| Industrial Technology | 2 | $29B |
|
||
| Insurance | 2 | $17B |
|
||
| Retail | 1 | $60B |
|
||
| Technology Distribution | 1 | $58B |
|
||
| Homebuilding | 1 | $35B |
|
||
| Technology Manufacturing | 1 | $35B |
|
||
Price history
+610.7% since first listed3 events — show timeline
- 2026-03-27 Listed $199,000 Beaches MLS
- 2004-10-14 Sold (Public Records) $76,900 Public Records
- 1998-11-24 Sold (Public Records) $28,000 Public Records
Property tax history
+16.5%/yrLatest (2025): $2,127 · +4.3% YoY. Source: county tax records.
Cash-flow waterfall
monthlySold comps — $/sqft
last 12 mo · ≤1 miLoading sold comps…