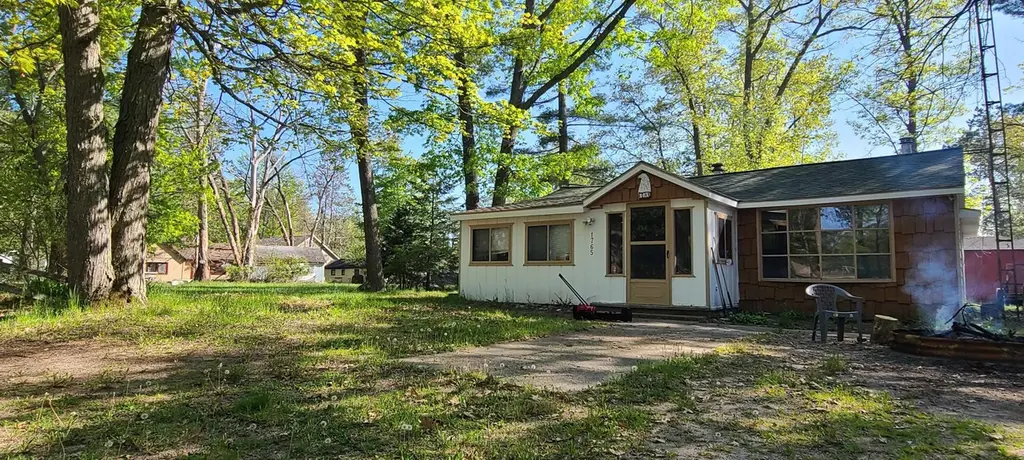
1765 Burgess Rd · Millen, MI
Flood risk No data
- FEMA flood zone
- —
- Chance of flooding over 30 yrs
- —
- Est. flood insurance / yr
- —
Fire risk No data
- Est. fire insurance / yr
- —
Heat risk No data
- Hot days now (above threshold)
- —
- Hot days in 30 yrs
- —
Wind risk No data
- Chance of severe wind over 30 yrs
- —
Air-quality risk No data
- Unhealthy air days now
- —
- Unhealthy air days in 30 yrs
- —
Risk factors via First Street. Map © Google.
Why this score? — see what drove the B grade
The composite is a weighted blend of 9 inputs, each scored 0–100. Each bar is that input's sub-score; the figure is the points it added to the 100-point composite (weight × sub-score).
- Cash flow +29.4/30.0
- DSCR +10.0/10.0
- 1% rule +8.0/10.0
- ARV discount +7.5/15.0
- Appreciation +6.0/10.0
- Rent growth +2.5/5.0
- Schools +2.5/10.0
- Livability +2.5/5.0
- Condition / age +2.5/5.0
$89,900
🖨 Deal sheet 📄 Offer letter ✓ Due diligence
Listing remarks MLS
Looking for an amazing summertine retreat on a budget or affordale HOMEOWNERSHIP, this home in the waterfront community of Jewell Lake is ready for its next owner. This home has three bedrooms with ample storage , one and a half baths, a spacous kitchen and living room placed side by side for a wide open feel despite the lower ceilings (Warning this feature may reduce heating costs) and a guest bath right off the kitcken on the way to the laundry and storage rooms. This home has transformed drastically during the current ownership and has fresh paint and newer carpet and floors. The land is small, enjoy only needing 15 minutes to mow as you stretch your legs or Ask about the sellers overflow lot and and oversized storage lot that are availabe.
Key facts
- Guest bath
- Fresh paint
- Waterfront community
Tags
Property features AI
Exterior
- Utilities: Private well water; Septic tank sewer
- Home design: Single-family residence; One level
- Construction: Aluminum, vinyl, and wood siding; Slab foundation; Built with one-level design
- Exterior features: 60 x 100 lot dimensions; Zoned residential
Interior
- Kitchen: Oven; Refrigerator; Range
- Bathrooms: 1 full bathroom; 1 half bathroom
- Heating & cooling: Forced air heating; Propane heating; Wall furnace; No central cooling
- Interior features: Oven; Refrigerator; Range; Crawl space basement
Neighborhood map
What this means for you Summary
Snapshot
- This is a 3-bed/1.5-bath single-family listed at $90k.
Deal economics
- At list price, monthly cash flow is $320 ($4k/yr) — positive.
- The deal already cash-flows at list — no discount required.
- Meets the 1% rule at list price ($1k rent vs $90k).
- Recommended offer: $89k (1.5% below list) — sets the bar for market timing.
Location & tenants
- Location reads: area grade B — affects rentability + tenant quality, not the cash-flow math above.
- Alcona Community Schools (rural): math 24% / reading 36% proficiency, ranked #374 of 540 in MI (top 69%) — families likely to look elsewhere, expect single-tenant / working-renter base with shorter leases.
- Market conditions: 12 active listings in the ZIP; 38 units permitted in Alcona County in 2024 (0 in 5+ unit buildings).
Forward outlook
- In year one you build about $2k of equity ($622 loan paydown + $2k appreciation (2.0% local appreciation)).
- Alcona County population projected at -37% by 2050 — secular population decline; favor cash flow + early exit over multi-decade hold.
- At projected returns (2.0% appreciation + 3.0% rent growth), your $25k cash investment doubles in ~4 years — after that, you're playing with house money.
Negotiation context
- It's been on market 19 days — a 2% lower offer ($89k) is reasonable based on typical stale-listing flexibility.
- 6 sale attempts since 8y ago with the ask held roughly flat each time — persistent listings suggest the price (not the market) is what's stuck; bring a comps-based counter.
- Current owner paid $18k; list at $90k implies a 399% gain — meaningful room to come down on a strong offer.
Questions for the listing agent
- Built in 1970 — when were the roof, HVAC, electrical panel, plumbing, and water heater last replaced?
- Is there a deadline driving the sale (1031 exchange, divorce, estate, relocation)? That informs how much negotiation room exists.
- What's the average days-on-market for RENTAL listings here right now (not sales)? A rising rental-DOM trend means longer vacancies and softer asking-rent achievability than the comps imply.
- What's the recent tenant-quality profile in this submarket — average credit score on applications, eviction rate, late-payment / NSF rate, and stable-employment percentage? A property-management company in the area should have these aggregated.
- How much new for-sale + rental construction is in the pipeline within 1–3 miles? Heavy new supply typically softens prices + rents 12–24 months out; constrained supply supports both.
Investment metrics
- 1% rule
- 1.30% ✓
- Cap rate
- 10.56%
- Cash-on-cash
- 15.26%
- DSCR
- 1.68
- GRM
- 6.4
CMA / ARV
No comps found within radius.
Projected returns pro-forma
1.99% appreciation · 3.0% rent growth · sell at horizon
- IRR
- 19.5%
- Equity multiple
- 2.05×
- Total profit
- $26,519
- Equity at exit
- $35,424
- IRR
- 21.7%
- Equity multiple
- 3.86×
- Total profit
- $71,960
- Equity at exit
- $50,983
Cash invested: $25,172 (down + closing). Projections, not guarantees.
Landlord ↔ Tenant lean methodology
- Overall (STATE)
- 62 Landlord-Friendly
- State Michigan
- 62 Landlord-Friendly · EVEN
- County
- — inherits STATE
- City
- — inherits STATE
ZIP-level market 48705
- Home prices YoY
- 1.7%
- Active inventory
- 12
- Price-to-rent
- 6.4×
Monthly cashflow live
- Estimated rent
- $1,170 medium interval (Pro) →
- Mortgage (P&I)
- −$471
- Tax from tax record
- −$95 /mo · $1,141/yr
- Insurance
- −$37
- HOA
- −$0
- Vacancy / Maint / Mgmt
- −$246
- Net cashflow
- $320
Break-even live
UW: 25.0% down · 7.5% · 30yr · 1.5% tax · 5.0% vac · 8.0% maint · 8.0% mgmt
Financing live
Cash to close
- Down payment
- $22,475
- Closing costs
- $2,697
- Reserves months
- —
- Total cash needed
- —
Loan-product check · same deal, 3 products live
Conventional
25% down · 7.5% · 30yr
- Down + closing
- —
- Monthly P&I
- —
- Monthly cashflow
- —
- DSCR
- —
- Eligible?
- —
Personal DTI + credit; lowest rate.
DSCR
20% down · 8.5% · 30yr
- Down + closing
- —
- Monthly P&I
- —
- Monthly cashflow
- —
- DSCR
- —
- Eligible?
- —
No personal income docs; deal must DSCR.
Hard money
10% down · 12.0% · 12mo
- Down + closing
- —
- Monthly P&I
- —
- Monthly cashflow
- —
- DSCR
- —
- Eligible?
- —
Short-term bridge; refi at stabilization.
Listing history 15 events
-
2026-06-18days on market $89,900 Active 19 DOM
-
2026-06-17days on market $89,900 Active 18 DOM
-
2026-06-16days on market $89,900 Active 17 DOM
-
2026-06-15days on market $89,900 Active 16 DOM
-
2026-06-13days on market $89,900 Active 14 DOM
-
2026-06-12days on market $89,900 Active 13 DOM
-
2026-06-09days on market $89,900 Active 10 DOM
-
2026-06-08days on market $89,900 Active 9 DOM
-
2026-06-07days on market $89,900 Active 8 DOM
-
2026-06-07days on market $89,900 Active 7 DOM
-
2026-06-04days on market $89,900 Active 4 DOM
-
2026-06-02days on market $89,900 Active 3 DOM
-
2026-06-01days on market $89,900 Active 2 DOM
-
2026-05-31remarks 699-char remark
-
2026-05-31$89,900 Active 1 DOM
ⓘ Source: listings_history table (triggers on properties + properties_extension) + one-shot
backfill from property_details.listing_events for pre-trigger history.
Tax reassessment forecast MI · Partial reset (capped growth)
- Current annual tax
- $1,141 · $95/mo
- Projected year-2 tax
- $1,263 · $105/mo
- Expected delta
- +$122/yr (+$10/mo · 10.7%)
ⓘ Screening estimate from a state-policy table — verify with the county assessor before closing.
Nearby sold comps map
Loading sold comps map…
Walkable amenities ~0.75 mi
Loading nearby amenities…
Taxation est. · year 1
- Rental income
- $14,036
- − Mortgage interest
- −$5,036
- − Property taxes
- −$1,141
- − Insurance
- −$450
- − Repairs & maintenance
- −$1,123
- − Management
- −$1,123
- − Depreciation
- −$2,615
- Taxable income
- $2,548
- Est. tax owed @ 24.0%
- −$612
- After-tax cash flow
- $3,229/yr
For passive investors: Depreciation is non-cash, so a rental often shows a tax loss while cash-flowing — sheltering income. Rental losses are passive: they offset passive income freely, and up to $25,000/yr can offset ordinary (W-2) income if you actively participate and your MAGI is under $100k (phasing out to $0 by $150k); unused losses carry forward. On sale, claimed depreciation is recaptured at up to 25%, and gains may owe capital-gains tax (a 1031 exchange can defer both). Figures are a year-1 estimate at your 24.0% rate — not tax advice; consult a CPA.
Schools (NCES district)
- District
- Alcona Community Schools
- NCES district ID
- 2602160
- Math proficiency
- 24% ▼ -4.00%
- Reading proficiency
- 36% ▼ -9.00%
- Median HH income
- $38,164
- Composite
- 25.03/100
- National rank
- #7552
- State rank
- #374 of 540 in MI
Livability — Millen
No livability data for this city. (Only ~50 U.S. cities are tracked.)
Census & demographics
- Population (ZIP)
- 474
Population outlook (Alcona County) Hauer SSP2
- Today (2025)
- 9,071 people
- By 2030
- 8,331 · -8.2%
- By 2040
- 6,852 · -24.5%
- By 2050
- 5,691 · -37.3%
- By 2075
- 4,229 · -53.4%
- By 2100
- 3,149 · -65.3%
Race, ethnicity, and origin ACS 2023
- Neighborhood character
- Predominantly White (85%)
- Race & ethnicity
- White 85% Two or more races 10% Hispanic / Latino 4%
- Common ancestry
- Romanian 10% Lithuanian 5% Slovak 4%
- Foreign-born
- 1% · Canada
- Languages at home
- 98% English-only · Spanish 2%
Political lean MEDSL · Alcona
- 2024 margin
- Solid R (+41.7) · D 28.6% · R 70.3% · Other 1.1%
- 2008→2024 swing
- -33.8pp toward R · 2008: -7.9pp · 2024: -41.7pp
- All cycles
- 2024: R+41.7 2020: R+38.3 2016: R+40.0 2012: R+18.2 2008: R+7.9
Not yet ingested
- Civics
- —
Market trends
- HPI YoY
- ▲ 1.99%
- Current HPI
- 118.1948
- Rent YoY
- —
- Metro
- —
- State GDP YoY
- ▲ 1.37%
- F500 in state
- 28
Industry mix (Fortune 500 HQ in MI)
| Industry | F500 HQs | Revenue |
|---|---|---|
| Automotive Parts | 3 | $48B |
|
||
| Automotive | 2 | $372B |
|
||
| Chemicals | 1 | $45B |
|
||
| Automotive Retail | 1 | $29B |
|
||
| Healthcare / Medical Devices | 1 | $23B |
|
||
| Automotive Technology | 1 | $20B |
|
||
Price history
+542.1% since first listed13 events — show timeline
- 2026-05-30 Listed $89,900 REALCOMP
- 2026-05-30 Listed $89,900 MiRealSource-MiMLS
- 2023-01-27 Sold (MLS) $18,000 REALCOMP
- 2023-01-27 Sold (MLS) $18,000 WWMLS
- 2023-01-23 Sold (Public Records) $18,000 Public Records
- 2023-01-11 Pending — WWMLS
- 2022-10-20 Relisted — WWMLS
- 2022-09-30 Delisted — WWMLS
- 2022-03-25 Listed $35,000 REALCOMP
- 2022-03-25 Listed $35,000 WWMLS
- 2019-01-11 Sold (MLS) $8,000 WWMLS
- 2019-01-03 Sold (Public Records) $8,000 Public Records
- 2018-04-11 Listed $14,000 WWMLS
Property tax history
+4.2%/yrLatest (2022): $1,141 · +1.2% YoY. Source: county tax records.
Cash-flow waterfall
monthlySold comps — $/sqft
last 12 mo · ≤1 miLoading sold comps…