 Multi-family
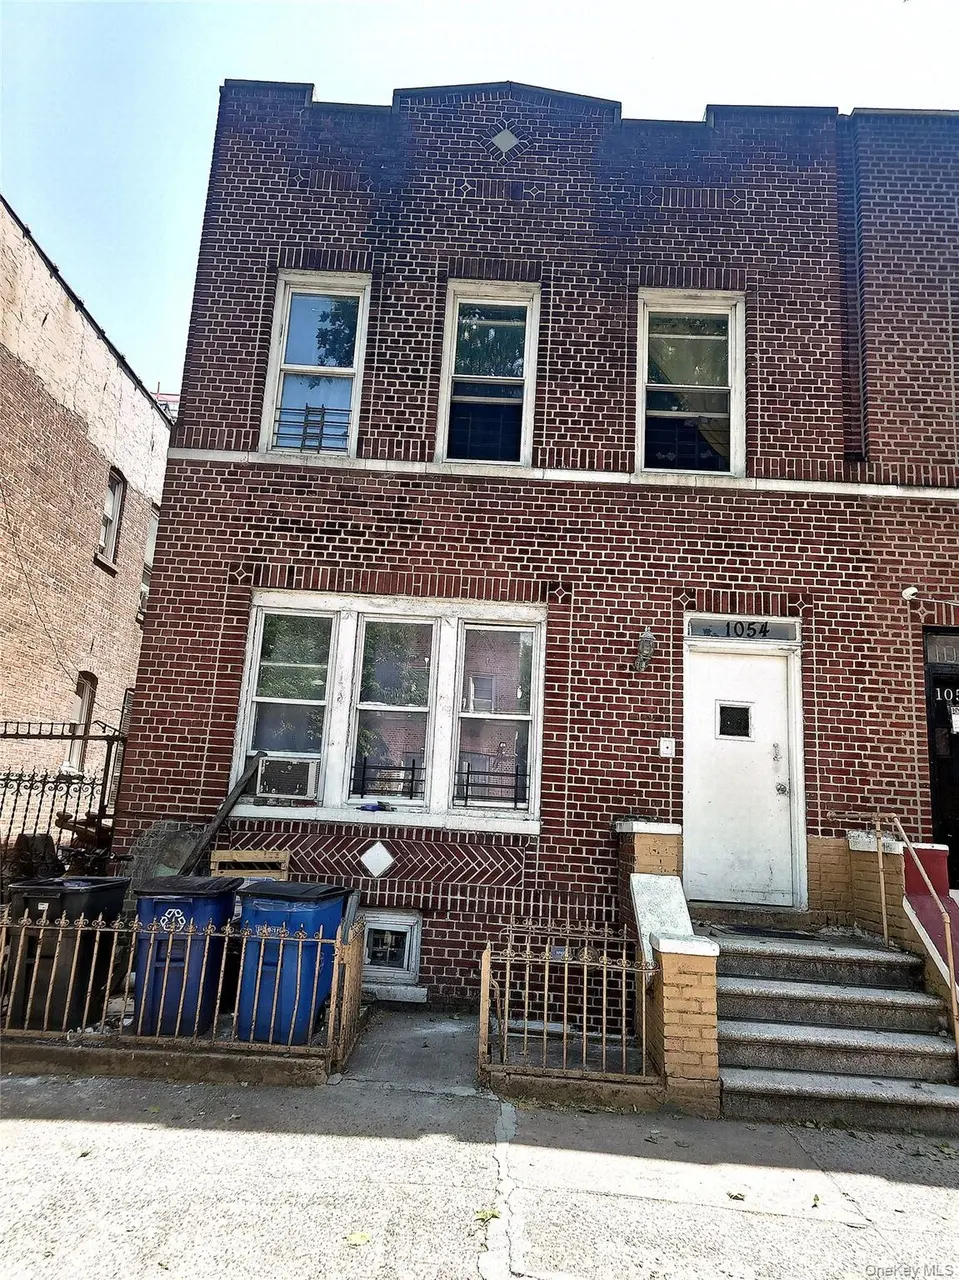
1054 Longfellow Ave · New York, NY
Flood risk 1/10 · Minimal
- FEMA flood zone
- X (unshaded)
- Chance of flooding over 30 yrs
- 0.0%
- Est. flood insurance / yr
- $507 – $1,088
Fire risk 1/10 · Minimal
- Est. fire insurance / yr
- $691 – $1,283
Heat risk 7/10 · Major
- Hot days now (above 99°F)
- 7 days/yr
- Hot days in 30 yrs
- 15 days/yr
Wind risk 6/10 · Moderate
- Chance of severe wind over 30 yrs
- 27.0%
Air-quality risk 4/10 · Minor
- Unhealthy air days now
- 5 days/yr
- Unhealthy air days in 30 yrs
- 6 days/yr
Risk factors via First Street. Map © Google.
Why this score? — see what drove the B grade
The composite is a weighted blend of 9 inputs, each scored 0–100. Each bar is that input's sub-score; the figure is the points it added to the 100-point composite (weight × sub-score).
- Cash flow +21.5/30.0
- ARV discount +15.0/15.0
- Appreciation +8.3/10.0
- DSCR +6.9/10.0
- 1% rule +6.2/10.0
- Schools +5.0/10.0
- Livability +3.8/5.0
- Rent growth +2.5/5.0
- Condition / age +2.5/5.0
$650,000
🖨 Deal sheet (PDF) 📄 Offer letter ✓ Due diligence
Multi-family units
County records classify this as Multi-Family (2-4 Unit). Listing-text estimate: 1 unit. estimate disagrees with records
Listing remarks
Short sale, in foreclosure, third-party approval needed. Short-sale awaiting Bank approval. Price is subject to change based on third-party approval. SOLD AS IS.
Key facts
- 2,500 sq ft lot
- 2 parking spots
- Built 1930
Property features AI
Exterior
- Parking: Shared driveway; Carport (2 spaces)
- Utilities: Electric service by Con-Edison; Public sewer
- Home design: Manufactured on land; Bi-level / multi-split style
- Construction: Brick construction
- Exterior features: Brick exterior; Not waterfront
Interior
- Kitchen: Range; Refrigerator
- Bedrooms: 15 total rooms (includes bedrooms and living spaces)
- Bathrooms: 4 full bathrooms
- Heating & cooling: Hot water heating; Other heating; No central cooling
- Interior features: Unfinished basement; Bi-level / multi-split layout; Other interior features
- Laundry & utility: Utilities: electricity available and connected
Neighborhood map
What this means for you Summary
Snapshot
- This is a 7-bed/4.0-bath multifamily listed at $650k.
Deal economics
- At list price, monthly cash flow is $972 ($12k/yr) — positive.
- The deal already cash-flows at list — no discount required.
- Meets the 1% rule at list price ($7k rent vs $650k).
- Recommended offer: $640k (1.5% below list) — sets the bar for market timing.
- Cap rate 8.1% vs local median 2.6% in New York — top-decile yield for the area; either an underpriced asset or a hidden risk that comps aren't pricing in. Stress-test before assuming the spread holds.
Location & tenants
- Location reads 75/100 on livability (#268 in NY, #4,188 nationally) — a middle-class / working-renter tenant base. Strengths: amenities A+, commute A+, health & safety A; Watch: crime F, cost of living F.
- Zoned schools: Elm Tree Elementary School (math 27% / reading 52%, grade F, #1,444 of 2,108 statewide, top 71%, 806 students, 94% FRL); Jhs 383 Philippa Schuyler (math 32% / reading 67%, grade C, #280 of 729 statewide, top 40%, 822 students, 85% FRL); Midwood High School (math 94% / reading 96%, grade A+, #83 of 1,100 statewide, top 8%, 4,062 students, 73% FRL).
- Market conditions: 38 active listings in the ZIP; 6,929 units permitted in Bronx County in 2024 (6,829 in 5+ unit buildings).
Forward outlook
- In year one you build about $48k of equity ($4k loan paydown + $43k appreciation (6.7% local appreciation)).
- Bronx County population projected at +21% by 2050 — long-run rental-demand tailwind backs the buy-and-hold thesis.
- At projected returns (6.7% appreciation + 3.0% rent growth), your $182k cash investment doubles in ~3 years — after that, you're playing with house money.
- By year 2, paydown + projected appreciation supports a ~$76k cash-out refi (75% LTV) — recoverable capital for the next deal without selling this one.
Negotiation context
- It's been on market 30 days — a 2% lower offer ($640k) is reasonable based on typical stale-listing flexibility.
- 8 sale attempts since 14y ago with the ask held roughly flat each time — persistent listings suggest the price (not the market) is what's stuck; bring a comps-based counter.
- Current owner paid $460k; 41% above their basis — modest negotiation headroom, anchor on the comps not their cost.
Risks & watch-outs
- Watch-outs: built in 1930 — expect roof / HVAC / electrical / plumbing capex.
- Climate carrying-cost: major wind risk, 27% chance of damaging wind over 30y; extreme-heat days projected 7→15/yr by 2055 (HVAC capex compounding) — expect insurance premiums to compound above CPI over the hold.
Questions for the listing agent
- Built in 1930 — when were the roof, HVAC, electrical panel, plumbing, and water heater last replaced?
- Is there a deadline driving the sale (1031 exchange, divorce, estate, relocation)? That informs how much negotiation room exists.
- Schools are B-rated — typically a magnet for longer-tenancy family renters. What's the average tenant stay here, and is there a school-zone premium baked into asking?
- Crime grade is F in this area — have there been break-ins, vandalism, or insurance claims at this property in the last 3 years? What carrier currently insures it and at what premium?
- What's the average days-on-market for RENTAL listings here right now (not sales)? A rising rental-DOM trend means longer vacancies and softer asking-rent achievability than the comps imply.
- What's the recent tenant-quality profile in this submarket — average credit score on applications, eviction rate, late-payment / NSF rate, and stable-employment percentage? A property-management company in the area should have these aggregated.
- How much new apartment / multifamily construction is in the pipeline within 1–3 miles? Heavy new supply (>2% of stock underway) typically softens rents 12–24 months out; light construction supports rent growth.
Investment metrics
- 1% rule
- 1.12% ✓
- Cap rate
- 8.09%
- Cash-on-cash
- 6.41%
- DSCR
- 1.29
- GRM
- 7.4
CMA / ARV
- ARV (on-the-fly)
- $1,024,000
- Comps found
- 12
Show comp detail 12 sales within ~0.75 mi
| Address | Dist | Beds/Ba | Sqft | Sold | Price | $/sf | Match |
|---|---|---|---|---|---|---|---|
| 1056 Longfellow Ave | 0.01mi | 7/4.0 | 3,200 (0%) | 1mo | $1,175,000 | $367 | 99 |
| 1032 Longfellow Ave | 0.04mi | 7/4.0 | 3,200 (0%) | 3mo | $1,200,000 | $375 | 95 |
| 1506 E 172nd St | 0.56mi | 6/4.0 (-1) | 3,198 (-0%) | 2mo | $950,000 | $297 | 67 |
| 990 Jennings St | 0.44mi | 7/5.0 | 3,300 (+3%) | 10mo | $990,000 | $300 | 62 |
| 832 Bryant Ave | 0.48mi | 7/3.0 | 3,120 (-2%) | 14mo | $980,000 | $314 | 58 |
| 1029 Rev James Polite Ave | 0.60mi | 7/4.0 | 3,024 (-6%) | 11mo | $960,000 | $317 | 53 |
| 1439 Vyse Ave | 0.46mi | 6/4.0 (-1) | 3,375 (+6%) | 18mo | $1,000,000 | $296 | 49 |
| 1464 Minford | 0.64mi | 8/4.0 (+1) | 3,174 (-1%) | 18mo | $1,100,000 | $347 | 49 |
| 1030 Elder Ave | 0.50mi | 6/3.0 (-1) | 2,970 (-7%) | 20mo | $950,000 | $320 | 39 |
| 1206 Tinton Ave | 0.73mi | 7/2.0 | 3,507 (+10%) | 11mo | $900,000 | $257 | 33 |
| 1343 Bristow St | 0.62mi | 8/5.0 (+1) | 3,540 (+11%) | 16mo | $1,165,000 | $329 | 31 |
| 1169 Fox St | 0.44mi | 6/3.0 (-1) | 2,760 (-14%) | 20mo | $949,999 | $344 | 31 |
Match score weights: distance 35% · size 25% · config 20% · recency 20%. Top-matched comps best support the ARV.
Projected returns pro-forma
6.66% appreciation · 3.0% rent growth · sell at horizon
- IRR
- 22.1%
- Equity multiple
- 2.51×
- Total profit
- $275,617
- Equity at exit
- $436,023
- IRR
- 20.8%
- Equity multiple
- 5.16×
- Total profit
- $757,066
- Equity at exit
- $815,515
Cash invested: $182,000 (down + closing). Projections, not guarantees.
Landlord ↔ Tenant lean methodology
- Overall (CITY)
- 0 Strongly Tenant-Friendly
- State New York
- 15 Strongly Tenant-Friendly · D+10
- County
- — inherits STATE
- City New York
- 0 Strongly Tenant-Friendly · D+34
ZIP-level market 10459
- Home prices YoY
- 2.5%
- Active inventory
- 38
- Price-to-rent
- 14.9×
Monthly cashflow live
- Estimated rent
- $7,286 medium interval (Pro) →
- Mortgage (P&I)
- −$3,409
- Tax from tax record
- −$1,105 /mo · $13,255/yr
- Insurance
- −$271
- HOA
- −$0
- Vacancy / Maint / Mgmt
- −$1,530
- Net cashflow
- $972
Break-even live
Sensitivity live
| Price | -10% $1,340 | -5% $1,156 | +0% $972 | +5% $788 | +10% $604 |
|---|---|---|---|---|---|
| Rent | -10% $396 | -5% $684 | +0% $972 | +5% $1,260 | +10% $1,547 |
| Rate | -1.0pp $1,299 | -0.5pp $1,137 | base $972 | +0.5pp $803 | +1.0pp $632 |
2-unit breakdown (identical units grouped — click to expand)
| Units | Beds | Baths | Est. rent |
|---|---|---|---|
| 2× units | 2 | 1 | $7,286 |
| #1 | 2 | 1 | $3,643 |
| #2 | 2 | 1 | $3,643 |
| Total (2 units) | $7,286 | ||
UW: 25.0% down · 7.5% · 30yr · 1.5% tax · 5.0% vac · 8.0% maint · 8.0% mgmt
Financing live
Cash to close
- Down payment
- $162,500
- Closing costs
- $19,500
- Reserves months
- —
- Total cash needed
- —
Loan-product check · same deal, 3 products live
Conventional
25% down · 7.5% · 30yr
- Down + closing
- —
- Monthly P&I
- —
- Monthly cashflow
- —
- DSCR
- —
- Eligible?
- —
Personal DTI + credit; lowest rate.
DSCR
20% down · 8.5% · 30yr
- Down + closing
- —
- Monthly P&I
- —
- Monthly cashflow
- —
- DSCR
- —
- Eligible?
- —
No personal income docs; deal must DSCR.
Hard money
10% down · 12.0% · 12mo
- Down + closing
- —
- Monthly P&I
- —
- Monthly cashflow
- —
- DSCR
- —
- Eligible?
- —
Short-term bridge; refi at stabilization.
Listing history 36 events
-
2026-06-21days on market $650,000 Active 30 DOM
-
2026-06-18days on market $650,000 Active 27 DOM
-
2026-06-17days on market $650,000 Active 26 DOM
-
2026-06-16days on market $650,000 Active 25 DOM
-
2026-06-15days on market $650,000 Active 24 DOM
-
2026-06-13days on market $650,000 Active 22 DOM
-
2026-06-10days on market $650,000 Active 18 DOM
-
2026-06-08days on market $650,000 Active 17 DOM
-
2026-06-08days on market $650,000 Active 16 DOM
-
2026-06-04days on market $650,000 Active 13 DOM
-
2026-06-03days on market $650,000 Active 12 DOM
-
2026-06-02days on market $650,000 Active 11 DOM
-
2026-06-01days on market $650,000 Active 10 DOM
-
2026-05-31days on market $650,000 Active 9 DOM
-
2026-05-21$650,000 Active
-
2025-10-23status Pending
-
2025-10-23historical
-
2025-09-29status Active
-
2025-08-29$500,000 Active
-
2025-08-16historical
-
2020-07-05historical
-
2020-02-04$779,000 Active
-
2018-10-31historical
-
2017-06-21status Under Contract
-
2017-06-04price $599,999
-
2017-05-24$399,000 New
-
2016-05-23historical
-
2016-05-23$228,000
-
2012-07-02historical
-
2012-07-02historical
-
2012-02-20
-
2012-02-20$379,000
-
2005-03-25soldstatus $460,000
-
2005-03-25soldstatus $460,000
-
1990-10-29soldstatus $190,000
-
1985-07-02soldstatus $56,000
ⓘ Source: listings_history table (triggers on properties + properties_extension) + one-shot
backfill from property_details.listing_events for pre-trigger history.
Tax reassessment forecast NY · Partial reset (capped growth)
- Current annual tax
- $13,255 · $1,105/mo
- Projected year-2 tax
- $13,255 · $1,105/mo
- Expected delta
- $0/yr ($0/mo · 0.0%)
ⓘ Screening estimate from a state-policy table — verify with the county assessor before closing.
Climate risk First Street
- Flood 1/10 Low FEMA zone X (unshaded) · 0% chance over 30 yrs
- Wildfire 1/10 Low
- Heat 7/10 Severe 7 d/yr ≥99°F today · 15 d/yr by 30 yrs out
- Wind 6/10 Major 27% chance of damaging wind over 30 yrs
- Air quality 4/10 Moderate 5 unhealthy d/yr today · 6 by 30 yrs out
Nearby sold comps map
Loading sold comps map…
Walkable amenities ~0.75 mi
Loading nearby amenities…
Taxation est. · year 1
- Rental income
- $87,432
- − Mortgage interest
- −$36,410
- − Property taxes
- −$13,255
- − Insurance
- −$3,250
- − Repairs & maintenance
- −$6,995
- − Management
- −$6,995
- − Depreciation
- −$18,909
- Taxable income
- $1,618
- Est. tax owed @ 24.0%
- −$388
- After-tax cash flow
- $11,274/yr
For passive investors: Depreciation is non-cash, so a rental often shows a tax loss while cash-flowing — sheltering income. Rental losses are passive: they offset passive income freely, and up to $25,000/yr can offset ordinary (W-2) income if you actively participate and your MAGI is under $100k (phasing out to $0 by $150k); unused losses carry forward. On sale, claimed depreciation is recaptured at up to 25%, and gains may owe capital-gains tax (a 1031 exchange can defer both). Figures are a year-1 estimate at your 24.0% rate — not tax advice; consult a CPA.
Schools (NCES district)
No district data.
Livability — New York
- Score
- 75/100
- State rank
- #268
- US rank
- #4188
Category grades
Schools grade is shown separately in the Schools card above.
Census & demographics
- Census place
- New York, NY
- City population
- 7,731,280
- Population (ZIP)
- 49,753
Population outlook (Bronx County) Hauer SSP2
- Today (2025)
- 1,607,353 people
- By 2030
- 1,681,852 · +4.6%
- By 2040
- 1,824,421 · +13.5%
- By 2050
- 1,945,470 · +21.0%
- By 2075
- 2,187,887 · +36.1%
- By 2100
- 2,244,136 · +39.6%
Race, ethnicity, and origin ACS 2023
- Neighborhood character
- Predominantly Hispanic (66%)
- Race & ethnicity
- Hispanic / Latino 66% Black 29% Two or more races 16% White 1% Asian 1%
- Hispanic origin (detail)
- Mexican 4% Puerto Rican 22% Dominican 31%
- Common ancestry
- Hispanic 1%
- Foreign-born
- 29% · Canada
- Languages at home
- 36% English-only · Spanish 55% French/Haitian/Cajun 2% Other Indo-European 1%
Political lean MEDSL · Bronx
- 2024 margin
- Solid D (+45.4) · D 72.7% · R 27.3%
- 2008→2024 swing
- -32.3pp toward R · 2008: 77.8pp · 2024: 45.4pp
- All cycles
- 2024: D+45.4 2020: D+67.6 2016: D+79.1 2012: D+82.9 2008: D+77.8
Not yet ingested
- Civics
- —
Market trends
- HPI YoY
- ▲ 6.66%
- Current HPI
- 277.1628
- Rent YoY
- —
- Metro
- —
- State GDP YoY
- ▲ 2.60%
- F500 in state
- 92
Industry mix (Fortune 500 HQ in NY)
| Industry | F500 HQs | Revenue |
|---|---|---|
| Financial Services | 10 | $950B |
|
||
| Consumer Goods | 9 | $162B |
|
||
| Insurance | 4 | $225B |
|
||
| Telecommunications | 2 | $144B |
|
||
| Pharmaceuticals | 2 | $112B |
|
||
| Media / Entertainment | 2 | $69B |
|
||
Price history
+1060.7% since first listed22 events — show timeline
- 2026-05-21 Listed $650,000 OneKey® MLS as Distributed by MLS Grid
- 2025-10-23 Pending — OneKey® MLS as Distributed by MLS Grid
- 2025-10-23 Listing Removed — OneKey® MLS as Distributed by MLS Grid
- 2025-09-29 Relisted — OneKey® MLS as Distributed by MLS Grid
- 2025-08-29 Listed $500,000 OneKey® MLS as Distributed by MLS Grid
- 2025-08-16 Coming Soon — OneKey® MLS as Distributed by MLS Grid
- 2020-07-05 Listing Removed — OneKey® MLS as Distributed by MLS Grid
- 2020-02-04 Listed $779,000 OneKey® MLS as Distributed by MLS Grid
- 2018-10-31 Listing Removed — OneKey® MLS as Distributed by MLS Grid
- 2017-06-21 Pending — OneKey® MLS as Distributed by MLS Grid
- 2017-06-04 Price Changed $599,999 OneKey® MLS as Distributed by MLS Grid
- 2017-05-24 Listed $399,000 OneKey® MLS as Distributed by MLS Grid
- 2016-05-23 Listed $228,000 OneKey® MLS as Distributed by MLS Grid
- 2016-05-23 Listing Removed — OneKey® MLS as Distributed by MLS Grid
- 2012-07-02 Listing Removed — OneKey® MLS as Distributed by MLS Grid
- 2012-07-02 Delisted — HGMLS
- 2012-02-20 Listed $379,000 OneKey® MLS as Distributed by MLS Grid
- 2012-02-20 Listed — HGMLS
- 2005-03-25 Sold (Public Records) $460,000 Public Records
- 2005-03-25 Sold (Public Records) $460,000 Public Records
- 1990-10-29 Sold (Public Records) $190,000 Public Records
- 1985-07-02 Sold (Public Records) $56,000 Public Records
Property tax history
+5.2%/yrLatest (2025): $13,255 · +3.2% YoY. Source: county tax records.
Cash-flow waterfall
monthlySold comps — $/sqft
last 12 mo · ≤1 miLoading sold comps…